


 |
市場調查報告書
商品編碼
2113350
碳管理軟體:市場佔有率分析、產業趨勢與統計、成長預測(2026-2031)Carbon Management Software - Market Share Analysis, Industry Trends & Statistics, Growth Forecasts (2026 - 2031) |
||||||

※ 本網頁內容可能與最新版本有所差異。詳細情況請與我們聯繫。
根據 Mordor Intelligence 估計,碳管理軟體市場在 2026 年的價值為 181.7 億美元,預計到 2031 年將達到 315 億美元,在預測期(2026-2031 年)內以 11.63% 的複合年成長率成長。
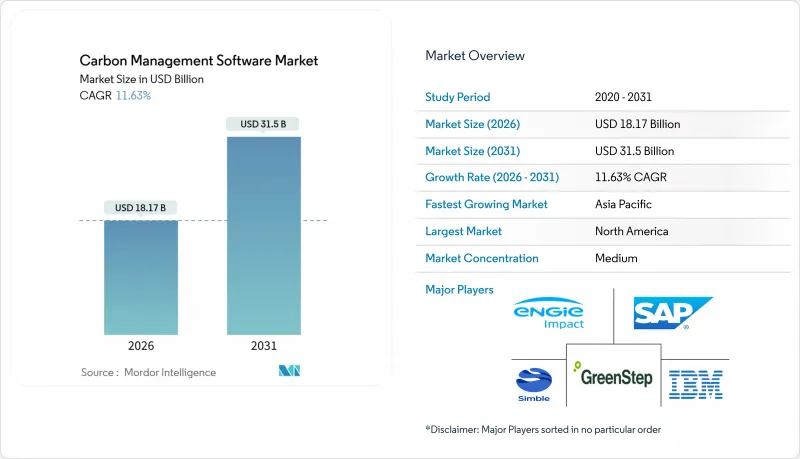
本報告按交付類型(軟體和服務)、部署類型(雲端和本地部署)、應用領域(能源、溫室氣體管理、永續發展等)、最終用戶產業(石油天然氣、製造業、醫療保健等)、組織規模(大型企業和中小企業)以及地區進行細分。市場預測以價值(美元)表示。
全球碳管理軟體市場趨勢及洞察
更嚴格的碳排放資訊揭露規定
美國證券交易委員會(SEC)2024年3月生效的規則導致2025年上半年美國對可審計平台的需求年增40%。同時,企業永續發展報告指令(CSRD)也帶來了類似的壓力,該指令將2025會計年度的報告義務擴大到約5萬家歐洲公司。因此,跨國公司需要多租戶解決方案,以便能夠在不同司法管轄區之間切換模板,而無需重複收集資料。率先將碳排放指標納入季度財務報告的企業,與後進企業相比,外部審計成本降低了25%。目前,競爭優勢在於供應商更新規則庫的速度,以及為監管機構和投資者維護不可篡改的審計追蹤的能力。
企業淨零排放承諾與ESG的壓力
市值超過70兆美元的4000多家公司已設定淨零排放目標,但只有不到五分之一的公司擁有足夠詳細的庫存資訊來追蹤中期里程碑的進展。管理130兆美元資產的資產管理公司要求其投資組合公司全面揭露範圍3的碳排放,碳透明度已成為資金籌措的先決條件。因此,允許主要製造商透過標準化API獲取產品級資料的供應商入口網站正在迅速發展,尤其是在汽車和消費品行業。經檢驗的減排績效正在推動低成本的永續發展掛鉤融資,2024年該市場的新增發行量超過4,500億美元。品牌風險和人才風險是進一步的挑戰。一項2025年的調查顯示,62%的千禧世代會因為雇主沒有可信的脫碳計畫而對其敬而遠之。
中小企業實施和整合成本高昂
初始成本(包括整合和培訓)在 5 萬至 20 萬美元之間,約佔員工人數少於 500 人的公司年度 IT 預算的 2% 至 5%。為傳統 ERP(企業資源計畫)平台實施客製化 API 可能會使專案成本增加 30% 至 50%,並將投資回收期延長至 12 個月以上。由於缺乏內部永續發展專家,公司不得不依賴每小時收費 150 至 300 美元的顧問。此外,缺乏定期測量的能源數據也增加了報告碳足跡的不確定性。雖然免費增值計劃和模組化定價模式正在興起,但資金籌措項目仍然側重於有形資產而非軟體訂閱,這減緩了融資緊張的公司採用新方案的步伐。
細分市場分析
到2025年,服務業務佔總收入的31.7%,但預計將以12.1%的最高複合年成長率成長,因為企業將難以內部配備人員的資料工程和保障任務外包出去。 API開發、ERP連接器配置和資料遷移約佔服務收入的40%。由於資源受限的企業更傾向於選擇能夠維護排放因子庫並處理報告的供應商,託管服務正在成長。在培訓和變更管理支援下,成功實施案例的使用者採納率超過80%。基於績效的定價模式(將費用與檢驗的減排量掛鉤)正在逐漸普及,儘管衡量和歸因決策仍存在爭議。隨著這些模式的成熟,碳管理軟體市場對經常性收入的可見性日益提高,因為服務供應商不再僅僅提供一次性項目,而是更深入地融入客戶的長期工作流程。
當跨國公司需要同時遵守美國、歐盟和亞太地區的法規時,顧問公司會收取高額費用。隨著投資者日益要求根據《企業永續性報告指令》(CSRD)進行獨立檢驗,第三方鑑證已成為一個高成長的細分市場。這些趨勢共同推動了相關服務從單純的輔助角色轉變為核心成長驅動力,從而擴大了碳管理軟體的潛在市場規模(TAM)。
預計到2025年,雲端採用將佔總收入的73.7%,並在2031年之前維持11.9%的複合年成長率。多租用戶架構可將單一用戶成本降低高達60%,而自動更新的規則庫可確保客戶隨時了解不斷變化的揭露框架。超大規模基礎設施也為人工智慧驅動的範圍3估算和即時分析提供所需的運算能力。對於受資料保留要求約束的受監管公共產業和銀行而言,混合模式允許將高度敏感的營運資料儲存在本地,同時將匿名化的匯總資料傳送到雲端進行處理。雖然本地部署仍佔26.3%的佔有率,但隨著供應商宣布終止永久許可並提供遷移積分以促進過渡,其佔有率正在逐年下降。這種轉變使碳管理軟體市場與更廣泛的企業軟體趨勢保持一致,即向訂閱收入和持續交付模式轉型。
邊緣部署在鋼鐵和化工產業正蓬勃發展。在這些產業中,零延遲的分析數據正在最佳化爐膛負載容量,並將能源浪費減少10-15%。隨著5G網路的成熟,供應商期望邊緣原生模組能幫助重工業擺脫頻寬限制。然而,雲端仍然至關重要,因為供應鏈數據聚合和投資者報告需要一個全球可訪問的平台。
區域分析
由於早期監管措施和充裕的創業投資,北美地區氣候分析領域的新創公司迅速湧現,預計2025年,該地區仍將佔全球銷售額的35.85%。美國大型企業每年在碳資訊技術架構方面投資200萬至500萬美元,而加拿大的聯邦碳定價機制也維持了強勁的國內需求。然而,碳管理軟體市場的重心正在向東轉移。
歐洲維持了約30%的市場佔有率,這主要得益於即將實施的《企業永續性報告指令》(CSRD)和碳邊境調節機制(CBAM)。這兩項指令要求出口商記錄從搖籃到大門的碳排放,並對不合規行為徵收關稅。德國、英國和法國佔全部區域支出的60%,這主要歸功於它們總部集中的資料管治職能。該指令的域外適用也間接擴大了市場範圍,因為歐盟以外的供應商被迫遷移到相容的平台。
亞太地區成長最快,複合年成長率達11.85%,這主要得益於中國「碳排放達峰和碳中和」目標以及印度的能源轉型藍圖。日本的「綠色轉型基金」和韓國的碳排放交易義務也是推動成長的重要因素。以新加坡為首的東協成員國正在強制要求上市公司提交碳排放報告,從而促進出口導向供應鏈的全面應用。澳洲和紐西蘭由於長期實施碳排放交易機制,其碳排放報告的普及程度已與北美相當。
南美洲佔銷售額的8%,主要得益於巴西的森林砍伐監測和阿根廷可再生能源的擴張。中東和非洲佔10%,這主要基於沿岸地區能源巨頭的淨零排放承諾以及南非和奈及利亞的碳排放稅計畫。儘管由於基數較小,絕對銷售額並不高,但這兩個地區的交易數量均呈現高於平均水平的成長,這得益於能源多元化政策和投資者嚴格的審查。
其他好處:
- Excel格式的市場預測(ME)表
- 3個月的分析師支持
目錄
第1章:引言
- 研究假設和市場定義
- 調查範圍
第2章:調查方法
第3章執行摘要
第4章 市場狀況
- 市場概覽
- 市場促進因素
- 加強碳排放資訊揭露法規(SEC、CSRD)
- 企業淨零排放承諾與ESG的壓力
- 透過提高能源效率和雲端遷移來降低成本。
- 人工智慧驅動的範圍 3 數據標準化拓展了 ESG 金融的可能性。
- 將代幣化碳權整合到能源管理系統平台中
- 範圍 3 可追溯性的強制性數位產品護照
- 市場限制因素
- 中小企業實施和整合成本高昂
- 與數據準確性和標準化相關的挑戰
- 由於專有排放因子而存在供應商鎖定風險
- 網路安全責任與可審計資料追蹤
- 宏觀經濟因素對市場的影響
- 產業價值鏈分析
- 監理情勢
- 技術展望
- 波特五力分析
- 其他結構分析
- 投資和資金籌措趨勢
- 專利情況
第5章 市場規模與成長預測
- 報價
- 軟體
- 服務
- 部署模式
- 基於雲端的
- 現場
- 透過使用
- 能源
- 溫室氣體管理
- 空氣品質管理
- 永續性
- 其他用途
- 按最終用戶行業分類
- 石油和天然氣
- 製造業
- 衛生保健
- IT/通訊
- 電力/公共產業
- 運輸/物流
- 建築和基礎設施
- 其他終端用戶產業
- 按組織規模
- 大公司
- 小型企業
- 按地區
- 北美洲
- 美國
- 加拿大
- 墨西哥
- 南美洲
- 巴西
- 阿根廷
- 其他南美國家
- 歐洲
- 德國
- 英國
- 法國
- 義大利
- 西班牙
- 俄羅斯
- 其他歐洲國家
- 亞太地區
- 中國
- 日本
- 印度
- 韓國
- ASEAN
- 澳洲和紐西蘭
- 其他亞太國家
- 中東和非洲
- 中東
- 沙烏地阿拉伯
- 阿拉伯聯合大公國
- 土耳其
- 其他中東國家
- 非洲
- 南非
- 奈及利亞
- 其他非洲國家
- 中東
- 北美洲
第6章 競爭情勢
- 市場集中度
- 策略趨勢
- 市佔率分析
- 公司簡介
- IBM Corporation
- SAP SE
- ENGIE Impact
- Simble Solutions Ltd
- GreenStep Solutions Inc.
- Microsoft Corporation
- Schneider Electric SE
- Salesforce.com Inc.
- Greenstone+Ltd
- Sphera Solutions
- Enablon SA(Wolters Kluwer)
- IsoMetrix
- Persefoni AI
- Watershed Technology Inc.
- Plan A
- Net0
- Sinai Technologies Inc.
- Workiva Inc.
- Brightly Software
- Terrascope Pte Ltd
- Carbmee GmbH
- Diligent Corporation
- Emitwise
- Sweep SAS
- Greenly
第7章 市場機會與未來展望
According to Mordor Intelligence, the carbon management software market size is estimated at USD 18.17 billion in 2026, and is expected to reach USD 31.5 billion by 2031, at a CAGR of 11.63% during the forecast period (2026-2031).
This report is Segmented by Offering (Software and Services), Deployment Mode (Cloud-Based and On-Premise), Application (Energy, Greenhouse Gas Management, Sustainability, and More), End-User Industry (Oil and Gas, Manufacturing, Healthcare, and More), Organization Size (Large Enterprises and Small and Medium Enterprises), and Geography. The Market Forecasts are Provided in Terms of Value (USD).
Global Carbon Management Software Market Trends and Insights
Stricter Carbon-Disclosure Regulations
The March 2024 SEC rule triggered a 40% year-over-year surge in U.S. demand for audit-ready platforms during 1H 2025. Parallel pressure stems from the Corporate Sustainability Reporting Directive, which extends mandatory reporting to roughly 50,000 European companies starting with fiscal 2025 filings. Multinationals, therefore, need multi-tenant solutions that toggle between divergent jurisdictional templates without duplicating data collection. Early adopters embedding carbon metrics into quarterly close reports have 25% lower external assurance costs compared with spreadsheet-based late movers. Competitive advantage now hinges on how quickly a vendor updates rule libraries and maintains immutable audit trails for regulators and investors alike.
Corporate Net-Zero Commitments and ESG Pressure
More than 4,000 companies with a market capitalization of USD 70 trillion have set net-zero targets, yet fewer than 1 in 5 maintain inventories granular enough to track progress against interim milestones. Asset managers overseeing USD 130 trillion expect portfolio firms to disclose full Scope-3 emissions, making carbon transparency a capital-access prerequisite. Supplier portals that enable tier-one manufacturers to pull product-level data via standardized APIs are therefore proliferating, especially in automotive and consumer goods. Verified reductions unlock cheaper sustainability-linked loans, a market that exceeded USD 450 billion in new issuance during 2024. Brand and talent risks add another layer: a 2025 survey found 62% of millennials shun employers without credible decarbonization plans.
High Implementation and Integration Costs for SMEs
Initial outlays range from USD 50,000 to USD 200,000, once integration and training are included, equal to 2-5% of a firm's annual IT budget for firms with fewer than 500 staff. Custom APIs for legacy enterprise resource planning platforms can add 30-50% to project costs and push payback beyond 12 months. Limited in-house sustainability talent forces reliance on consultants billing USD 150-USD 300 per hour, while the absent of interval-metered energy data inflates uncertainty in reported footprints. Freemium tiers and modular pricing are emerging, but financing programs still focus on physical assets rather than software subscriptions, slowing uptake among capital-constrained firms.
Other drivers and restraints analyzed in the detailed report include:
- AI-Driven Scope-3 Data Harmonization
- Cost Savings from Energy-Efficiency and Cloud Migration
- Data-Accuracy and Standardization Challenges
For complete list of drivers and restraints, kindly check the Table Of Contents.
Segment Analysis
Services captured 31.7% of 2025 revenue, but they are forecast to post the fastest 12.1% CAGR, as enterprises outsource data engineering and assurance tasks that internal teams struggle to staff. API build work, ERP connector setup, and data migration account for roughly 40% of service billings. Managed services are growing because resource-constrained companies prefer vendors that keep their emission-factor libraries up to date and prepare filings. Training and change-management support drive user adoption rates above 80% in successful rollouts. Outcome-based pricing that links fees to verified reductions is taking hold, though measurement and attribution remain contentious. As these models mature, the carbon management software market sees service providers embedding themselves in long-term client workflows rather than on one-off projects, boosting visibility into recurring revenue.
The consulting component commands premium rates when multinationals juggle U.S., EU, and Asia-Pacific regulations. Third-party assurance is a high-growth niche because investors now demand independent verification under the Corporate Sustainability Reporting Directive. Combined, these trends elevate services from a supporting role to a central growth lever, widening the total addressable market for carbon management software.
Cloud installations accounted for 73.7% of 2025 billings and are expected to maintain an 11.9% CAGR through 2031. Multi-tenant architectures cut per-user costs by up to 60% and automatically update the rule library, keeping customers current with evolving disclosure frameworks. Hyperscale infrastructure also supplies the compute needed for AI-driven Scope-3 estimation and real-time analytics. For regulated utilities and banks subject to data-residency mandates, hybrid models store sensitive operational data on-premise while dispatching anonymized aggregates to the cloud for processing. Although on-premises still holds a 26.3% share, its footprint shrinks each year as vendors announce the end of life for perpetual licenses, offering migration credits to cushion the transition. This shift keeps the carbon management software market aligned with broader enterprise-software trends toward subscription revenue and continuous delivery.
Edge deployments are gaining traction in steel and chemicals, where latency-free insights optimize furnace loads and cut energy waste by 10-15%. As 5G networks mature, vendors expect edge-native modules to free heavy industry from bandwidth constraints. Nonetheless, cloud remains the backbone because supply-chain data aggregation and investor reporting need globally accessible platforms.
Complete Report Scope:
- By Offering
- Software
- Services
- By Deployment Mode
- Cloud-Based
- On-Premise
- By Application
- Energy
- Greenhouse Gas Management
- Air Quality Management
- Sustainability
- Other Applications
- By End-User Industry
- Oil and Gas
- Manufacturing
- Healthcare
- IT and Telecom
- Power and Utilities
- Transportation and Logistics
- Construction and Infrastructure
- Other End-User Industries
- By Organization Size
- Large Enterprises
- Small and Medium Enterprises
- By Geography
- North America
- United States
- Canada
- Mexico
- South America
- Brazil
- Argentina
- Rest of South America
- Europe
- Germany
- United Kingdom
- France
- Italy
- Spain
- Russia
- Rest of Europe
- Asia-Pacific
- China
- Japan
- India
- South Korea
- ASEAN
- Australia and New Zealand
- Rest of Asia-Pacific
- Middle East and Africa
- Middle East
- Saudi Arabia
- United Arab Emirates
- Turkey
- Rest of Middle East
- Africa
- South Africa
- Nigeria
- Rest of Africa
- Middle East
- North America
Geography Analysis
North America retained 35.85% of 2025 turnover, buoyed by early regulatory moves and abundant venture capital that accelerated the formation of start-ups in climate analytics. Large U.S. corporates devote USD 2-USD 5 million annually to carbon-IT stacks, and Canada's federal carbon-pricing framework keeps domestic demand resilient. Yet the carbon management software market is seeing a shift in momentum toward the East.
Europe held a roughly 30% share on the back of the Corporate Sustainability Reporting Directive and the looming Carbon Border Adjustment Mechanism, which forces exporters to document cradle-to-gate emissions or face tariffs. Germany, the United Kingdom, and France account for 60% of regional spend, as headquarters functions centralize data governance. The directive's extraterritorial reach nudges non-EU suppliers toward compatible platforms, indirectly enlarging market scope.
Asia-Pacific is the fastest riser with an 11.85% CAGR, propelled by China's dual-carbon goals and India's energy-transition roadmap. Japan's Green Transformation Fund and South Korea's emissions-trading obligations add further pull. Association of Southeast Asian Nations members, led by Singapore, mandate reporting for listed companies, spurring adoption across export-oriented supply chains. Australia and New Zealand already show uptake levels akin to those in North America, thanks to long-standing cap-and-trade schemes.
South America accounts for 8% of revenue, led by Brazil's deforestation monitoring and Argentina's renewable build-out. The Middle East and Africa contribute 10%, anchored by net-zero pledges from Gulf energy giants and carbon-tax frameworks in South Africa and Nigeria. Though smaller bases temper absolute revenues, both regions show above-average pipeline growth as energy diversification policies and investor scrutiny converge.
- IBM Corporation
- SAP SE
- ENGIE Impact
- Simble Solutions Ltd
- GreenStep Solutions Inc.
- Microsoft Corporation
- Schneider Electric SE
- Salesforce.com Inc.
- Greenstone + Ltd
- Sphera Solutions
- Enablon SA (Wolters Kluwer)
- IsoMetrix
- Persefoni AI
- Watershed Technology Inc.
- Plan A
- Net0
- Sinai Technologies Inc.
- Workiva Inc.
- Brightly Software
- Terrascope Pte Ltd
- Carbmee GmbH
- Diligent Corporation
- Emitwise
- Sweep SAS
- Greenly
Additional Benefits:
- The market estimate (ME) sheet in Excel format
- 3 months of analyst support
TABLE OF CONTENTS
1 INTRODUCTION
- 1.1 Study Assumptions and Market Definition
- 1.2 Scope of the Study
2 RESEARCH METHODOLOGY
3 EXECUTIVE SUMMARY
4 MARKET LANDSCAPE
- 4.1 Market Overview
- 4.2 Market Drivers
- 4.2.1 Stricter Carbon-Disclosure Regulations (SEC, CSRD)
- 4.2.2 Corporate Net-Zero Commitments and ESG Pressure
- 4.2.3 Cost Savings from Energy-Efficiency and Cloud Migration
- 4.2.4 AI-Driven Scope-3 Data Harmonization Unlocks ESG Finance
- 4.2.5 Tokenized Carbon-Credit Integration into EMS Platforms
- 4.2.6 Mandated Digital Product Passports for Scope-3 Traceability
- 4.3 Market Restraints
- 4.3.1 High Implementation and Integration Costs for SMEs
- 4.3.2 Data-Accuracy and Standardization Challenges
- 4.3.3 Vendor Lock-In Risk from Proprietary Emission Factors
- 4.3.4 Cyber-Security Liabilities in Audit-Grade Data Trails
- 4.4 Impact of Macroeconomic Factors on the Market
- 4.5 Industry Value Chain Analysis
- 4.6 Regulatory Landscape
- 4.7 Technological Outlook
- 4.8 Porter's Five Forces Analysis
- 4.8.1 Bargaining Power of Suppliers
- 4.8.2 Bargaining Power of Buyers
- 4.8.3 Threat of New Entrants
- 4.8.4 Threat of Substitutes
- 4.8.5 Intensity of Competitive Rivalry
- 4.9 Other Structural Analyses
- 4.9.1 Investment and Funding Trends
- 4.9.2 Patent Landscape
5 MARKET SIZE AND GROWTH FORECASTS (VALUE)
- 5.1 By Offering
- 5.1.1 Software
- 5.1.2 Services
- 5.2 By Deployment Mode
- 5.2.1 Cloud-Based
- 5.2.2 On-Premise
- 5.3 By Application
- 5.3.1 Energy
- 5.3.2 Greenhouse Gas Management
- 5.3.3 Air Quality Management
- 5.3.4 Sustainability
- 5.3.5 Other Applications
- 5.4 By End-User Industry
- 5.4.1 Oil and Gas
- 5.4.2 Manufacturing
- 5.4.3 Healthcare
- 5.4.4 IT and Telecom
- 5.4.5 Power and Utilities
- 5.4.6 Transportation and Logistics
- 5.4.7 Construction and Infrastructure
- 5.4.8 Other End-User Industries
- 5.5 By Organization Size
- 5.5.1 Large Enterprises
- 5.5.2 Small and Medium Enterprises
- 5.6 By Geography
- 5.6.1 North America
- 5.6.1.1 United States
- 5.6.1.2 Canada
- 5.6.1.3 Mexico
- 5.6.2 South America
- 5.6.2.1 Brazil
- 5.6.2.2 Argentina
- 5.6.2.3 Rest of South America
- 5.6.3 Europe
- 5.6.3.1 Germany
- 5.6.3.2 United Kingdom
- 5.6.3.3 France
- 5.6.3.4 Italy
- 5.6.3.5 Spain
- 5.6.3.6 Russia
- 5.6.3.7 Rest of Europe
- 5.6.4 Asia-Pacific
- 5.6.4.1 China
- 5.6.4.2 Japan
- 5.6.4.3 India
- 5.6.4.4 South Korea
- 5.6.4.5 ASEAN
- 5.6.4.6 Australia and New Zealand
- 5.6.4.7 Rest of Asia-Pacific
- 5.6.5 Middle East and Africa
- 5.6.5.1 Middle East
- 5.6.5.1.1 Saudi Arabia
- 5.6.5.1.2 United Arab Emirates
- 5.6.5.1.3 Turkey
- 5.6.5.1.4 Rest of Middle East
- 5.6.5.2 Africa
- 5.6.5.2.1 South Africa
- 5.6.5.2.2 Nigeria
- 5.6.5.2.3 Rest of Africa
- 5.6.5.1 Middle East
- 5.6.1 North America
6 COMPETITIVE LANDSCAPE
- 6.1 Market Concentration
- 6.2 Strategic Moves
- 6.3 Market Share Analysis
- 6.4 Company Profiles (includes Global level Overview, Market Level Overview, Core Segments, Financials as Available, Strategic Information, Market Rank/Share for Key Companies, Products and Services, and Recent Developments)
- 6.4.1 IBM Corporation
- 6.4.2 SAP SE
- 6.4.3 ENGIE Impact
- 6.4.4 Simble Solutions Ltd
- 6.4.5 GreenStep Solutions Inc.
- 6.4.6 Microsoft Corporation
- 6.4.7 Schneider Electric SE
- 6.4.8 Salesforce.com Inc.
- 6.4.9 Greenstone + Ltd
- 6.4.10 Sphera Solutions
- 6.4.11 Enablon SA (Wolters Kluwer)
- 6.4.12 IsoMetrix
- 6.4.13 Persefoni AI
- 6.4.14 Watershed Technology Inc.
- 6.4.15 Plan A
- 6.4.16 Net0
- 6.4.17 Sinai Technologies Inc.
- 6.4.18 Workiva Inc.
- 6.4.19 Brightly Software
- 6.4.20 Terrascope Pte Ltd
- 6.4.21 Carbmee GmbH
- 6.4.22 Diligent Corporation
- 6.4.23 Emitwise
- 6.4.24 Sweep SAS
- 6.4.25 Greenly
7 MARKET OPPORTUNITIES AND FUTURE OUTLOOK
- 7.1 White-space and Unmet-Need Assessment

 2026-2030年全球製造業碳管理系統市場
 雲端排放管理市場規模、佔有率和成長分析:按組件、部署類型、應用、最終用戶和地區分類-2026-2033年產業預測
 碳管理軟體市場預測至2034年-全球分析(按組件、部署模式、功能、企業規模、訂閱模式、最終用戶和地區分類)
 酵素催化二氧化碳還原市場:全球產業分析、市場規模及佔有率和未來預測(2026-2033 年),按酵素類型、應用、技術、最終用戶、國家和地區分類工業脫碳軟體市場預測至2034年-按軟體類型、部署模式、技術、應用、最終用戶和地區分類的全球分析
 全球碳計量平台市場:市場規模、佔有率、趨勢和成長分析(2026-2034)
 碳中和運輸運輸解決方案市場分析及預測(至2035年):按類型、產品、服務、技術、組件、應用、部署模式、最終用戶和解決方案分類
 2026-2030年全球碳管理軟體市場
 永續發展軟體:市場佔有率分析、產業趨勢與統計、成長預測(2026-2031)工業碳捕集、利用與封存(CCUS)材料市場預測至2034年-全球分析(依材料類型、二氧化碳來源、服務模式、技術、應用、最終用戶及地區分類)