


 |
市場調查報告書
商品編碼
2073372
永續發展軟體:市場佔有率分析、產業趨勢與統計、成長預測(2026-2031)Sustainability Software - Market Share Analysis, Industry Trends & Statistics, Growth Forecasts (2026 - 2031) |
||||||

※ 本網頁內容可能與最新版本有所差異。詳細情況請與我們聯繫。
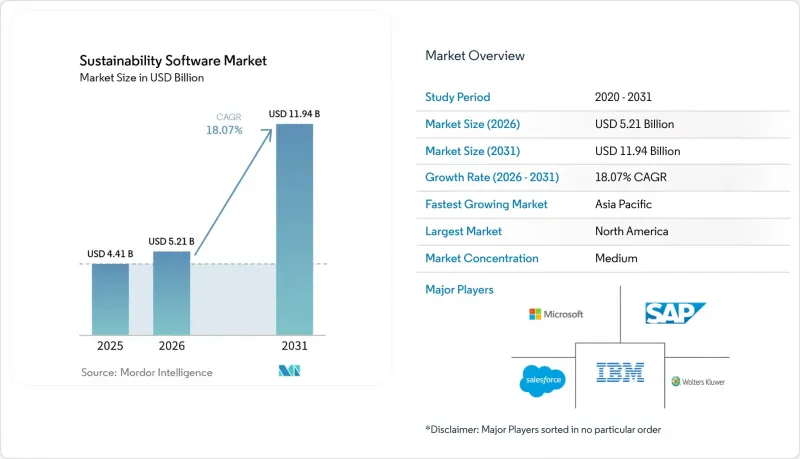
據 Mordor Intelligence 稱,2025 年永續發展軟體市場價值 44.1 億美元,預計到 2031 年將達到 119.4 億美元,而 2026 年為 52.1 億美元,預測期(2026-2031 年)複合年成長率為 18.07%。
本報告按部署類型(雲端、本地部署、混合部署)、軟體類別(碳管理軟體、永續發展報告和管理(ESG)等)、最終用戶公司規模(大型企業等)、最終用戶產業(政府和公共部門、銀行、金融服務和保險 (BFSI)、IT 和電信等)以及地區進行細分。市場預測以美元 (USD) 計價。
全球永續發展軟體市場趨勢與洞察
全球範圍內,ESG資訊揭露法規正變得越來越嚴格。
具有法律約束力的法規正在將永續發展軟體市場從一種可選的分析工具提升為必不可少的基礎設施。美國證券交易委員會 (SEC) 和歐盟的法規對不準確的碳排放數據和缺失的數據處以嚴厲的處罰,這加速了企業在分階段提交截止日期前採用此類軟體。隨著提交階段的逐步實施,預計到 2028 年,對相關平台的需求將持續成長。
企業淨零排放承諾正在推動對碳計量的需求。
為了實現宏偉目標,利用碳管理軟體對範圍 1-3 的排放進行精細化追蹤至關重要。微軟承諾到 2030 年實現碳負排放,並已簽署超過 34 吉瓦的可再生能源契約,這表明軟體如何能夠實現專案監督和排放檢驗。隨著投資者將 ESG 績效與資金籌措掛鉤,強大的數據系統對於確保經營團隊的課責至關重要。
缺乏熟練的永續發展數據分析師
儘管71%的製造商計劃擴大其業務部門,但他們卻難以招募到碳核算專業人員,對ESG人才的需求遠遠超過了供應。對顧問顧問的依賴推高了專案成本,並減緩了企業內部能力的提升,尤其對於中型企業而言更是如此。
細分市場分析
在永續發展軟體市場,預計到2025年,雲端採用將佔據主導地位,市場佔有率達到59.78%,而混合配置預計到2031年將以19.02%的複合年成長率成長。混合模式將雲端分析與本地邊緣處理相結合,使企業能夠在遵守資料居住法規的同時,保持人工智慧驅動的預測能力。能源生產商和製造商正在整合Schneider Electric混合套件等平台,將工廠車間感測器與雲端儀錶板同步,從而即時提高效率。因此,混合採用既滿足合規性要求,又滿足營運要求,並有望成為推動永續發展軟體市場擴張的下一個動力。
此外,混合架構代表著一項前瞻性投資,因為它允許企業根據監管變化在不同環境之間轉移處理負載。網路安全也得到增強,因為高度敏感的營運資料仍然在本地管理,而匯總的洞察資料則安全地儲存在雲端,用於企業級報告。這種柔軟性可望加速電力和製藥等高度監管行業的採用,從而進一步增強永續發展軟體市場應對政策環境變化的能力。
儘管永續發展報告和管理(ESG)在2025年佔總收入的39.45%,但預計到2031年,供應鏈永續發展相關應用將以19.25%的複合年成長率成長,這反映了範圍3排放所面臨的緊迫挑戰。 Blue Yonder收購Pledge後,其自動化貨運排放計算模組得以實現,該模組為物流經理提供即時二氧化碳當量(CO2e)儀表板,並採用可立即滿足合規要求的格式。這些功能將平台的價值從企業報告擴展到日常採購和運輸的最佳化,從而擴大了永續發展軟體市場的潛在基本客群。
另一個成長因素是跨國供應商需要向眾多客戶提供標準化數據。人工智慧機器人透過向數千家供應商請求、檢驗和規範化數據,減少了重複的人工溝通。隨著下游應用範圍的擴大,供應鏈工具在增加收入方面的貢獻預計將超過核心ESG模組,這凸顯了永續發展軟體市場的結構性轉變。
區域分析
預計到2025年,北美將佔據永續發展軟體市場41.62%的佔有率。這主要得益於美國證券交易委員會(SEC)資訊揭露法規和聯邦採購指南的強化推動了相關技術的快速普及。企業正累計核算資產,並使財務報表與強制性碳排放數據保持一致,同時,大量創業投資資金也為建構垂直人工智慧模型的新創公司提供了支持。成熟的諮詢生態系統也進一步簡化了相關技術的普及過程。
預計到2031年,亞太地區的複合年成長率將達到18.31%,為所有地區中最高的。在中國,到2026年,將有超過300家上市公司被要求發布永續發展報告;新加坡證券交易所也要求大多數發行人報告氣候變遷。在快速工業化的背景下,軟體透過推動設備維修,顯著提升了生產效率,這即時印證了從深圳到清奈各地製造地的投資回報率(ROI)的提高。
在歐洲,受監管主導的採納持續強勁,這主要得益於《企業永續發展報告指令》(CSRD),該指令涵蓋超過51,000家公司。 《歐洲永續發展報告標準》(ESRS)要求進行細緻的雙重重要性評估,從而推動了對自動化資料標記和稽核追蹤的需求。德國跨國公司整合混合軟體和工業控制系統,體現了其區域專業知識,並對全球最佳實踐產生影響。
其他好處:
- Excel格式的市場預測(ME)表
- 3個月的分析師支持
目錄
第1章:引言
- 市場定義與研究假設
- 調查範圍
第2章:調查方法
第3章執行摘要
第4章 市場狀況
- 市場概覽
- 市場促進因素
- 全球加強ESG資訊揭露監管
- 企業淨零排放承諾正在推動對碳計量的需求。
- 透過能源和資源最佳化分析降低成本
- 投資者和相關人員要求提供高度透明的ESG數據的壓力
- 利用人工智慧技術收集和自動化處理範圍 3 數據
- ESG與財務報告平台的整合
- 市場限制因素
- 缺乏熟練的永續發展數據分析師
- 企業平台的初始成本很高
- 跨境雲端採用中資料主權面臨的障礙
- 美國部分州對ESG的抵制正在減緩其推廣。
- 價值供應鏈分析
- 重要法規結構的評估
- 對關鍵相關人員的影響評估
- 技術展望
- 波特五力分析
- 宏觀經濟因素的影響
第5章 市場規模與成長預測
- 部署模式
- 雲
- 現場
- 混合
- 軟體類別
- 碳管理軟體
- 永續發展報告與管理(ESG)
- 能源和資源最佳化
- 合規與風險管理
- 供應鏈永續性
- 環境、健康與安全 (EHS)
- 按最終用戶公司規模分類
- 大公司
- 中小企業
- 按最終用戶行業分類
- 政府/公共部門
- BFSI
- 資訊科技/通訊
- 製造業和工業
- 醫療保健和生命科學
- 能源公用事業
- 消費品和零售
- 其他行業
- 按地區
- 北美洲
- 美國
- 加拿大
- 墨西哥
- 南美洲
- 巴西
- 阿根廷
- 其他南美國家
- 歐洲
- 德國
- 英國
- 法國
- 義大利
- 西班牙
- 俄羅斯
- 其他歐洲國家
- 亞太地區
- 中國
- 日本
- 印度
- 韓國
- 澳洲和紐西蘭
- 其他亞太國家
- 中東和非洲
- 中東
- 沙烏地阿拉伯
- 阿拉伯聯合大公國
- 土耳其
- 其他中東國家
- 非洲
- 南非
- 奈及利亞
- 埃及
- 其他非洲國家
- 中東
- 北美洲
第6章 競爭情勢
- 市場集中度
- 策略趨勢
- 市佔率分析
- 公司簡介
- Microsoft Corporation
- SAP SE
- IBM Corporation
- Salesforce, Inc.
- Wolters Kluwer NV
- Nasdaq, Inc.
- Diligent Corporation
- Benchmark Digital Partners LLC(Benchmark ESG)
- Schneider Electric SE
- Greenly SAS
- Workiva Inc.
- Persefoni Inc.
- EcoVadis SAS
- Sphera Solutions, Inc.
- Enablon(Schneider Electric subsidiary)
- VelocityEHS
- Cority Software Inc.
- Plan A Earth GmbH
- Carbmee GmbH
- Siemens AG
第7章 市場機會與未來趨勢
- 評估未開發的領域和未滿足的需求
According to Mordor Intelligence, the sustainability software market size was valued at USD 4.41 billion in 2025 and estimated to grow from USD 5.21 billion in 2026 to reach USD 11.94 billion by 2031, at a CAGR of 18.07% during the forecast period (2026-2031).
This report is Segmented by Deployment Mode (Cloud, On-Premise, and Hybrid), Software Category (Carbon Management Software, Sustainability Reporting and Management (ESG), and More), End-User Enterprise Size (Large Enterprises, and More), End-User Industry (Government and Public Sector, BFSI, IT and Telecom, and More), and Geography. The Market Forecasts are Provided in Terms of Value (USD).
Global Sustainability Software Market Trends and Insights
ESG-Disclosure Regulations Tightening Worldwide
Binding rules elevate the sustainability software market from optional analytics to mandatory infrastructure. SEC and EU mandates now attach material penalties to inaccurate or missing carbon data, driving enterprise-wide roll-outs ahead of phased submission deadlines. Continuous platform demand is expected through 2028 as successive filing tiers take effect
Corporate Net-Zero Commitments Boost Carbon Accounting Demand
Ambitious targets require granular tracking of Scope 1-3 emissions through carbon management software. Microsoft's pledge to reach carbon negativity by 2030, backed by more than 34 GW of contracted renewable power, illustrates how software enables project oversight and removal verification . As investors link ESG outcomes to capital access, robust data systems become essential for executive accountability.
Shortage of Skilled Sustainability Data Analysts
Demand for ESG talent exceeds supply as 71% of manufacturers plan departmental expansion yet struggle to recruit carbon-accounting specialists. Reliance on consultants raises project costs and slows internal capability building, particularly among mid-market firms.
Other drivers and restraints analyzed in the detailed report include:
- Cost Savings From Energy and Resource Optimisation Analytics
- AI-Driven Scope-3 Data Capture and Automation
- High Upfront Cost of Enterprise-Grade Platforms
For complete list of drivers and restraints, kindly check the Table Of Contents.
Segment Analysis
The sustainability software market saw cloud deployment hold a dominant 59.78% sustainability software market share in 2025, while hybrid configurations are forecast to post a 19.02% CAGR through 2031. Hybrid models blend cloud analytics with on-premise edge processing, letting firms comply with data-residency laws yet maintain AI-heavy forecasting capabilities. Energy producers and manufacturers integrate platforms like Schneider Electric's hybrid suite to synchronise plant-floor sensors with cloud dashboards, capturing immediate efficiency gains . Hybrid adoption therefore satisfies both compliance and operational imperatives, positioning it as the next driver of sustainability software market expansion.
Hybrid architectures also future-proof investments because enterprises can shift processing loads between environments as regulations evolve. Cyber-security postures improve when sensitive operational data never leaves controlled premises, yet aggregated insights still reside in secure clouds for enterprise-level reporting. This flexibility is forecast to accelerate penetration in highly regulated sectors such as power utilities and pharmaceuticals, reinforcing the sustainability software market's resilience to changing policy landscapes.
Sustainability reporting and management (ESG) captured 39.45% of revenue in 2025, but supply-chain sustainability applications are on track for a 19.25% CAGR to 2031, reflecting urgent Scope 3 challenges. Automated freight-emission modules, enabled by Blue Yonder's Pledge acquisition, give logistics managers real-time CO2e dashboards and instant compliance formatting. Such capabilities extend platform value beyond corporate reporting into day-to-day procurement and transport optimisation, widening the sustainability software market addressable base.
Growth also stems from multinational suppliers needing to present standardised data to many customers. AI bots request, validate and normalise figures across thousands of vendors, reducing duplicative manual outreach. As adoption spreads downstream, supply-chain tools are poised to surpass core ESG modules in incremental revenue contribution, underscoring a structural shift in the sustainability software market.
Complete Report Scope:
- By Deployment Mode
- Cloud
- On-Premises
- Hybrid
- By Software Category
- Carbon Management Software
- Sustainability Reporting and Management (ESG)
- Energy and Resource Optimisation
- Compliance and Risk Management
- Supply-Chain Sustainability
- Environment, Health and Safety (EHS)
- By End-user Enterprise Size
- Large Enterprises
- Small and Medium Enterprises (SMEs)
- By End-User Industry
- Government and Public Sector
- BFSI
- IT and Telecom
- Manufacturing and Industrial
- Healthcare and Life Sciences
- Energy and Utilities
- Consumer Goods and Retail
- Other Industries
- By Geography
- North America
- United States
- Canada
- Mexico
- South America
- Brazil
- Argentina
- Rest of South America
- Europe
- Germany
- United Kingdom
- France
- Italy
- Spain
- Russia
- Rest of Europe
- Asia-Pacific
- China
- Japan
- India
- South Korea
- Australia and New Zealand
- Rest of Asia-Pacific
- Middle East and Africa
- Middle East
- Saudi Arabia
- United Arab Emirates
- Turkey
- Rest of Middle East
- Africa
- South Africa
- Nigeria
- Egypt
- Rest of Africa
- Middle East
- North America
Geography Analysis
North America held 41.62% sustainability software market share in 2025 as the SEC disclosure rule, plus strengthened federal procurement guidelines, compelled fast adoption. Enterprises rushed to instrument assets and align financial statements with mandated carbon data, while abundant venture funding supported start-ups building vertical AI models. Mature consulting ecosystems further eased implementation.
Asia-Pacific is projected to register an 18.31% CAGR to 2031, the highest regional pace. China will require over 300 publicly listed firms to publish sustainability reports by 2026, and Singapore's exchanges demand climate reporting for most issuers . Rapid industrialisation produces immediate efficiency gains when software recommends equipment retrofits, bolstering ROI arguments across manufacturing corridors from Shenzhen to Chennai.
Europe continues strong regulatory-driven uptake through the Corporate Sustainability Reporting Directive covering more than 51,000 entities. European Sustainability Reporting Standards call for granular double-materiality assessments, driving demand for automated data tagging and audit trails. German multinationals integrating hybrid software with industrial controls showcase regional expertise that influences global best practice.
- Microsoft Corporation
- SAP SE
- IBM Corporation
- Salesforce, Inc.
- Wolters Kluwer N.V.
- Nasdaq, Inc.
- Diligent Corporation
- Benchmark Digital Partners LLC (Benchmark ESG)
- Schneider Electric SE
- Greenly SAS
- Workiva Inc.
- Persefoni Inc.
- EcoVadis SAS
- Sphera Solutions, Inc.
- Enablon (Schneider Electric subsidiary)
- VelocityEHS
- Cority Software Inc.
- Plan A Earth GmbH
- Carbmee GmbH
- Siemens AG
Additional Benefits:
- The market estimate (ME) sheet in Excel format
- 3 months of analyst support
TABLE OF CONTENTS
1 INTRODUCTION
- 1.1 Market Definition and Study Assumptions
- 1.2 Scope of the Study
2 RESEARCH METHODOLOGY
3 EXECUTIVE SUMMARY
4 MARKET LANDSCAPE
- 4.1 Market Overview
- 4.2 Market Drivers
- 4.2.1 ESG-disclosure regulations tightening worldwide
- 4.2.2 Corporate net-zero commitments boost carbon accounting demand
- 4.2.3 Cost-savings from energy and resource optimisation analytics
- 4.2.4 Investor and stakeholder pressure for transparent ESG data
- 4.2.5 AI-driven Scope-3 data capture and automation
- 4.2.6 Convergence of ESG and financial reporting platforms
- 4.3 Market Restraints
- 4.3.1 Shortage of skilled sustainability data analysts
- 4.3.2 High upfront cost of enterprise-grade platforms
- 4.3.3 Data-sovereignty hurdles for cross-border cloud deployment
- 4.3.4 ESG backlash in certain US states dampening adoption
- 4.4 Value / Supply-Chain Analysis
- 4.5 Evaluation of Critical Regulatory Framework
- 4.6 Impact Assessment of Key Stakeholders
- 4.7 Technological Outlook
- 4.8 Porter's Five Forces Analysis
- 4.8.1 Bargaining Power of Suppliers
- 4.8.2 Bargaining Power of Consumers
- 4.8.3 Threat of New Entrants
- 4.8.4 Threat of Substitutes
- 4.8.5 Intensity of Competitive Rivalry
- 4.9 Impact of Macro-economic Factors
5 MARKET SIZE AND GROWTH FORECASTS (VALUE)
- 5.1 By Deployment Mode
- 5.1.1 Cloud
- 5.1.2 On-Premises
- 5.1.3 Hybrid
- 5.2 By Software Category
- 5.2.1 Carbon Management Software
- 5.2.2 Sustainability Reporting and Management (ESG)
- 5.2.3 Energy and Resource Optimisation
- 5.2.4 Compliance and Risk Management
- 5.2.5 Supply-Chain Sustainability
- 5.2.6 Environment, Health and Safety (EHS)
- 5.3 By End-user Enterprise Size
- 5.3.1 Large Enterprises
- 5.3.2 Small and Medium Enterprises (SMEs)
- 5.4 By End-User Industry
- 5.4.1 Government and Public Sector
- 5.4.2 BFSI
- 5.4.3 IT and Telecom
- 5.4.4 Manufacturing and Industrial
- 5.4.5 Healthcare and Life Sciences
- 5.4.6 Energy and Utilities
- 5.4.7 Consumer Goods and Retail
- 5.4.8 Other Industries
- 5.5 By Geography
- 5.5.1 North America
- 5.5.1.1 United States
- 5.5.1.2 Canada
- 5.5.1.3 Mexico
- 5.5.2 South America
- 5.5.2.1 Brazil
- 5.5.2.2 Argentina
- 5.5.2.3 Rest of South America
- 5.5.3 Europe
- 5.5.3.1 Germany
- 5.5.3.2 United Kingdom
- 5.5.3.3 France
- 5.5.3.4 Italy
- 5.5.3.5 Spain
- 5.5.3.6 Russia
- 5.5.3.7 Rest of Europe
- 5.5.4 Asia-Pacific
- 5.5.4.1 China
- 5.5.4.2 Japan
- 5.5.4.3 India
- 5.5.4.4 South Korea
- 5.5.4.5 Australia and New Zealand
- 5.5.4.6 Rest of Asia-Pacific
- 5.5.5 Middle East and Africa
- 5.5.5.1 Middle East
- 5.5.5.1.1 Saudi Arabia
- 5.5.5.1.2 United Arab Emirates
- 5.5.5.1.3 Turkey
- 5.5.5.1.4 Rest of Middle East
- 5.5.5.2 Africa
- 5.5.5.2.1 South Africa
- 5.5.5.2.2 Nigeria
- 5.5.5.2.3 Egypt
- 5.5.5.2.4 Rest of Africa
- 5.5.5.1 Middle East
- 5.5.1 North America
6 COMPETITIVE LANDSCAPE
- 6.1 Market Concentration
- 6.2 Strategic Moves
- 6.3 Market Share Analysis
- 6.4 Company Profiles (includes Global level Overview, Market level overview, Core Segments, Financials as available, Strategic Information, Market Rank/Share for key companies, Products and Services, and Recent Developments)
- 6.4.1 Microsoft Corporation
- 6.4.2 SAP SE
- 6.4.3 IBM Corporation
- 6.4.4 Salesforce, Inc.
- 6.4.5 Wolters Kluwer N.V.
- 6.4.6 Nasdaq, Inc.
- 6.4.7 Diligent Corporation
- 6.4.8 Benchmark Digital Partners LLC (Benchmark ESG)
- 6.4.9 Schneider Electric SE
- 6.4.10 Greenly SAS
- 6.4.11 Workiva Inc.
- 6.4.12 Persefoni Inc.
- 6.4.13 EcoVadis SAS
- 6.4.14 Sphera Solutions, Inc.
- 6.4.15 Enablon (Schneider Electric subsidiary)
- 6.4.16 VelocityEHS
- 6.4.17 Cority Software Inc.
- 6.4.18 Plan A Earth GmbH
- 6.4.19 Carbmee GmbH
- 6.4.20 Siemens AG
7 MARKET OPPORTUNITIES AND FUTURE TRENDS
- 7.1 White-space and Unmet-need Assessment

 碳管理軟體市場預測至2034年-全球分析(按組件、部署模式、功能、企業規模、訂閱模式、最終用戶和地區分類)
 酵素催化二氧化碳還原市場:全球產業分析、市場規模及佔有率和未來預測(2026-2033 年),按酵素類型、應用、技術、最終用戶、國家和地區分類工業脫碳軟體市場預測至2034年-按軟體類型、部署模式、技術、應用、最終用戶和地區分類的全球分析
 全球碳計量平台市場:市場規模、佔有率、趨勢和成長分析(2026-2034)
 碳中和運輸運輸解決方案市場分析及預測(至2035年):按類型、產品、服務、技術、組件、應用、部署模式、最終用戶和解決方案分類
 2026-2030年全球碳管理軟體市場工業碳捕集、利用與封存(CCUS)材料市場預測至2034年-全球分析(依材料類型、二氧化碳來源、服務模式、技術、應用、最終用戶及地區分類)
 雲端碳足跡追蹤軟體:市場佔有率分析、產業趨勢與統計、成長預測(2026-2031)農場級碳分析市場預測至2034年:按組件、部署形式、農場類型、技術、應用、最終用戶和地區分類的全球分析
 氣候與碳融資市場:依市場類型、專案類型、買方類型、碳機制、產業、交易類型和地區分類