


 |
市場調查報告書
商品編碼
2113284
海上退役服務:市場佔有率分析、行業趨勢和統計數據、成長預測(2026-2031 年)Offshore Decommissioning Services - Market Share Analysis, Industry Trends & Statistics, Growth Forecasts (2026 - 2031) |
||||||

※ 本網頁內容可能與最新版本有所差異。詳細情況請與我們聯繫。
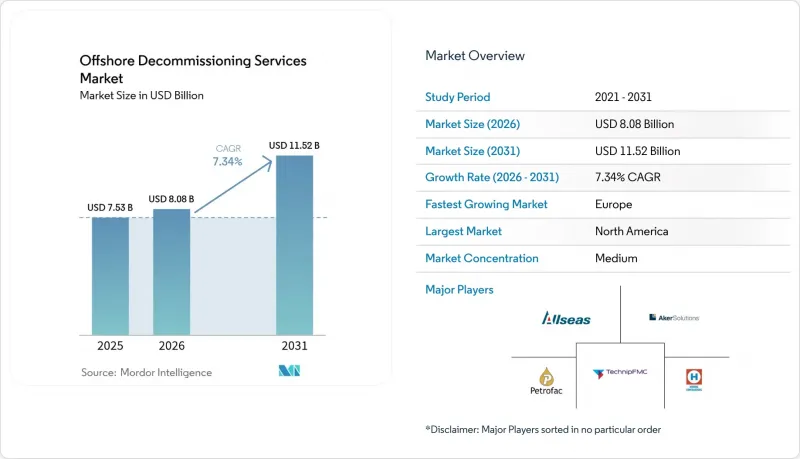
根據 Mordor Intelligence 預測,海上退役服務市場規模將從 2025 年的 75.3 億美元成長到 2026 年的 80.8 億美元,然後在 2031 年達到 115.2 億美元,2026 年至 2031 年的複合年成長率為 7.34%。
本報告按服務類型(封裝和退役、上部/平台拆除等)、水深(淺海、深海、超深海)、基礎設施類型(固定平台和導管架、浮體式生產設施、海底油井和模板等)以及地區(北美、歐洲、亞太地區、南美、中東和非洲)進行分類。
全球海上退役服務市場趨勢與洞察
加快資產退役的關鍵監管要求
世界各地的監管機構正在加強相關法規,以明確運營商何時以及如何對已達到使用壽命的基礎設施進行退役。 2024年4月,美國國家海洋能源管理局(BOEM)推出了一項價值69億美元的財務擔保規則,要求墨西哥灣(GoM)的擁有者在三年內繳納擔保金或實施退役計畫。這項措施旨在解決超過2700口油井和500多個平台的退役問題,這些平台已被認定為已達使用壽命。在歐洲,北海過渡管理局公佈了針對營運商延誤退役的處罰方案,顯示拖延退休將不再被容忍。澳洲的《2025年海洋資源退役藍圖》也反映了類似的立場,證實加強監管已成為全球趨勢。這些措施共同推動了海上退役服務市場的支出成長,並促進了該市場的短期發展。為了避免成本飆升,企業現在越來越傾向於提前終止保證金,這改善了承包商的累積訂單前景。
北海和墨西哥灣老化的基礎設施正接近關閉的臨界點。
許多在1990年以前建造的固定平台目前運轉率極低,不足其原額定產能的10%。殼牌公司對布倫特查理平台的退役(一次31,000噸的吊裝作業)凸顯了承包商面臨的巨大技術挑戰。墨西哥灣超過3,000座設施面臨類似的經濟狀況,而北海仍有1,350座設施在運作。蘊藏量枯竭和低迷的商品價格,加上採用更高產能技術的合理性逐漸減弱,正不斷促使人們傾向於退役油井。資產集中在水深125公尺以下的區域,這使得船隊和人員的標準化成為可能,從而降低了調動成本並加快了專案進度。這種結構老化趨勢維持了長期的需求,並構成了海上退役服務市場的基礎。
成本高昂且存在不確定性,以及資金短缺。
在墨西哥灣部分地區,深海油井的退役成本已高達每口井2,400萬美元,是淺水區類似作業的五倍。鋼材切割耗材、動員燃料以及專業作業人員薪資的上漲,導致一些專案的成本超出最初的工程預算30%至40%。小規模的獨立公司獲得企劃案融資的管道有限,迫使它們推遲專案進度,造成訂單積壓。信貸環境的收緊和日益嚴格的擔保要求進一步加劇了這種壓力。這些因素在短期內減緩了專案的執行速度,並限制了海上油井退役服務市場的成長潛力。
細分市場分析
至2025年,封裝和退役(P&A)將佔總支出的31.85%,成為支撐海上退役服務市場規模的重要支柱。這是因為光在墨西哥灣就有超過27,000口油井等待永久封鎖。雖然每口淺水井的成本在200萬美元到500萬美元之間,但深水油井的封堵和退役成本通常超過2000萬美元,這也解釋了為何該領域會獲得如此巨額的資金投入。巴西石油公司(Petrobras)與衛星群簽署的價值1.7億美元的封鎖和退役框架協議(涵蓋1143天的鑽機運作)清晰地展現了該合約的規模。預計上部模組和平台拆除將成為成長最快的次產業,複合年成長率(CAGR)為8.39%。採用諸如Allseas公司的「開拓精神號」(Pioneering Spirit)等船舶的單次吊裝系統正得到越來越廣泛的應用,因為它能夠縮短海上作業時間並降低專案風險。
隨著成熟深海油田的退役,管道和海底系統退役的佔有率正在擴大。海上退役服務市場正受益於人工智慧驅動的刀具路徑最佳化技術,該技術縮短了切割週期,並能更安全地切割多管管道。現場拆除和監測雖然規模較小,但由於監管機構要求進行多年拆除後海底勘測,其需求也在增加。拆除水下結構,特別是60-150公尺深處的導管架,成本仍然很高,但擴大採用反向安裝方法來縮短吊掛時間。
區域分析
2025年,北美地區佔銷售額的34.55%。美國國家海洋能源管理局(BOEM)的油氣田管理條例加快了墨西哥灣(GoM)的合約授予速度,而位於波特福瓊和英格爾賽德的物流樞紐的建立則實現了快速部署。在墨西哥,隨著墨西哥國家石油公司(Pemex)對非商業油井實施早期封井和退役(P&A)計劃,坎塔雷爾公司(Cantarell)的現有基礎設施進一步提振了市場需求。加拿大的大西洋近海資產雖然數量不多,但由於與退役相關的冰山風險緩解措施,也備受關注。這些發展因素共同作用,使該地區得以繼續保持主導地位。
歐洲是成長最快的地區,複合年成長率達9.54%。英國預計到2050年支出將達到597億英鎊,是該領域的主要市場。與此同時,挪威成熟的埃科菲斯克(Ekofisk)和弗里格(Frigg)油田的退役工作仍在繼續。在歐洲大陸,荷蘭和丹麥近海的管道拆除工作也穩步進行。北海油田資產高度集中,使得多油田作業模式成為可能,從而降低了成本,並擴大了海上退役服務市場中總承包商的市場佔有率。
亞太地區的機會各不相同。馬來西亞200多口閒置油井、澳洲巴斯海峽一座平台的退役以及詹姆斯費雪在泰國快速推進的多平台項目都展現出初步發展勢頭。監管差異使專案進度安排較為複雜,但政府對在地化生產的津貼正在推動合資模式的發展。西澳大利亞卡那封盆地一座深海鑽井設施的退役正在推動對鑽井鑽機的需求,並提升海上退役服務市場的技術水準。
在南美洲,巴西扮演主導角色。光是巴西石油公司(Petrobras)就計劃在2030年前拆除26座平台和18個氣舉歧管,其中一項價值1.7億美元的封井和處置(P&A)合約尤其引人注目,該合約已於2025年訂單。哥倫比亞和特立尼達和多巴哥正在規劃小規模的項目,並將優先考慮當地承包商。中東和非洲蘊藏著新的潛力。儘管埃及在蘇伊士灣的老舊平台和奈及利亞的淺水基礎設施已接近使用壽命終點,但許多地方政府仍在製定相關指導方針。隨著指導方針的逐步完善,預計這些地區將在全球海上退役服務市場中擴大其影響力。
其他好處
- Excel格式的市場預測(ME)表
- 3個月的分析師支持
目錄
第1章:引言
- 研究假設和市場定義
- 調查範圍
第2章:調查方法
第3章執行摘要
第4章 市場狀況
- 市場概覽
- 市場促進因素
- 加快資產處置的關鍵監管要求
- 北海和墨西哥灣的老舊基礎設施已接近使用壽命的終點。
- 投資者要求增加對與財產和資產相關的負債的揭露。
- 由於風力發電專案最終投資決定 (FID) 後重型裝運船隻供應過剩,導致運輸速度放緩。
- 機器人切割和冷切割技術顯著縮短了去除頂部所需的時間。
- 透過廢鋼和「鑽井平台變廢為寶」計畫從循環經濟中獲得收入
- 市場限制因素
- 成本不確定性增加和資金短缺
- 因天氣原因,航班經常延誤。
- 離岸風力發電的快速擴張導致海上支援船和船員短缺。
- 將原本用於碳捕獲與封存(CCS)的資產重新用於其他用途,將延緩其完全移除。
- 供應鏈分析
- 監理情勢
- 技術展望
- 波特五力模型
第5章 市場規模與成長預測
- 按服務類型
- 封裝及廢棄礦井
- 拆除上部結構/平台
- 拆除下部結構(導管架)
- 管道和水下基礎設施的退役
- 場地準備和監測
- 按水深
- 淺水區(水深125公尺以下)
- 深海(125-1500公尺)
- 超深海(超過1500公尺)
- 依基礎設施類型
- 固定平台和夾克
- 浮體式生產設施(FPSO、TLP、Spar)
- 海底油井和模板
- 管道和輸油管線
- 按地區
- 北美洲
- 美國
- 加拿大
- 墨西哥
- 歐洲
- 德國
- 英國
- 法國
- 義大利
- 西班牙
- 北歐國家
- 俄羅斯
- 其他歐洲國家
- 亞太地區
- 中國
- 印度
- 日本
- 韓國
- 澳洲
- 東南亞國協
- 其他亞太國家
- 南美洲
- 阿根廷
- 巴西
- 其他南美國家
- 中東和非洲
- 沙烏地阿拉伯
- 阿拉伯聯合大公國
- 卡達
- 南非
- 其他中東和非洲國家
- 北美洲
第6章 競爭情勢
- 市場集中度
- 策略趨勢(併購、聯盟、購電協議)
- 市場佔有率分析(主要公司的市場排名和佔有率)
- 公司簡介
- Able UK
- Aker Solutions ASA
- AF Gruppen ASA
- John Wood Group PLC
- DNV AS
- Heerema Marine Contractors
- Allseas Group SA
- TechnipFMC PLC
- DeepOcean Group Holding BV
- Equinor ASA
- Petrofac Ltd
- Saipem SpA
- Subsea 7 SA
- Oceaneering International Inc
- Fugro NV
- Kiewit Offshore Services
- Boskalis Westminster NV
- PGS ASA
- DEME Offshore
- Acteon Group Ltd
- Maersk Supply Service
- Shelf Subsea
- Bourbon Subsea Services
- Swiber Holdings Ltd
- VAALCO Energy Inc
第7章 市場機會與未來展望
According to Mordor Intelligence, the offshore decommissioning services market size is expected to grow from USD 7.53 billion in 2025 to USD 8.08 billion in 2026 and is forecast to reach USD 11.52 billion by 2031 at 7.34% CAGR over 2026-2031.
This report is Segmented by Service Type (Well Plugging and Abandonment, Topsides/Platform Removal, and More), Water Depth (Shallow Water, Deepwater, and Ultra-Deepwater), Infrastructure Type (Fixed Platforms and Jackets, Floating Production Systems, Subsea Wells and Templates, and More), and Geography (North America, Europe, Asia-Pacific, South America, and Middle East and Africa).
Global Offshore Decommissioning Services Market Trends and Insights
Leading Regulatory Mandates Accelerating Asset Retirement
Global regulators have tightened the rules that determine when and how operators must retire end-of-life infrastructure. In April 2024, the BOEM introduced a USD 6.9 billion financial assurance rule, compelling GoM leaseholders to post bonds or execute decommissioning programs within a three-year window. The measure addresses a backlog of more than 2,700 wells and 500 platforms identified as overdue. In Europe, the North Sea Transition Authority has issued schedules that penalize operators for slippage, signalling that deferral is no longer tolerated. Australia's 2025 Offshore Resources Decommissioning Roadmap mirrors this stance, confirming that strengthened oversight is a worldwide phenomenon. Collectively, these actions pull forward spending, driving near-term growth in the offshore decommissioning services market. Operators now prefer early abandonment to avoid escalating bonding costs, improving backlog visibility for contractors.
Ageing North Sea & GoM Infrastructure Reaching Cessation-of-Production
Many fixed platforms installed before 1990 now operate at marginal rates of less than 10% of their original nameplate capacity. Shell's retirement of the Brent Charlie platform, a single-lift extraction of 31,000 tonnes, underscored the technical scale awaiting contractors. In the GoM, more than 3,000 structures face similar economics, while 1,350 installations remain active in the North Sea. Depletion alongside low commodity price scenarios undermines the case for enhanced recovery, firmly tilting decisions toward abandonment. Concentration of assets in water depths below 125 m allows fleet and crew standardization, shaving mobilization costs, and accelerating project pipelines. This structural ageing profile sustains a long-duration demand stream that anchors the offshore decommissioning services market.
High Cost Uncertainty & Funding Shortfalls
Deepwater well abandonment costs have risen to USD 24 million per well in parts of the GoM, a five-fold premium over shallow-water analogues. Inflation in steel-cutting consumables, mobilization fuel, and specialized crew wages pushed some projects 30-40% above early engineering estimates. Smaller independent companies lack access to project finance, forcing deferrals that swell their backlog. Bonding requirements have tightened just as credit conditions harden, intensifying pressure. These factors reduce near-term execution velocity and temper upside for the offshore decommissioning services market.
Other drivers and restraints analyzed in the detailed report include:
- Increasing P&A Liability Disclosures Demanded by Investors
- Robotics & Cold-Cutting Tech Slashing Topside Removal Time
- OSV & Crew Bottlenecks as Offshore Wind Surges
For complete list of drivers and restraints, kindly check the Table Of Contents.
Segment Analysis
Well plugging and abandonment represented 31.85% of 2025 spend, anchoring the offshore decommissioning services market size, owing to the 27,000-plus wells awaiting permanent isolation in the GoM alone. The cost per shallow-water well ranges from USD 2 to USD 5 million, but deepwater P&A regularly exceeds USD 24 million, explaining the significant dollar allocation to this segment. Petrobras' USD 170 million P&A framework with Constellation, covering 1,143 days of rig time, illustrates contractual scale. Topsides and platform removal is forecast as the fastest-expanding sub-sector at 8.39% CAGR. Single-lift campaigns, utilizing vessels such as Allseas' Pioneering Spirit, reduce offshore exposure hours and lower project risk, thereby supporting uptake.
Pipeline and subsea-system decommissioning is gaining share as mature deepwater fields retire. The offshore decommissioning services market benefits from AI-driven toolpath optimization, which reduces cut cycles and supports safer multi-string pipeline severance. Site clearance and monitoring, though smaller, show rising growth because regulators mandate multi-year post-removal seabed surveys. Substructure removal, particularly jackets in water depths of 60-150 m, remains cost-intensive; however, it is increasingly executed through reverse-installation methods that shorten lift durations.
Complete Report Scope:
- By Service Type
- Well Plugging and Abandonment
- Topsides/Platform Removal
- Substructure (Jacket) Removal
- Pipeline and Subsea Infrastructure Decommissioning
- Site Clearance and Monitoring
- By Water Depth
- Shallow Water (Below 125 m)
- Deepwater (125 to 1,500 m)
- Ultra-Deepwater (Above 1,500 m)
- By Infrastructure Type
- Fixed Platforms and Jackets
- Floating Production Systems (FPSO, TLP, Spar)
- Subsea Wells and Templates
- Pipelines and Flowlines
- By Geography
- North America
- United States
- Canada
- Mexico
- Europe
- Germnay
- United Kingdom
- France
- Italy
- Spain
- NORDIC Countries
- Russia
- Rest of Europe
- Asia-Pacific
- China
- India
- Japan
- South Korea
- Australia
- ASEAN Countries
- Rest of Asia-Pacific
- South America
- Argentina
- Brazil
- Rest of South America
- Middle East and Africa
- Saudi Arabia
- United Arab Emirates
- Qatar
- South Africa
- Rest of Middle East and Africa
- North America
Geography Analysis
North America retained 34.55% of 2025 revenue. The BOEM bonding rule accelerated GoM contract awards and established logistics hubs in Port Fourchon and Ingleside, enabling rapid mobilization. Mexico's legacy Cantarell infrastructure adds incremental demand as Pemex programs early P&A on non-commercial wells. Canada's Atlantic offshore assets are fewer, but they draw attention for the risk of iceberg mitigation during decommissioning. Together, these dynamics maintain regional primacy for the offshore decommissioning services market.
Europe is the fastest-growing region at a 9.54% CAGR. The UK's projected GBP 59.7 billion spend through 2050 anchors activity, while Norway's mature Ekofisk and Frigg fields continue to retire assets. Continental Europe contributes to pipeline removals in the Dutch and Danish sectors. The North Sea's clustered asset layout favors multi-field campaign approaches, unlocking cost savings and elevating the offshore decommissioning services market share captured by integrated contractors.
Asia-Pacific offers mixed opportunities. Malaysia's 200-plus idle wells, Australia's Bass Strait platform retirements, and Thailand's rapid multi-platform program executed by James Fisher exhibit early momentum. Regulatory heterogeneity complicates scheduling, yet government grants for local content spur joint-venture models. Ultra-deepwater abandonment off Western Australia's Carnarvon Basin is pushing drilling-rig demand and raising technical benchmarks inside the offshore decommissioning services market.
Brazil leads South America. Petrobras alone intends to decommission 26 platforms and 18 gas lift manifolds by 2030, highlighted by the USD 170 million P&A contract awarded in 2025. Colombia and Trinidad plan smaller campaigns that favor regional contractors. The Middle East and Africa present nascent potential: mature Egyptian platforms in the Gulf of Suez and shallow-water Nigerian infrastructure are nearing the end of their lifespan, but many host governments are still refining their guidelines. As clarity improves, these theatres will enlarge the global offshore decommissioning services market footprint.
- Able UK
- Aker Solutions ASA
- AF Gruppen ASA
- John Wood Group PLC
- DNV AS
- Heerema Marine Contractors
- Allseas Group SA
- TechnipFMC PLC
- DeepOcean Group Holding BV
- Equinor ASA
- Petrofac Ltd
- Saipem SpA
- Subsea 7 SA
- Oceaneering International Inc
- Fugro NV
- Kiewit Offshore Services
- Boskalis Westminster NV
- PGS ASA
- DEME Offshore
- Acteon Group Ltd
- Maersk Supply Service
- Shelf Subsea
- Bourbon Subsea Services
- Swiber Holdings Ltd
- VAALCO Energy Inc
Additional Benefits:
- The market estimate (ME) sheet in Excel format
- 3 months of analyst support
TABLE OF CONTENTS
1 Introduction
- 1.1 Study Assumptions & Market Definition
- 1.2 Scope of the Study
2 Research Methodology
3 Executive Summary
4 Market Landscape
- 4.1 Market Overview
- 4.2 Market Drivers
- 4.2.1 Leading regulatory mandates accelerating asset retirement
- 4.2.2 Ageing North Sea & GoM infrastructure reaching cessation-of-production
- 4.2.3 Increasing P&A liability disclosures demanded by investors
- 4.2.4 Heavy-lift vessel over-supply post-wind FID slowdown
- 4.2.5 Robotics & cold-cutting tech slashing topside removal time
- 4.2.6 Circular-economy revenues from scrap steel & rig-to-reef programs
- 4.3 Market Restraints
- 4.3.1 High cost uncertainty & funding shortfalls
- 4.3.2 Frequent schedule slippage due to weather windows
- 4.3.3 OSV & crew bottlenecks as offshore wind surges
- 4.3.4 Asset repurposing for CCS delaying full removals
- 4.4 Supply-Chain Analysis
- 4.5 Regulatory Landscape
- 4.6 Technological Outlook
- 4.7 Porter's Five Forces
- 4.7.1 Bargaining Power of Suppliers
- 4.7.2 Bargaining Power of Buyers
- 4.7.3 Threat of New Entrants
- 4.7.4 Threat of Substitutes
- 4.7.5 Intensity of Competitive Rivalry
5 Market Size & Growth Forecasts
- 5.1 By Service Type
- 5.1.1 Well Plugging and Abandonment
- 5.1.2 Topsides/Platform Removal
- 5.1.3 Substructure (Jacket) Removal
- 5.1.4 Pipeline and Subsea Infrastructure Decommissioning
- 5.1.5 Site Clearance and Monitoring
- 5.2 By Water Depth
- 5.2.1 Shallow Water (Below 125 m)
- 5.2.2 Deepwater (125 to 1,500 m)
- 5.2.3 Ultra-Deepwater (Above 1,500 m)
- 5.3 By Infrastructure Type
- 5.3.1 Fixed Platforms and Jackets
- 5.3.2 Floating Production Systems (FPSO, TLP, Spar)
- 5.3.3 Subsea Wells and Templates
- 5.3.4 Pipelines and Flowlines
- 5.4 By Geography
- 5.4.1 North America
- 5.4.1.1 United States
- 5.4.1.2 Canada
- 5.4.1.3 Mexico
- 5.4.2 Europe
- 5.4.2.1 Germnay
- 5.4.2.2 United Kingdom
- 5.4.2.3 France
- 5.4.2.4 Italy
- 5.4.2.5 Spain
- 5.4.2.6 NORDIC Countries
- 5.4.2.7 Russia
- 5.4.2.8 Rest of Europe
- 5.4.3 Asia-Pacific
- 5.4.3.1 China
- 5.4.3.2 India
- 5.4.3.3 Japan
- 5.4.3.4 South Korea
- 5.4.3.5 Australia
- 5.4.3.6 ASEAN Countries
- 5.4.3.7 Rest of Asia-Pacific
- 5.4.4 South America
- 5.4.4.1 Argentina
- 5.4.4.2 Brazil
- 5.4.4.3 Rest of South America
- 5.4.5 Middle East and Africa
- 5.4.5.1 Saudi Arabia
- 5.4.5.2 United Arab Emirates
- 5.4.5.3 Qatar
- 5.4.5.4 South Africa
- 5.4.5.5 Rest of Middle East and Africa
- 5.4.1 North America
6 Competitive Landscape
- 6.1 Market Concentration
- 6.2 Strategic Moves (M&A, Partnerships, PPAs)
- 6.3 Market Share Analysis (Market Rank/Share for key companies)
- 6.4 Company Profiles (includes Global level Overview, Market level overview, Core Segments, Financials as available, Strategic Information, Products & Services, and Recent Developments)
- 6.4.1 Able UK
- 6.4.2 Aker Solutions ASA
- 6.4.3 AF Gruppen ASA
- 6.4.4 John Wood Group PLC
- 6.4.5 DNV AS
- 6.4.6 Heerema Marine Contractors
- 6.4.7 Allseas Group SA
- 6.4.8 TechnipFMC PLC
- 6.4.9 DeepOcean Group Holding BV
- 6.4.10 Equinor ASA
- 6.4.11 Petrofac Ltd
- 6.4.12 Saipem SpA
- 6.4.13 Subsea 7 SA
- 6.4.14 Oceaneering International Inc
- 6.4.15 Fugro NV
- 6.4.16 Kiewit Offshore Services
- 6.4.17 Boskalis Westminster NV
- 6.4.18 PGS ASA
- 6.4.19 DEME Offshore
- 6.4.20 Acteon Group Ltd
- 6.4.21 Maersk Supply Service
- 6.4.22 Shelf Subsea
- 6.4.23 Bourbon Subsea Services
- 6.4.24 Swiber Holdings Ltd
- 6.4.25 VAALCO Energy Inc
7 Market Opportunities & Future Outlook
- 7.1 White-space & Unmet-Need Assessment


