


 |
市場調查報告書
商品編碼
1871116
海上退役市場機會、成長促進因素、產業趨勢分析及預測(2025-2034年)Offshore Decommissioning Market Opportunity, Growth Drivers, Industry Trend Analysis, and Forecast 2025 - 2034 |
||||||
2024 年全球海上退役市場價值超過 105 億美元,預計到 2034 年將以 6.5% 的複合年成長率成長至 197 億美元。
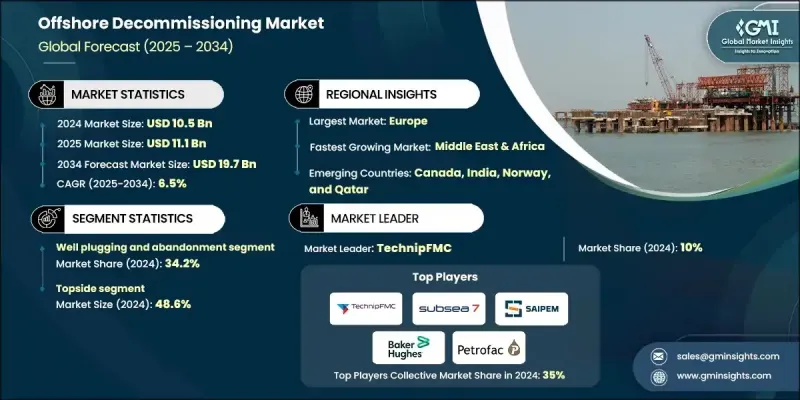
市場成長受監管、環境、經濟和技術等多種因素的共同影響。老化的海上油氣基礎設施,包括平台、管道、海底油井及相關設施,推動了安全高效退役的需求。各國政府和國際機構實施嚴格的法規,以確保符合安全、環境和營運標準,因此,遵守法規是市場發展的關鍵促進因素。日益增強的環保意識和對海洋生物多樣性的關注,增加了對負責任的退役實踐的需求,以最大限度地減少污染、棲息地破壞和其他生態風險。基礎建設的老化程度、原油價格和政府政策等經濟因素也會影響市場動態。企業越來越傾向於尋求兼顧監管要求和營運效率的成本效益解決方案,這推動了全球範圍內創新退役服務和技術的應用。
| 市場範圍 | |
|---|---|
| 起始年份 | 2024 |
| 預測年份 | 2025-2034 |
| 起始值 | 105億美元 |
| 預測值 | 197億美元 |
| 複合年成長率 | 6.5% |
2024年,油井封堵和棄置業務佔市場佔有率的34.2%,預計到2034年將以7%的複合年成長率成長。油井封堵和棄置仍然是海上油田退役的重要組成部分,這是由於監管要求在油井生產壽命結束時安全關閉油井,以防止環境危害並確保作業安全。
2024年,上部模組拆除業務佔據48.6%的市場佔有率,預計2025年至2034年間將以7.1%的複合年成長率成長。隨著海上平台達到使用壽命終點,拆除諸如處理裝置、生活區和起重機等地面結構勢在必行。監管合規、基礎設施老化和安全隱患共同推動了全球對上部模組拆除服務的需求。
亞太地區海上設施退役市場預計到2034年將以6%的複合年成長率成長。馬來西亞、泰國、印尼和澳洲等國強大的海上作業能力、老化的資產、不斷變化的法規以及日益增強的環保意識,都在推動積極主動的退役舉措。許多即將達到營運壽命終點的海上設施,促使營運商和政府更有系統地解決退役問題。
全球海上設施退役市場的主要公司包括:Aker Solutions ASA、Allseas Group SA、AF Gruppen Norge AS、Able UK Ltd、Baker Hughes、Boskalis、DeepOcean Group Holding BV、DNV Group AS、Halliburton、Heerema International Group、John Wood Group PLC、Oceaneering International Inc、PerFMco、Petropac Ltd. plc、Weatherford International Plc 和 Well-Safe Solutions。為了鞏固市場地位,領先的海上設施退役公司致力於開發創新技術,以安全、經濟高效地拆除海底和水面設施。各公司正與營運商和監管機構建立策略聯盟,以確保長期合約並提高服務可靠性。研發投入正推動先進的專案規劃、風險管理和環境永續技術的發展。
目錄
第1章:方法論與範圍
第2章:執行概要
第3章:行業洞察
- 產業生態系統
- 監管環境
- 產業影響因素
- 成長促進因素
- 產業陷阱與挑戰
- 成長潛力分析
- 波特的分析
- PESTEL 分析
- 新興機會與趨勢
- 數位化與物聯網整合
- 新興市場滲透
- 投資分析及未來展望
第4章:競爭格局
- 介紹
- 按地區分類的公司市佔率分析
- 北美洲
- 歐洲
- 亞太地區
- 中東和非洲
- 拉丁美洲
- 戰略儀錶板
- 策略舉措
- 公司標竿分析
- 創新與技術格局
第5章:市場規模及預測:依服務類型分類,2021-2034年
- 主要趨勢
- 許可和監管合規
- 專案管理、工程和規劃
- 起重機駁船的調動與撤離
- 平台準備
- 油井封堵及廢棄
- 導線移除
- 管道和電力電纜退役
- 材料處置
- 場地清理
第6章:市場規模及預測:依結構分類,2021-2034年
- 主要趨勢
- 上部
- 下部結構
- 子基礎設施
第7章:市場規模及預測:依深度分類,2021-2034年
- 主要趨勢
- 淺水
- 深水
第8章:市場規模及預測:依應用領域分類,2021-2034年
- 主要趨勢
- 石油和天然氣
- 風
- 其他
第9章:市場規模及預測:依地區分類,2021-2034年
- 主要趨勢
- 北美洲
- 美國
- 加拿大
- 歐洲
- 英國
- 挪威
- 丹麥
- 德國
- 荷蘭
- 亞太地區
- 中國
- 印度
- 澳洲
- 馬來西亞
- 泰國
- 中東和非洲
- 沙烏地阿拉伯
- 卡達
- 阿拉伯聯合大公國
- 拉丁美洲
- 巴西
- 墨西哥
第10章:公司簡介
- Able UK Ltd
- AF Gruppen Norge AS
- Aker Solutions ASA
- Allseas Group SA
- Baker Hughes
- Boskalis
- DeepOcean Group Holding BV
- DNV Group AS
- Halliburton
- Heerema International Group
- John Wood Group PLC
- Oceaneering International Inc
- Perenco
- Petrofac Ltd.
- Ramboll Group AS
- Saipem SpA
- Subsea 7 SA
- TechnipFMC plc
- Weatherford International Plc.
- Well safe solution
The Global Offshore Decommissioning Market was valued at over USD 10.5 Billion in 2024 and is estimated to grow at a CAGR of 6.5% to reach USD 19.7 Billion by 2034.
Market growth is shaped by a combination of regulatory, environmental, economic, and technological factors. Aging offshore oil and gas infrastructure, including platforms, pipelines, subsea wells, and related facilities, is driving the need for safe and efficient decommissioning. Governments and international bodies enforce stringent regulations to ensure compliance with safety, environmental, and operational standards, making regulatory adherence a critical market driver. Rising environmental awareness and concerns about marine biodiversity are increasing pressure for responsible decommissioning practices to minimize pollution, habitat disruption, and other ecological risks. Economic considerations such as the age of infrastructure, crude oil prices, and government policies also influence market dynamics. Companies are increasingly seeking cost-effective solutions that balance regulatory requirements with operational efficiency, fueling the adoption of innovative decommissioning services and technologies worldwide.
| Market Scope | |
|---|---|
| Start Year | 2024 |
| Forecast Year | 2025-2034 |
| Start Value | $10.5 Billion |
| Forecast Value | $19.7 Billion |
| CAGR | 6.5% |
The well plugging and abandonment segment held a 34.2% share in 2024 and is expected to grow at a CAGR of 7% through 2034. Well plugging and abandonment remains a vital part of offshore decommissioning, driven by regulatory mandates requiring the safe closure of wells at the end of their productive life to prevent environmental hazards and ensure operational safety.
The topside decommissioning segment held a 48.6% share in 2024 and is projected to grow at a CAGR of 7.1% between 2025 and 2034. The removal of surface-level structures such as processing units, living quarters, and cranes is necessary as offshore platforms reach the end of their operational life. Regulatory compliance, aging infrastructure, and safety concerns collectively drive demand for topside dismantling services across the globe.
Asia Pacific Offshore Decommissioning Market will grow at a 6% CAGR through 2034. Strong offshore operations, aging assets, evolving regulations, and heightened environmental awareness in countries such as Malaysia, Thailand, Indonesia, and Australia are encouraging proactive decommissioning initiatives. Many offshore facilities nearing the end of their operational life are pushing operators and governments to address decommissioning more systematically.
Major companies in the Global Offshore Decommissioning Market include Aker Solutions ASA, Allseas Group SA, AF Gruppen Norge AS, Able UK Ltd, Baker Hughes, Boskalis, DeepOcean Group Holding BV, DNV Group AS, Halliburton, Heerema International Group, John Wood Group PLC, Oceaneering International Inc, Perenco, Petrofac Ltd., Ramboll Group AS, Saipem S.p.A., Subsea 7 SA, TechnipFMC plc, Weatherford International Plc, and Well-Safe Solutions. To strengthen their presence, leading offshore decommissioning companies focus on developing innovative technologies for safe and cost-effective dismantling of subsea and topside assets. Firms are forming strategic alliances with operators and regulators to secure long-term contracts and improve service reliability. R&D investments are driving advanced project planning, risk management, and environmentally sustainable techniques.
Table of Contents
Chapter 1 Methodology & Scope
- 1.1 Research design
- 1.1.1 Research approach
- 1.1.2 Data collection methods
- 1.1.3 Base estimates and calculations
- 1.1.4 Base year calculation
- 1.1.5 Key trends for market estimates
- 1.2 Forecast model
- 1.3 Primary research & validation
- 1.3.1 Primary sources
- 1.4 Data mining sources
- 1.5 Market definitions
Chapter 2 Executive Summary
- 2.1 Industry synopsis, 2021 - 2034
- 2.2 Business trends
- 2.3 Service type trends
- 2.4 Structure trends
- 2.5 Depth trends
- 2.6 Application trends
- 2.7 Regional trends
Chapter 3 Industry Insights
- 3.1 Industry ecosystem
- 3.2 Regulatory landscape
- 3.3 Industry impact forces
- 3.3.1 Growth drivers
- 3.3.2 Industry pitfalls & challenges
- 3.4 Growth potential analysis
- 3.5 Porter's analysis
- 3.5.1 Bargaining power of suppliers
- 3.5.2 Bargaining power of buyers
- 3.5.3 Threat of new entrants
- 3.5.4 Threat of substitutes
- 3.6 PESTEL analysis
- 3.6.1 Political factors
- 3.6.2 Economic factors
- 3.6.3 Social factors
- 3.6.4 Technological factors
- 3.6.5 Legal factors
- 3.6.6 Environmental factors
- 3.7 Emerging opportunities & trends
- 3.7.1 Digitalization & IoT integration
- 3.7.2 Emerging market penetration
- 3.8 Investment analysis and future outlook
Chapter 4 Competitive landscape, 2025
- 4.1 Introduction
- 4.2 Company market share analysis, by region, 2024
- 4.2.1 North America
- 4.2.2 Europe
- 4.2.3 Asia Pacific
- 4.2.4 Middle East & Africa
- 4.2.5 Latin America
- 4.3 Strategic dashboard
- 4.4 Strategic initiatives
- 4.5 Company benchmarking
- 4.6 Innovation & technology landscape
Chapter 5 Market Size and Forecast, By Service Type, 2021 - 2034 (USD Billion)
- 5.1 Key trends
- 5.2 Permitting & regulatory compliance
- 5.3 Project management, engineering, & planning
- 5.4 Mobilization & demobilization of derrick barges
- 5.5 Platform preparation
- 5.6 Well plugging and abandonment
- 5.7 Conductor removal
- 5.8 Pipeline and power cable decommissioning
- 5.9 Material disposal
- 5.10 Site clearance
Chapter 6 Market Size and Forecast, By Structure, 2021 - 2034 (USD Billion)
- 6.1 Key trends
- 6.2 Topside
- 6.3 Substructure
- 6.4 Sub infrastructure
Chapter 7 Market Size and Forecast, By Depth, 2021 - 2034 (USD Billion)
- 7.1 Key trends
- 7.2 Shallow water
- 7.3 Deepwater
Chapter 8 Market Size and Forecast, By Application, 2021 - 2034 (USD Billion)
- 8.1 Key trends
- 8.2 Oil & gas
- 8.3 Wind
- 8.4 Others
Chapter 9 Market Size and Forecast, By Region, 2021 - 2034 (USD Billion)
- 9.1 Key trends
- 9.2 North America
- 9.2.1 U.S.
- 9.2.2 Canada
- 9.3 Europe
- 9.3.1 UK
- 9.3.2 Norway
- 9.3.3 Denmark
- 9.3.4 Germany
- 9.3.5 Netherlands
- 9.4 Asia Pacific
- 9.4.1 China
- 9.4.2 India
- 9.4.3 Australia
- 9.4.4 Malaysia
- 9.4.5 Thailand
- 9.5 Middle East & Africa
- 9.5.1 Saudi Arabia
- 9.5.2 Qatar
- 9.5.3 UAE
- 9.6 Latin America
- 9.6.1 Brazil
- 9.6.2 Mexico
Chapter 10 Company Profiles
- 10.1 Able UK Ltd
- 10.2 AF Gruppen Norge AS
- 10.3 Aker Solutions ASA
- 10.4 Allseas Group SA
- 10.5 Baker Hughes
- 10.6 Boskalis
- 10.7 DeepOcean Group Holding BV
- 10.8 DNV Group AS
- 10.9 Halliburton
- 10.10 Heerema International Group
- 10.11 John Wood Group PLC
- 10.12 Oceaneering International Inc
- 10.13 Perenco
- 10.14 Petrofac Ltd.
- 10.15 Ramboll Group AS
- 10.16 Saipem S.p.A.
- 10.17 Subsea 7 SA
- 10.18 TechnipFMC plc
- 10.19 Weatherford International Plc.
- 10.20 Well safe solution


