


 |
市場調查報告書
商品編碼
2113246
美國上游油氣市場:市場佔有率分析、產業趨勢與統計及成長預測(2026-2031年)United States Oil And Gas Upstream - Market Share Analysis, Industry Trends & Statistics, Growth Forecasts (2026 - 2031) |
||||||

※ 本網頁內容可能與最新版本有所差異。詳細情況請與我們聯繫。
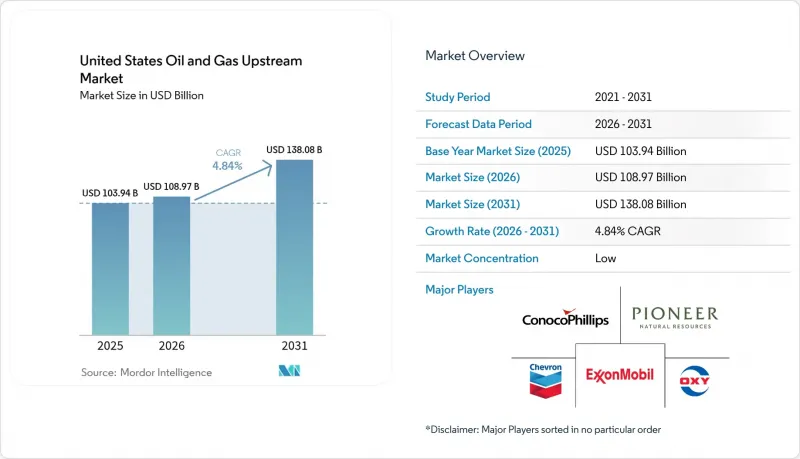
根據 Mordor Intelligence 預測,美國上游油氣市場規模預計將從 2025 年的 1039.4 億美元成長到 2026 年的 1089.7 億美元,然後從 2026 年到 2031 年以 4.84% 的複合年成長,到 2031 年達到 130 億美元。
本報告按部署區域(陸上和海上)、資源類型(石油和天然氣)、油井類型(傳統型和傳統型)以及服務(探勘、開發和生產以及退役)進行細分。市場規模和預測均以美元計價。
美國上游油氣市場趨勢與洞察
透過數位鑽井分析實現成本最佳化
數位化鑽井分析技術透過縮短鑽井週期和最大限度地減少井下事故,可將單井成本降低 10% 至 15%。 SLB 的「Neuro」平台每秒可處理 1000 個資料點,在二疊紀盆地可將鑽井時間縮短 20%。哈里伯頓的「LOGIX」系統在近期的鑽井作業中實現了 95% 的自動化鑽井,將從噴油到鑽井完成的總時間縮短了 30%。 Corva 的雲端儀錶板可提前數小時預測黏滑和差壓卡鑽等風險,從而將意外停機時間減少 30%。隨著演算法從每次鑽井中不斷學習,效能累積提升,最終降低了損益平衡點。這種方法對中小型業者尤其具有吸引力,他們現在可以按訂閱方式租賃軟體,而無需前期投資建立自己的平台。
二疊紀盆地水平頁岩鑽井的擴張
在二疊紀盆地,長距離水平鑽井的初始產量比垂直鑽井高出30%至40%。 2024年下半年,運作中鑽機數量將超過315台,占美國鑽機總數的60%。主要區域的平均水平井筒長度已超過10,000英尺,多層井段的完井提高了重疊層的採收率。與單井平台相比,平台鑽井可減少對地面的影響,並將單井成本降低15%至20%。二疊紀盆地的企業也受益於成熟的運輸和處理網路,該網路降低了收整合本並最大限度地減少了燃燒排放。網路效應正在吸引更多資本,進一步鞏固了該盆地在短週期供應方面的優勢。
原油價格波動與資本紀律壓力
2024年原油價格在每桶70美元至85美元之間波動,生產商將盈虧平衡點維持在每桶45美元左右,並在西德克薩斯中質原油(WTI)價格跌破每桶65美元時減少活躍鑽機的數量。大型企業集團在經濟衰退期間受益於固定折扣服務費用,而獨立公司則經常推遲項目,導致活動減少15%至20%。變動運作結構,例如合約鑽井鑽機、現貨價格壓裂價差和計量型的水務服務,有助於保障現金流。更強勁的資產負債表和更深層的避險提供了競爭優勢,使企業能夠在競爭對手退出市場時擴大市場佔有率。因此,持續的波動性強化了產業重組和資本紀律,並抑制了短期產量成長。
細分市場分析
截至2025年,陸上作業將占美國上游油氣市場的74.18%,反映了陸上作業基礎設施完善、週期短、成本結構有利等優勢。然而,隨著墨西哥灣風險較低的深海油田進入開發階段,預計海上油氣領域將呈現更強勁的成長勢頭,到2031年複合年成長率將達到5.66%。海上專案的初始投資成本較高,但其特徵是產量下降曲線較為平緩,產量穩定期較長,因此更能吸引具有長期投資觀點的資本。雪佛龍的「安克爾」(Anchor)油田和英國石油的「泰伯」(Tiber)油田便是典型的例子,這兩個油田的設計峰值日產量均為7.5萬桶,並採用可控壓力鑽井技術來降低鹽下風險。
海上油氣產業的成長正在提升供應多元化,並緩解美國上游油氣市場整體產量下滑的趨勢。服務供應商正在部署高壓立管系統、即時地質評估和自動化完井管柱,這些技術將開發週期縮短了10%至12%。 2024年,墨西哥灣透過租賃銷售籌集了3.82億美元,營運商在競爭相對較小的情況下以優惠條件獲得了特許經營權。這些舉措支撐著一個良性循環的生產模式,預計將持續到本十年之後。
預計到2025年,天然氣將占美國總產量的54.12%,複合年成長率(CAGR)預計為5.17%,是美國上游油氣市場資源中成長率最高的。阿巴拉契亞地區豐富的乾氣以及二疊紀盆地油井的生產聯產氣正在支撐不斷成長的液化天然氣(LNG)需求和國內電力需求,從而帶來多元化的收入來源。西德克薩斯州和路易斯安那州管道瓶頸的解決,以及加工廠的擴建,正在減少燃燒排放,並透過回收更多高等級天然氣的液化成分來提高油井經濟效益。
儘管原油產量仍維持在相當可觀的水平,但歐佩克+的協調措施和煉油產能的限制正對成長構成阻力。然而,聯產氣正在提升以原油為主的油井的整體獲利能力。在美國上游油氣產業,包含原油、冷凝油油、天然氣和液態天然氣(NGL)的「能源組合」銷售正在成長,從而最佳化了收入來源,使其能夠抵禦市場波動的影響。
其他好處:
- Excel格式的市場預測(ME)表
- 3個月的分析師支持
目錄
第1章:引言
- 研究假設和市場定義
- 調查範圍
第2章:調查方法
第3章執行摘要
第4章 市場狀況
- 市場概覽
- 市場促進因素
- 透過數位鑽井分析實現成本最佳化
- 二疊紀盆地水平頁岩鑽井技術的推廣
- 隨著液化天然氣出口基礎設施的建設不斷推進,天然氣鑽探活動也日益活躍。
- 《通膨抑制法案》下的碳捕獲與封存獎勵正在加速提高石油採收率計畫的進展。
- 將成熟頁岩油井進行再壓裂可以延長油田的壽命。
- 2024年起,墨西哥灣深海採礦區租賃權出售後,風險將降低。
- 市場限制因素
- 原油價格波動與資本紀律壓力
- 聯邦公共土地租賃法規
- 環境、社會及公司治理(ESG)驅動的資產剝離及資金籌措限制
- 先進挖掘工程技術純熟勞工短缺
- 供應鏈分析
- 監理情勢
- 技術展望
- 原油產量和消費量預測
- 天然氣生產與消費預測
- 非傳統資源(緻密油、油砂、深海油田)資本投資預測
- 波特五力模型
- PESTLE分析
第5章 市場規模與成長預測
- 按部署位置
- 陸上
- 離岸
- 按資源類型
- 原油
- 天然氣
- 按井類型
- 傳統的
- 傳統型
- 按服務
- 探勘
- 開發與生產
- 退休
第6章 競爭情勢
- 市場集中度
- 策略趨勢(併購、聯盟、購電協議)
- 市場佔有率分析(主要公司的市場排名和佔有率)
- 公司簡介
- Exxon Mobil Corporation
- Chevron Corporation
- ConocoPhillips
- Occidental Petroleum Corporation
- Pioneer Natural Resources Company
- Devon Energy Corporation
- EOG Resources Inc.
- BP plc
- Shell plc
- Hess Corporation
- Marathon Oil Corporation
- Continental Resources Inc.
- Chesapeake Energy Corporation
- EQT Corporation
- Diamondback Energy Inc.
- Coterra Energy Inc.
- APA Corporation
- Murphy Oil Corporation
- Talos Energy Inc.
- Matador Resources Company
第7章 市場機會與未來展望
According to Mordor Intelligence, the United States oil and gas upstream market size is expected to grow from USD 103.94 billion in 2025 to USD 108.97 billion in 2026 and is forecast to reach USD 138.08 billion by 2031 at 4.84% CAGR over 2026-2031.
This report is Segmented by Location of Deployment (Onshore and Offshore), Resource Type (Crude Oil and Natural Gas), Well Type (Conventional and Unconventional), and Service (Exploration, Development and Production, and Decommissioning). The Market Sizes and Forecasts are Provided in Terms of Value (USD).
United States Oil And Gas Upstream Market Trends and Insights
Cost Optimization Through Digital Drilling Analytics
Digital drilling analytics reduce well costs by 10-15%, primarily by shortening drilling cycles and minimizing downhole incidents. SLB's Neuro platform processes 1,000 data points per second and has reduced drilling time by 20% in the Permian Basin. Halliburton's LOGIX system has logged 95% automated drilling on recent wells, cutting total spud-to-TD time by 30%. Corva's cloud-hosted dashboard predicts stick-slip, differential sticking, and other hazards hours in advance, lowering unexpected downtime by 30%. As algorithms learn from every run, performance gains become cumulative, pushing breakevens downward. The approach is especially attractive to smaller operators that can now lease software on a subscription basis rather than invest upfront in proprietary platforms.
Proliferation of Horizontal Shale Drilling in the Permian Basin
Extended-reach horizontals in the Permian yield initial production 30-40% higher than vertical counterparts, and active rigs topped 315 units-60% of the U.S. total-in late 2024. Average lateral lengths in core acreage already exceed 10,000 ft, with multi-zone completions improving recovery across stacked benches. Pad drilling reduces surface disturbance and trims per-well costs by 15-20% compared to single-well pads. Permian firms also benefit from mature transport and processing grids, which lower gathering costs and minimize flaring. Network effects entice additional capital, reinforcing the basin's lead in short-cycle supply.
Crude-Price Volatility & Capital-Discipline Pressures
Oil prices fluctuated between USD 70 and USD 85/bbl in 2024, prompting producers to maintain breakevens near USD 45/bbl and to reduce their rig fleets when WTI dipped below USD 65/bbl. Integrated majors capitalize on downturns by locking in discounted service rates, whereas independents often defer projects, resulting in a 15-20% reduction in activity. Variable cost structures-such as contracted rigs, spot frac spreads, and pay-as-you-go water services-help protect cash flow. Larger balance sheets and greater hedging depth confer a competitive advantage, enabling market share gains while weaker peers retreat. Continuous volatility thus reinforces consolidation and capital discipline, curbing near-term volume growth.
Other drivers and restraints analyzed in the detailed report include:
- Rising LNG-Export Infrastructure Boosting Gas Drilling
- Inflation Reduction Act CCS Incentives Accelerating EOR Projects
- ESG-Driven Divestment & Financing Constraints
For complete list of drivers and restraints, kindly check the Table Of Contents.
Segment Analysis
Onshore operations accounted for 74.18% of the US oil and gas upstream market in 2025, reflecting established infrastructure, rapid cycle times, and favorable cost profiles. Yet, the offshore segment is forecast to log a stronger 5.66% CAGR through 2031, as de-risked deepwater fields in the Gulf of Mexico move into development. Offshore projects involve higher upfront capital but generate flatter decline curves and longer plateau production, traits that attract patient capital. Chevron's Anchor and BP's Tiber are emblematic, each designed for 75,000 bbl/d peak output with managed-pressure drilling that trims subsalt risk.
Offshore growth bolsters supply diversity and tempers overall decline rates in the US oil and gas upstream market. Service providers are rolling out high-pressure riser systems, real-time formation evaluation, and automated well-completion strings that compress development schedules by 10-12%. As Gulf of Mexico lease sales raised USD 382 million in 2024, operators secured acreage at favorable terms amid muted competition. These commitments underpin a production up-cycle likely to endure beyond the current decade.
Natural gas held 54.12% of 2025 output and is projected to grow at a 5.17% CAGR, the fastest among resources in the US oil and gas upstream market. Abundant Appalachian dry gas and associated gas from Permian oil wells feed expanding LNG and domestic power demand, presenting multiple monetization avenues. Pipeline debottlenecks and processing plant additions in West Texas and Louisiana reduce flaring and capture more rich-gas liquids, improving well economics.
Crude oil volumes, while still substantial, face growth headwinds from OPEC+ coordination and refinery capacity constraints. Nonetheless, associated gas elevates the composite return of oil-weighted wells. The US oil and gas upstream industry is increasingly selling "energy packages" consisting of oil, condensate, gas, and NGLs, thereby optimizing revenue streams against market fluctuations.
Complete Report Scope:
- By Location of Deployment
- Onshore
- Offshore
- By Resource Type
- Crude Oil
- Natural Gas
- By Well Type
- Conventional
- Unconventional
- By Service
- Exploration
- Development and Production
- Decomissioning
List of Companies Covered in this Report:
- Exxon Mobil Corporation
- Chevron Corporation
- ConocoPhillips
- Occidental Petroleum Corporation
- Pioneer Natural Resources Company
- Devon Energy Corporation
- EOG Resources Inc.
- BP plc
- Shell plc
- Hess Corporation
- Marathon Oil Corporation
- Continental Resources Inc.
- Chesapeake Energy Corporation
- EQT Corporation
- Diamondback Energy Inc.
- Coterra Energy Inc.
- APA Corporation
- Murphy Oil Corporation
- Talos Energy Inc.
- Matador Resources Company
Additional Benefits:
- The market estimate (ME) sheet in Excel format
- 3 months of analyst support
TABLE OF CONTENTS
1 Introduction
- 1.1 Study Assumptions & Market Definition
- 1.2 Scope of the Study
2 Research Methodology
3 Executive Summary
4 Market Landscape
- 4.1 Market Overview
- 4.2 Market Drivers
- 4.2.1 Cost optimisation through digital drilling analytics
- 4.2.2 Proliferation of horizontal shale drilling in Permian Basin
- 4.2.3 Rising LNG-export infrastructure boosting gas drilling
- 4.2.4 Inflation Reduction Act CCS incentives accelerating EOR projects
- 4.2.5 Re-fracking of mature shale wells extending field life
- 4.2.6 De-risked deep-water plays in Gulf of Mexico post-2024 lease sales
- 4.3 Market Restraints
- 4.3.1 Crude-price volatility & capital-discipline pressures
- 4.3.2 Federal leasing restrictions on public lands
- 4.3.3 ESG-driven divestment & financing constraints
- 4.3.4 Skilled-labour shortages in advanced drilling ops
- 4.4 Supply-Chain Analysis
- 4.5 Regulatory Landscape
- 4.6 Technological Outlook
- 4.7 Crude-Oil Production & Consumption Outlook
- 4.8 Natural-Gas Production & Consumption Outlook
- 4.9 Unconventional Resources CAPEX Outlook (tight oil, oil sands, deep-water)
- 4.10 Porter's Five Forces
- 4.10.1 Threat of New Entrants
- 4.10.2 Bargaining Power of Suppliers
- 4.10.3 Bargaining Power of Buyers
- 4.10.4 Threat of Substitutes
- 4.10.5 Industry Rivalry
- 4.11 PESTLE Analysis
5 Market Size & Growth Forecast
- 5.1 By Location of Deployment
- 5.1.1 Onshore
- 5.1.2 Offshore
- 5.2 By Resource Type
- 5.2.1 Crude Oil
- 5.2.2 Natural Gas
- 5.3 By Well Type
- 5.3.1 Conventional
- 5.3.2 Unconventional
- 5.4 By Service
- 5.4.1 Exploration
- 5.4.2 Development and Production
- 5.4.3 Decomissioning
6 Competitive Landscape
- 6.1 Market Concentration
- 6.2 Strategic Moves (M&A, Partnerships, PPAs)
- 6.3 Market Share Analysis (Market Rank/Share for key companies)
- 6.4 Company Profiles (includes Global level Overview, Market level overview, Core Segments, Financials as available, Strategic Information, Products & Services, and Recent Developments)
- 6.4.1 Exxon Mobil Corporation
- 6.4.2 Chevron Corporation
- 6.4.3 ConocoPhillips
- 6.4.4 Occidental Petroleum Corporation
- 6.4.5 Pioneer Natural Resources Company
- 6.4.6 Devon Energy Corporation
- 6.4.7 EOG Resources Inc.
- 6.4.8 BP plc
- 6.4.9 Shell plc
- 6.4.10 Hess Corporation
- 6.4.11 Marathon Oil Corporation
- 6.4.12 Continental Resources Inc.
- 6.4.13 Chesapeake Energy Corporation
- 6.4.14 EQT Corporation
- 6.4.15 Diamondback Energy Inc.
- 6.4.16 Coterra Energy Inc.
- 6.4.17 APA Corporation
- 6.4.18 Murphy Oil Corporation
- 6.4.19 Talos Energy Inc.
- 6.4.20 Matador Resources Company
7 Market Opportunities & Future Outlook
- 7.1 White-space & Unmet-need Assessment

 亞太地區油氣資本投資:市場佔有率分析、產業趨勢與統計及成長預測(2026-2031年)工業靜態設備:市場佔有率分析、產業趨勢與統計、成長預測(2026-2031)石油和天然氣工程服務:市場佔有率分析、行業趨勢和統計數據、成長預測(2026-2031 年)
 石油和天然氣產業資本投資市場-2026-2032年全球預測石油和天然氣資本支出(CAPEX):市場佔有率分析、行業趨勢和統計數據以及成長預測(2026-2031 年)泰國上游油氣市場:市場佔有率分析、產業趨勢與統計及成長預測(2026-2031年)石油與天然氣工程服務市場-2026-2032年全球市場預測越南上游油氣市場:市場佔有率分析、產業趨勢與統計及成長預測(2026-2031年)中國上游油氣產業:市場佔有率分析、產業趨勢與統計及成長預測(2026-2031年)東南亞上游油氣市場:市場佔有率分析、產業趨勢與統計及成長預測(2026-2031年)