


 |
市場調查報告書
商品編碼
2100764
建築裝飾石材:市場佔有率分析、產業趨勢與統計及成長預測(2026-2031)Construction Ornamental Stone - Market Share Analysis, Industry Trends & Statistics, Growth Forecasts (2026 - 2031) |
||||||

※ 本網頁內容可能與最新版本有所差異。詳細情況請與我們聯繫。
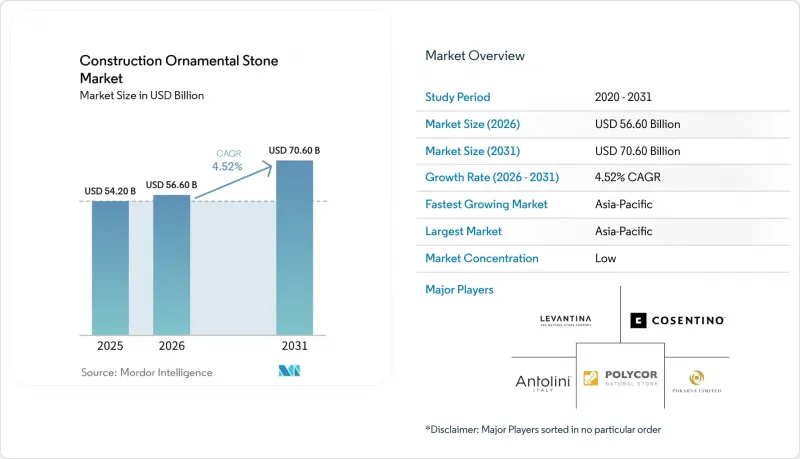
預計裝飾建築石材市場規模將從 2025 年的 542 億美元成長到 2026 年的 566 億美元,然後從 2026 年到 2031 年以 4.52% 的複合年成長率成長,到 2031 年達到 706 億美元。
本報告按石材類型(大理石、花崗岩、石英岩、板岩及其他)、加工形式(原石、拋光板材和切割件)、應用領域(地板材料、牆壁材料、檯面及其他)、最終用戶(住宅和商業)、配銷通路(直銷和分銷商/加工商)以及地區(北美、南美、歐洲、亞太地區以及中東和非洲)進行分類。預測值以美元計價。
全球建築裝飾石材市場趨勢及洞察。
豪華住宅和商業建築數量增加
豪華住宅和商業建築仍然是建築裝飾石材最強勁的需求來源。這是因為這些項目每平方公尺使用的石材量遠高於一般市場建築。 2024年,印度八大城市新增辦公面積達6,640萬平方英尺,孟買、普納和新德里(NCR)先前停工的142座高樓也已復工,這為每個項目帶來了對花崗岩地板材料和外牆材料的大規模需求。在沙烏地阿拉伯,「2030願景」計畫(如NEOM新城、紅海計畫、吉迪亞等)正在為花崗岩和大理石(包括裝飾用和結構用)打造長期穩定的供應管道。在北美和歐洲,「邊住邊裝修」的趨勢也支撐了這一需求,即住宅利用住宅進行室內維修,而不是搬家。儘管新房住宅速度不如以往,但這種趨勢仍然保持了對檯面和地板材料的強勁需求。
市場對兼具美觀性和耐用性的石材的需求日益成長。
裝飾性建築石材市場正日益受到建築師和買家的青睞,他們尋求的是兼具卓越環保性能的耐用材料。天然石材因其使用壽命長、來源管道清晰(在獲得認證的情況下),在綠色認證課程中得到越來越廣泛的應用。天然石材委員會 (NSC) 已根據「NSC 373永續生產標準」對 24 個採石場和 10 家加工商或生產商進行了認證,目標是在 2024 年前完成認證,為採購團隊提供符合 LEED 和 BREEAM 要求的官方框架。義大利石材產業也於 2025 年發布了業界首個基於 ISO 14025 和 EN 15804 標準的「環境產品聲明 (EPD)」。這進一步鞏固了石材在與瓷磚和燒結材料等替代材料進行規格比較時的地位。因此,那些及早投資於認證和產品文件的生產商,將在機構和政府項目中佔據更有利的地位,因為在這些項目中,產地資訊正逐漸成為一項正式要求。
陶瓷、瓷器和燒結材料的替代品
在建築裝飾石材市場,尤其是在中端應用領域,替代材料的興起仍然是最大的競爭限制因素,因為在這些領域,成本和安裝速度比產地更為重要。到2030年代初,燒結石材產品線的複合年成長率將達到7.0%至10.5%,這成長速度明顯高於天然裝飾石材4.5%的預期成長率。由於噴墨裝飾性能的提升、低於0.5%的低吸水率以及PEI IV級或更高級別的耐磨性,釉藥陶瓷瓷磚在機場休息室、酒店大廳和醫療機構等領域的競爭力也日益增強。 2025年發表在《科學報告》雜誌上的一項研究表明,與天然石材相比,陶瓷產品更具競爭力,面臨更大的替代壓力,供應鏈更加柔軟性。而天然石材仍嚴重依賴特定地區的開採,並且深受供應商的影響。雖然天然石材在豪華住宅、歷史建築修復和高階酒店業中仍然佔據著重要地位,但在價格敏感型項目中,由於可以使用類似的材料,天然石材的市場佔有率正在下降。
細分市場分析
到2025年,花崗岩將佔建築裝飾石材市場40%的佔有率,並在按石材類型分類的市場細分中佔據最大佔有率。這一佔有率主要歸功於其在公共基礎設施、住宅地板材料和廚房檯面等領域的優異硬度和成本平衡。中國沿海地區的政府主導計畫持續指定在火車站和政府建築中使用國產花崗岩,從而維持了公共部門的穩定需求。此外,預計到2031年,花崗岩的年複合成長率將達到5.0%,這反映出其在公共工程中的持續應用以及在大規模地板材料鋪設工程中的成本績效效益。
在石材類別中,大理石保持著第二大市場佔有率,豪華酒店和度假村持續指定將其用於大廳、水療中心和其他令人印象深刻的室內空間。在裝飾石材市場,石英岩因其硬度和獨特的紋理,在高階應用領域持續受到關注。 2025年5月,科森蒂諾(Cosentino)在其「Sensa by Cosentino」天然石材系列中新增了六款受保護的石英岩產品,進一步拓展了這一高階市場。板岩、石灰石、砂岩和其他天然石材在歷史建築修復、景觀設計、寺廟建設以及其他對材料真實性要求極高的項目中繼續發揮著至關重要的作用。因此,儘管花崗岩在銷售量仍佔據主導地位,但高階市場的成長正向更具設計吸引力的高價值石材擴展。雖然石英岩的基數小規模,但其在客製化檯面和特色牆設計中的商業性價值顯而易見。願意為視覺差異化買單的買家的存在,是石英岩在豪華住宅和酒店項目中市場佔有率不斷成長的原因之一。在那些更注重檔次和視覺衝擊力而非維護保養的領域,大理石依然佔據著重要地位。儘管整體銷售量仍以傳統主流石材為主導,但消費者對高階石材的需求正轉向視覺效果驚豔的材料,預計這些材料的價格也會更高。
到2025年,未經加工的天然石材將佔銷售額的78%,成為建築裝飾石材市場中最大的生產形式。這一主導地位反映了該市場作為加工商和製造商上游原料來源的作用,這些加工商和製造商透過在本地和區域市場進行加工來創造附加價值。採石場的生產仍然主要集中在供應基礎的石塊和板材,因為許多買家依賴下游的加工流程來滿足專案的特定需求。儘管擁有銷售優勢,但預計到2031年,拋光板材的年複合成長率將達到6.0%,使其成為成長最快的生產形式。
拋光板材的成長與高階廚房、浴室、飯店室內設計以及需要完整展示板材的特色牆密切相關。人工智慧驅動的板材擺放工具能夠減少15%至30%的材料浪費,同時不影響天然紋理,進而提升拋光產品的經濟效益。此外,「按需切割」規格在翻新工程中也越來越受歡迎,因為其高精度的尺寸能夠減少施工過程中的廢棄物並節省現場人工。作為Polycore北美業務改進計劃的一部分,該公司引入了「乾舖檢驗」技術,以幫助在出貨前匹配紋理和顏色,從而降低高規格項目中出現不合格的風險。這些變化表明,儘管原石仍佔當前出貨量的大部分,但價值創造正逐漸轉移到加工和精加工階段。
區域分析
預計到2025年,亞太地區將佔據建築裝飾石材市場48%的佔有率,並將在2031年之前以6.0%的複合年成長率持續成長。這意味著該地區不僅目前佔據最大的市場佔有率,而且在全球市場中也擁有最快的成長速度。由於活躍的建設活動以及公共和私人項目中對高階裝飾材料的高需求,中國和印度仍然是需求的核心。近年來,中國的都市化已達68%,這持續支撐著高層住宅、政府建築和交通基礎設施對花崗岩地板材料、大理石大廳和石材外牆的需求。在印度,智慧城市計畫、經濟適用住宅供應計畫以及對阿拉伯聯合大公國、韓國和越南的出口多元化進一步推動了需求成長。
日本和韓國對裝飾石材的需求主要來自商業設施的翻新改造,而非大規模新建案。在這些國家,老舊的飯店和零售設施正透過採用高階石材飾面進行維修,以提升其在人口密集的城市市場的資產價值。澳洲和東南亞則透過豪華住宅和度假村開發,實現了穩定的市場需求成長。這些因素共同支撐著亞太地區裝飾石材市場的發展,該市場主要由大規模城市建設和高價值、設計導向項目所驅動。此外,亞太地區幅員遼闊,使其更能抵禦個別國家經濟放緩的影響,從而增強了其相對於其他地區的競爭優勢。
北美和歐洲的成長趨勢較為溫和,但各地區的內部促進因素有所不同。在北美,由於住宅流動性有限且房屋價值高住宅,消費支出正轉向廚房、浴室和室內維修,其中維修是主要的成長動力。在美國,由於對來自印度和中國的進口商品徵收關稅,以及國內採石能力的限制,導致供應緊張,消費者越來越傾向於選擇本地採購的替代品。 Polycol斥資1,500萬美元對其北美製造地進行現代化改造,正是為了彌補這一缺口,將客製化產品的前置作業時間從12-16週縮短至4-6週。
其他好處:
- Excel格式的市場預測(ME)表
- 3個月的分析師支持
目錄
第1章:引言
- 研究假設和市場定義
- 調查範圍
第2章:調查方法
第3章執行摘要
第4章 市場狀況
- 市場概覽
- 市場促進因素
- 豪華住宅和商業設施建設增加
- 人們對兼具美觀性和耐用性的天然表面材料的需求日益成長。
- 擴大維修和整修活動
- 對維護成本較低的人造石材的需求日益成長。
- 用途不斷擴大,涵蓋外牆、地板材料和室內裝飾等領域。
- 數位化製造和精密切割技術的引入
- 市場限制因素
- 原料成本和運輸成本波動較大
- 環境和採石法規
- 陶瓷、瓷器和燒結表面的替代品
- 特定類型石材對施工和維護有很高的要求。
- 產業價值鏈分析
- 波特五力分析
- 深入了解產業最新趨勢與創新
- 近期產業趨勢分析(新產品發布、策略性舉措、投資、合作、合資、業務擴張、併購等)
第5章 市場規模與成長預測
- 按石材類型
- 大理石
- 花崗岩
- 矽質岩
- 石板
- 其他天然石材,如石灰石、砂岩等。
- 按製造類型
- Raw/Unpolished
- 拋光板
- 裁切至所需尺寸
- 透過使用
- 地板材料
- 牆或牆板
- 廚房和浴室檯面
- 其他用途:寺廟、紀念碑、家具
- 最終用戶
- 住宅
- 商業的
- 透過分銷管道
- 廠商直銷
- 零售商和加工商
- 按地區
- 北美洲
- 加拿大
- 美國
- 墨西哥
- 南美洲
- 巴西
- 秘魯
- 智利
- 阿根廷
- 其他南美國家
- 歐洲
- 英國
- 德國
- 法國
- 西班牙
- 義大利
- 比荷盧經濟聯盟(比利時、荷蘭、盧森堡)
- 北歐國家(丹麥、芬蘭、冰島、挪威、瑞典)
- 其他歐洲國家
- 亞太地區
- 印度
- 中國
- 日本
- 澳洲
- 韓國
- 東南亞
- 其他亞太國家
- 中東和非洲
- 阿拉伯聯合大公國
- 沙烏地阿拉伯
- 南非
- 奈及利亞
- 其他中東和非洲國家
- 北美洲
第6章 競爭情勢
- 市場集中度概述
- 策略趨勢
- 市佔率分析
- 公司簡介
- Levantina y Asociados de Minerales, SA
- Cosentino, SA
- Polycor Inc.
- Antolini Luigi and CSpA
- Pokarna Limited
- Aro Granite Industries Ltd
- RK Marble
- Classic Marble Company(KalingaStone)
- Stonex India Pvt Ltd
- Asian Granito India Ltd
- Marmo Granito India Limited
- MS International, Inc.
- Elliott Stone Company
- Temmer Marble
- Xiamen Wanli Stone Stock Co., Ltd.
- Kangli Stone Group
- Bain Granite
- Coldspring
- RED Graniti SpA
- Topalidis SA
第7章 市場機會與未來展望
According to Mordor Intelligence, the construction ornamental stone market size is expected to grow from USD 54.20 billion in 2025 to USD 56.60 billion in 2026 and is forecast to reach USD 70.60 billion by 2031 at 4.52% CAGR over 2026-2031.
This report is Segmented by Stone Type (Marble, Granite, Quartzite, Slate, and Others), Manufacturing Type (Raw, Polished Slabs, and Cut-To-Size), Application (Flooring, Walls, Countertops, and Others), End-User (Residential and Commercial), Distribution Channel (Direct and Dealers/Fabricators), and Geography (North America, South America, Europe, Asia-Pacific, MEA). Forecasts are in Value (USD).
Global Construction Ornamental Stone Market Trends and Insights
Rising Premium Residential And Commercial Construction
Premium residential and commercial construction remains the strongest demand base for the construction ornamental stone market because these projects use more stone per square meter than mass-market buildings. India's 8 major cities recorded 66.4 million sq ft of office absorption in 2024, and 142 stalled towers in Mumbai, Pune, and Delhi NCR restarted with large granite flooring and facade requirements in each project. In Saudi Arabia, Vision 2030 projects, including NEOM, the Red Sea Project, and Qiddiya, are creating long procurement pipelines for granite and marble across decorative and structural uses. North America and Europe are also supporting this demand through a stay-and-renovate pattern, in which homeowners direct their housing equity toward interior upgrades rather than moving. That behavior is keeping countertop and flooring demand firm, even when new residential starts are not moving at the same pace.
Growing Demand For Aesthetic And Durable Natural Surfaces
The construction ornamental stone market is also gaining support from architects and buyers who want durable materials with stronger environmental credentials. Natural stone is being specified more often in green-certified projects because it offers long service life and a clearer sourcing story when certification is available. The Natural Stone Council had certified 24 quarries and 10 fabricators or producers under the NSC 373 Sustainable Production Standard by 2024, providing procurement teams with a recognized framework aligned with LEED and BREEAM requirements. Italy's stone sector also issued its first industry-wide Environmental Product Declaration in 2025 under ISO 14025 and EN 15804, which improved its position in specification reviews against porcelain and sintered alternatives. Producers that invest early in certification and product documentation are therefore better placed in institutional and government projects where provenance is becoming a formal requirement.
Substitution From Ceramic, Porcelain, And Sintered Surfaces
Substitution remains the largest competitive restraint on the construction ornamental stone market, especially in mid-tier applications where cost and speed matter more than provenance. Sintered stone product lines are growing at 7.0% to 10.5% CAGRs through the early 2030s, which is clearly faster than the 4.5% pace expected for natural ornamental stone. Glazed porcelain tiles are also improving through inkjet decoration, low water absorption below 0.5%, and abrasion ratings above PEI IV, which helps them compete in airport lounges, hotel lobbies, and healthcare spaces. A 2025 Scientific Reports study found stronger rivalry, substitution pressure, and supply chain flexibility in ceramics than in natural stone, where extraction remains more location-bound and supplier power is higher. Natural stone still holds strong positions in luxury residential, heritage restoration, and high-end hospitality, but it is losing share in price-sensitive projects that can accept a lookalike material.
Other drivers and restraints analyzed in the detailed report include:
- Digital Fabrication And Precision Cutting Adoption
- Expansion Of Renovation And Retrofit Activity
- Environmental And Quarrying Restrictions
For complete list of drivers and restraints, kindly check the Table Of Contents.
Segment Analysis
Granite held 40% of the construction ornamental stone market in 2025, giving it the largest share in the stone type segmentation. That share came from its strong hardness-to-cost profile across public infrastructure, residential flooring, and kitchen countertops. State-backed projects in coastal China continued to specify domestic granite for railway stations and government buildings, which kept institutional demand stable. Granite is also projected to grow at a 5.0% CAGR through 2031, reflecting continued use in public projects and its cost-performance advantage across high-volume flooring programs.
Marble remained the second-largest stone category because premium hotels and resorts continue to specify it for lobbies, spas, and other statement interiors. The ornamental stone market also continues to see quartzite gain attention in premium applications, as buyers value its hardness and distinctive veining. Cosentino expanded this premium pocket in May 2025 when Sensa by Cosentino added 6 new protected quartzite offerings for the natural stone portfolio. Slate, limestone, sandstone, and other natural stones remain important in heritage restoration, landscaping, temple construction, and projects where material authenticity matters. The result is a segment led by granite in volume, while premium growth is spreading across higher-value stones with stronger design appeal. Quartzite is rising from a smaller base, but its commercial appeal is clear in bespoke countertops and accent wall designs. Buyers willing to pay for visual differentiation are helping this category win more space in luxury homes and hospitality projects. Marble continues to defend its position where prestige and visual effect matter more than maintenance intensity. The broader mix shows that volume still sits with proven mainstream stones, while premium specification is moving toward visually distinctive materials with stronger price realization.
Raw and unpolished stone accounted for 78% of revenue in 2025, which made it the largest manufacturing format in the construction ornamental stone market. This dominance reflects the market's role as an upstream raw material base for processors and fabricators that add finishing value in local or regional markets. Quarry output still moves first through basic block and slab supply because many buyers depend on downstream finishing for project-specific needs. Even with that volume lead, polished slabs are forecast to grow at a 6.0% CAGR through 2031, making them the fastest-growing manufacturing format.
The growth of polished slabs is tied to premium kitchens, bathrooms, hospitality interiors, and feature walls where full-slab presentation matters. AI-based slab layout tools are improving the economics of polished output by reducing material loss by 15% to 30% while preserving natural veining patterns. Cut-to-size formats are also gaining traction in renovation work because precise dimensions reduce installation waste and save labor at the job site. Polycor's North American upgrade added dry-lay inspection, which helps match veining and tone before shipment, lowering rejection risk on high-specification projects . These shifts show that value creation is moving toward processing and finishing, even as raw stone still accounts for most of the current volume.
Complete Report Scope:
- By Stone Type
- Marble
- Granite
- Quartzites
- Slates
- Other Natural Stones, Limestone, Sandstone, Etc.
- By Manufacturing Type
- Raw/Unpolished
- Polished Slabs
- Cut-to-Size
- By Application
- Flooring
- Walls or Wall Panels
- Countertops, Both Kitchen and Bathroom
- Other Applications, Temples, Monuments, Furniture
- By End-User
- Residential
- Commercial
- By Distribution Channel
- Directly from the Manufacturers
- Dealers and Fabricators
- By Geography
- North America
- Canada
- United States
- Mexico
- South America
- Brazil
- Peru
- Chile
- Argentina
- Rest of South America
- Europe
- United Kingdom
- Germany
- France
- Spain
- Italy
- BENELUX (Belgium, Netherlands, Luxembourg)
- NORDICS (Denmark, Finland, Iceland, Norway, Sweden)
- Rest of Europe
- Asia-Pacific
- India
- China
- Japan
- Australia
- South Korea
- South-East Asia
- Rest of Asia-Pacific
- Middle East & Africa
- United Arab Emirates
- Saudi Arabia
- South Africa
- Nigeria
- Rest of Middle East & Africa
- North America
Geography Analysis
Asia-Pacific held 48% of the construction ornamental stone market share in 2025, and it is forecast to expand at a 6.0% CAGR through 2031. This gives the region both the largest current position and the fastest growth path within the global market. China and India remain the core demand engines because they combine heavy construction activity with a large appetite for premium surfaces in both public and private projects. China's urbanization rate reached 68% in recent years, supporting continued demand for granite flooring, marble lobbies, and stone facades across residential towers, government buildings, and transit infrastructure. India adds further support through Smart Cities projects, affordable housing programs, and export diversification toward the UAE, South Korea, and Vietnam.
Japan and South Korea are contributing through commercial renovation cycles rather than broad-based new construction. Aging hospitality and retail assets in these countries are being upgraded with premium stone finishes to improve asset positioning in dense urban markets. Australia and Southeast Asia are adding steady volume through premium residential builds and resort development. This combination keeps the ornamental stone market in Asia-Pacific tied to both large-scale urban construction and higher-value, design-driven projects. The region's breadth also helps absorb slower cycles in any one country, which supports its lead over other geographies.
North America and Europe present medium-growth profiles, but the internal drivers differ by region. In North America, renovation is the main support because limited housing mobility and strong homeowner equity redirected spending toward kitchens, bathrooms, and interior upgrades. The United States also faces supply-side stress from tariff pressure on Indian and Chinese imports and constrained domestic quarrying capacity, which has increased interest in local alternatives. Polycor's USD 15 million North American manufacturing upgrade was aimed directly at that gap, reducing custom-cut lead times from 12 to 16 weeks to 4 to 6 weeks.
- Levantina y Asociados de Minerales, S.A.
- Cosentino, S.A.
- Polycor Inc.
- Antolini Luigi and C. S.p.A.
- Pokarna Limited
- Aro Granite Industries Ltd
- R K Marble
- Classic Marble Company (KalingaStone)
- Stonex India Pvt Ltd
- Asian Granito India Ltd
- Marmo Granito India Limited
- M S International, Inc.
- Elliott Stone Company
- Temmer Marble
- Xiamen Wanli Stone Stock Co., Ltd.
- Kangli Stone Group
- Bain Granite
- Coldspring
- R.E.D. Graniti S.p.A.
- Topalidis S.A.
Additional Benefits:
- The market estimate (ME) sheet in Excel format
- 3 months of analyst support
TABLE OF CONTENTS
1 INTRODUCTION
- 1.1 Study Assumptions and Market Definition
- 1.2 Scope of the Study
2 RESEARCH METHODOLOGY
3 EXECUTIVE SUMMARY
4 MARKET LANDSCAPE
- 4.1 Market Overview
- 4.2 Market Drivers
- 4.2.1 Rising Premium Residential and Commercial Construction
- 4.2.2 Growing Demand for Aesthetic and Durable Natural Surfaces
- 4.2.3 Expansion of Renovation and Retrofit Activity
- 4.2.4 Preference for Low-Maintenance Engineered Stone
- 4.2.5 Increased Use in Facades, Flooring, and Interior Applications
- 4.2.6 Digital Fabrication and Precision Cutting Adoption
- 4.3 Market Restraints
- 4.3.1 Volatile Raw Material and Transportation Costs
- 4.3.2 Environmental and Quarrying Restrictions
- 4.3.3 Substitution from Ceramic, Porcelain, and Sintered Surfaces
- 4.3.4 High Installation and Maintenance Requirements for Certain Stone Types
- 4.4 Industry Value Chain Analysis
- 4.5 Porter's Five Forces Analysis
- 4.5.1 Threat of New Entrants
- 4.5.2 Bargaining Power of Suppliers
- 4.5.3 Bargaining Power of Buyers
- 4.5.4 Threat of Substitutes
- 4.5.5 Competitive Rivalry
- 4.6 Insights into the Latest Trends and Innovations in the Industry
- 4.7 Insights into the Recent Developments (New Product Launches, Strategic Initiatives, Investments, Partnerships, JVs, Expansion, M&As, etc.) in the Industry
5 Market Size & Growth Forecasts (Value in USD Billion)
- 5.1 By Stone Type
- 5.1.1 Marble
- 5.1.2 Granite
- 5.1.3 Quartzites
- 5.1.4 Slates
- 5.1.5 Other Natural Stones, Limestone, Sandstone, Etc.
- 5.2 By Manufacturing Type
- 5.2.1 Raw/Unpolished
- 5.2.2 Polished Slabs
- 5.2.3 Cut-to-Size
- 5.3 By Application
- 5.3.1 Flooring
- 5.3.2 Walls or Wall Panels
- 5.3.3 Countertops, Both Kitchen and Bathroom
- 5.3.4 Other Applications, Temples, Monuments, Furniture
- 5.4 By End-User
- 5.4.1 Residential
- 5.4.2 Commercial
- 5.5 By Distribution Channel
- 5.5.1 Directly from the Manufacturers
- 5.5.2 Dealers and Fabricators
- 5.6 By Geography
- 5.6.1 North America
- 5.6.1.1 Canada
- 5.6.1.2 United States
- 5.6.1.3 Mexico
- 5.6.2 South America
- 5.6.2.1 Brazil
- 5.6.2.2 Peru
- 5.6.2.3 Chile
- 5.6.2.4 Argentina
- 5.6.2.5 Rest of South America
- 5.6.3 Europe
- 5.6.3.1 United Kingdom
- 5.6.3.2 Germany
- 5.6.3.3 France
- 5.6.3.4 Spain
- 5.6.3.5 Italy
- 5.6.3.6 BENELUX (Belgium, Netherlands, Luxembourg)
- 5.6.3.7 NORDICS (Denmark, Finland, Iceland, Norway, Sweden)
- 5.6.3.8 Rest of Europe
- 5.6.4 Asia-Pacific
- 5.6.4.1 India
- 5.6.4.2 China
- 5.6.4.3 Japan
- 5.6.4.4 Australia
- 5.6.4.5 South Korea
- 5.6.4.6 South-East Asia
- 5.6.4.7 Rest of Asia-Pacific
- 5.6.5 Middle East & Africa
- 5.6.5.1 United Arab Emirates
- 5.6.5.2 Saudi Arabia
- 5.6.5.3 South Africa
- 5.6.5.4 Nigeria
- 5.6.5.5 Rest of Middle East & Africa
- 5.6.1 North America
6 COMPETITIVE LANDSCAPE
- 6.1 Market Concentration Overview
- 6.2 Strategic Moves
- 6.3 Market Share Analysis
- 6.4 Company Profiles (includes Global level Overview, Market level overview, Core Segments, Financials as available, Strategic Information, Market Rank/Share for key companies, Products & Services, and Recent Developments)
- 6.4.1 Levantina y Asociados de Minerales, S.A.
- 6.4.2 Cosentino, S.A.
- 6.4.3 Polycor Inc.
- 6.4.4 Antolini Luigi and C. S.p.A.
- 6.4.5 Pokarna Limited
- 6.4.6 Aro Granite Industries Ltd
- 6.4.7 R K Marble
- 6.4.8 Classic Marble Company (KalingaStone)
- 6.4.9 Stonex India Pvt Ltd
- 6.4.10 Asian Granito India Ltd
- 6.4.11 Marmo Granito India Limited
- 6.4.12 M S International, Inc.
- 6.4.13 Elliott Stone Company
- 6.4.14 Temmer Marble
- 6.4.15 Xiamen Wanli Stone Stock Co., Ltd.
- 6.4.16 Kangli Stone Group
- 6.4.17 Bain Granite
- 6.4.18 Coldspring
- 6.4.19 R.E.D. Graniti S.p.A.
- 6.4.20 Topalidis S.A.
7 MARKET OPPORTUNITIES AND FUTURE OUTLOOK
- 7.1 Premium Commercial Fit-Out Demand
- 7.2 Sustainable and Certified Stone Solutions

 印度建築及裝飾石材:市場佔有率分析、產業趨勢與統計及成長預測(2026-2031)
 2026年全球建築石材市場報告
 建築石材市場規模、佔有率及成長分析(按類型、應用、最終用途及地區分類)-2026-2033年產業預測