


 |
市場調查報告書
商品編碼
2100756
VR/AR/MR(虛擬實境/擴增實境/混合實境):市場佔有率分析、產業趨勢和統計數據、成長預測(2026-2031)Virtual, Augmented and Mixed Reality (VR/AR) - Market Share Analysis, Industry Trends & Statistics, Growth Forecasts (2026 - 2031) |
||||||

※ 本網頁內容可能與最新版本有所差異。詳細情況請與我們聯繫。
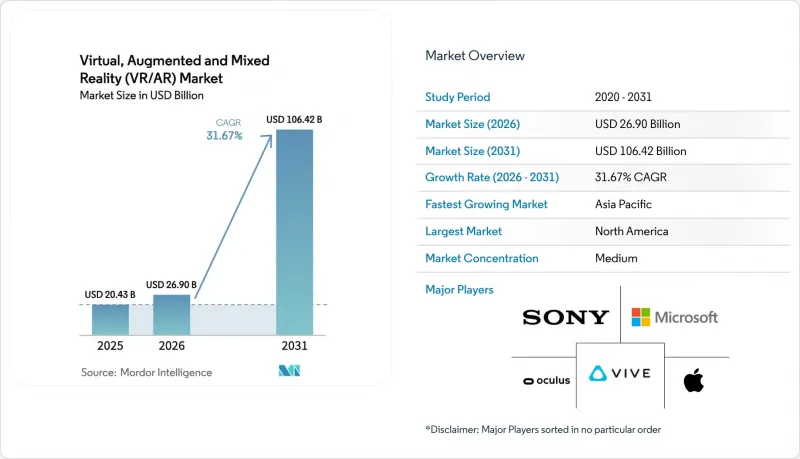
據 Mordor Intelligence 稱,2025 年 VR/AR/MR(虛擬實境、擴增實境和混合實境)市場價值為 204.3 億美元,預計到 2031 年將達到 1064.2 億美元,而 2026 年為 269 億美元,預測期(2026-2031 年)的複合年成長率為 1.67%。
本報告按現實類型(虛擬實境 (VR)、擴增實境(AR)、混合實境(MR))、組件(硬體、軟體、服務)、裝置外形規格(消費級頭戴裝置、企業/工業級頭戴裝置、其他)、最終用戶(遊戲和電競、媒體和娛樂、其他)以及地區進行細分。市場預測以價值(美元)表示。
全球虛擬實境/擴增實境/混合實境(VR/AR/MR)市場趨勢與洞察
遊戲和電子競技領域呈現爆炸性成長
儘管遊戲仍然是虛擬實境、擴增實境和混合實境市場的基石,但向電子競技和社交遊戲領域的轉變正在擴大用戶群並延長遊戲時長。 Meta 的 Quest 系列頭顯在 2024 年創下了出貨量新紀錄,凸顯了隨著內容特許經營權採用即時服務模式的擴張,中等價位的一體化設備需求旺盛。整合到 VR 遊戲中的人工智慧教練模組為職業戰隊帶來了兩位數的成績提升,凸顯了從消費娛樂轉向高性能訓練的轉變路徑。投資者興趣依然濃厚,面向北美受眾、旨在進行跨平台擴張的工作室獲得了數百萬美元的資金籌措,便是最好的證明。隨著高階賽事、遊戲內商品銷售和廣告支援的觀戰模式日趨成熟,預計這一領域將持續發展,從而提高每位用戶平均收入 (ARPU)。
企業培訓和遠距協助的實施
隨著可衡量成果日趨具體,虛擬實境(VR)、擴增實境(AR)和混合實境( MR)市場的企業正從孤立的先導計畫轉向大規模的擴展實境(XR)部署。醫療機構報告稱,在部署了Osso VR等供應商提供的模擬器後,手術訓練時間縮短了三分之二。包括西門子在內的工業領域領導企業,在將安全培訓模組轉變為身臨其境型形式後,認證考試通過率提高了13%。與此同時,化學製造商BASF正在利用數位模擬器來彌補現場技能差距。遠距監考技術的引入,使得專家導師能夠遠端指導操作流程,這也推動了XR技術的應用,降低了差旅成本,並拓展了專家的活動範圍。由於學習內容的保留期較長,例如數位孿生技術在一年後仍能達到80%的知識回憶率,XR技術正逐漸成為那些對錯誤接受度低、合規性審計嚴格的監管行業的一項寶貴資產。
健康和人體工學問題
長時間配戴頭戴式裝置會導致疲勞、視覺緊張和姿勢問題,進而影響工作環境中的長時間操作。牙科教育的學術考試已強調需要製定使用時長指南,以防止過度使用。儘管半導體製造商已獲得生物識別監測技術的專利,該技術可在出現疲勞徵兆時自動調整工作負荷,但標準化機構尚未發布統一的使用時長限制。高階設備提供卓越的光學性能,但重量可能超過 600 克,導致清晰度和舒適度之間需要權衡。出於法律責任的考慮,企業正在強制要求減少使用時間,這可能會抵消身臨其境型培訓帶來的預期生產力提升。
細分市場分析
預計到2025年,擴增實境(AR)將佔銷售額的43.18%,其在將情境資料疊加到實體工作流程中的作用將進一步加強,應用範圍涵蓋零售試穿到組裝引導等各個環節。在虛擬實境(VR)、擴增實境(AR)和混合實境(MR)市場中,由於AR在維護、導航和遠端檢查等場景中預期能帶來快速的投資回報(ROI),因此AR仍然備受青睞。已部署AR鏡子的零售商報告稱,退貨率降低,轉換率提高。同時,混合實境(MR)預計將以33.69%的複合年成長率成長,成為成長最快的技術模式。在醫院,MR手術導航正被應用於檢查中,它將觸覺視覺訊息與全像疊加層融合,從而彌合可視化與實際運動之間的差距。開發者將 MR 視為純粹 VR 的沉浸感和 AR 的便利性之間的橋樑,認為 MR 是一種可以在不做出重大硬體妥協的情況下擴大用戶群的中間地帶。
混合實境的發展勢頭得益於更輕的透視式攝影機和由人工智慧協處理器驅動的複雜空間映射演算法。預計到2030年,虛擬實境(VR)、擴增實境(AR)和混合實境(MR)的市場規模將成長四倍,為供應商提供足夠的銷售額以攤銷研發成本。雖然虛擬實境(VR)在遊戲領域擁有忠實的用戶群體,但隨著競爭設備引入混合功能,其銷售成長正在放緩。總體而言,現實類型的多樣化表明,硬體設計正從統一化轉向針對特定外形規格的客製化。
預計到2025年,硬體收入將佔總收入的56.05%,這反映了頭戴式設備、感測器和光學模組的高昂價格。儘管硬體佔據主導地位,但託管服務、雲端渲染和分析預計將以36.46%的複合年成長率成長,在所有元件中成長最高。已完成概念驗證(PoC)階段的公司正在將設備群管理、內容更新和安全修補程式外包給專業服務提供者。隨著基於結果的定價模式日益普及,預計到2028年,分配給服務合約的VR/AR/MR(虛擬實境、擴增實境和混合實境)市場規模將超過軟體授權市場規模。
軟體引擎雖然仍然至關重要,但它們正逐漸被抽象化,隱藏在無程式碼儀表板和人工智慧輔助的創作工具背後。通用晶片組和商品化光學元件的結合正在壓縮硬體利潤率,利潤來源正轉向基於訂閱的儀表板,這些儀表板用於監控使用情況和培訓效果。 ArborXR 等供應商提供的整合分析平台可在儀錶板上提供會話級 KPI,將頭戴式設備的部署與員工生產力聯繫起來,從而促使首席財務官進行更嚴格的審查,並為預算更新提供依據。
區域分析
北美在虛擬實境、擴增實境和混合實境(VR/AR/MR)市場持續保持領先地位,這得益於其蓬勃發展的創業投資資金、國防合約和軟體工作室生態系統,預計到2025年,北美將佔全球銷售額的27.45%。公開數據顯示,光是Meta一家公司每年就在XR領域投資近200億美元,不僅鞏固了其供應鏈基礎,也吸引了許多組件製造商。資料隱私和出口管制相關法規的明確化提振了企業信心,而5G中頻段在主要都市地區的覆蓋範圍擴大則為雲端渲染工作流程提供了支援。
亞太地區是成長最快的區域,預計到2031年將以年均34.57%的速度成長。政府措施正在推動國內生態系統的發展。韓國的目標是到2026年躋身元宇宙領域全球前五名,而中國已將XR列為「未來產業」之一,並透過省級津貼資助研發。位於日本和台灣的元件供應鏈正在向全球OEM廠商供應光學元件、感測器和ASIC晶片,有助於縮短前置作業時間並加速聯合開發專案。隨著主要電信公司部署獨立組網的5G核心網,新加坡、印度和澳洲持續吸引VR/AR/MR(虛擬實境、擴增實境和混合實境)市場的新投資。
其他福利
- Excel格式的市場預測(ME)表
- 3個月的分析師支持
目錄
第1章:引言
- 研究假設和市場定義
- 調查範圍
第2章:調查方法
第3章執行摘要
第4章 市場狀況
- 市場概覽
- 市場促進因素
- 遊戲和電子競技的爆炸性成長
- 企業培訓與遠距協助實施
- 5G/邊緣網路支援低延遲XR串流媒體播放
- 開放原始碼XR 開發工具包可縮短 MVP 的開發時間。
- 利用工業數位孿生的維護工作流程
- 政府對元宇宙研究與發展(R&D)的支持措施(韓國、中國)
- 市場限制因素
- 健康和人體工學問題
- 這些設備的價格和性能之間存在很大差距。
- 與網路安全和資料隱私相關的風險
- 關鍵材料(稀土元素)供應鏈風險
- 供應鏈分析
- 監理情勢
- 技術展望
- 波特五力模型
- 對影響市場的宏觀經濟因素進行評估
第5章 市場規模與成長預測
- 現實類型
- 虛擬實境(VR)
- 擴增實境(AR)
- 混合實境(MR)
- 按組件
- 硬體
- 軟體
- 服務
- 按設備外形規格
- 消費級耳機
- 企業/工業耳機
- 智慧眼鏡
- 其他
- 最終用戶
- 遊戲與電子競技
- 媒體與娛樂
- 醫療保健和生命科學
- 零售與電子商務
- 製造業和工業
- 其他
- 按地區
- 北美洲
- 美國
- 加拿大
- 墨西哥
- 南美洲
- 巴西
- 阿根廷
- 其他南美國家
- 歐洲
- 德國
- 英國
- 法國
- 義大利
- 西班牙
- 其他歐洲國家
- 亞太地區
- 中國
- 印度
- 日本
- 韓國
- 澳洲和紐西蘭
- 其他亞太國家
- 中東和非洲
- 中東
- 沙烏地阿拉伯
- 阿拉伯聯合大公國
- 土耳其
- 其他中東國家
- 非洲
- 南非
- 埃及
- 其他非洲地區
- 中東
- 北美洲
第6章 競爭情勢
- 市場集中度
- 策略趨勢
- 市佔率分析
- 公司簡介
- Meta Platforms Inc.(Oculus)
- Sony Group Corp.
- HTC Corp.(Vive)
- Microsoft Corp.
- Apple Inc.
- Samsung Electronics Co. Ltd
- Lenovo Group Ltd
- Pico Interactive Inc.
- Qualcomm Technologies Inc.
- Magic Leap Inc.
- Vuzix Corp.
- RealWear Inc.
- DPVR(Lexiang Tech)
- Valve Corp.
- Unity Technologies Inc.
- Epic Games Inc.(Unreal Engine)
- Autodesk Inc.
- Dassault Systemes SE
- Ultraleap Ltd
- Niantic Inc.
第7章 市場機會與未來展望
According to Mordor Intelligence, the virtual augmented and mixed reality market size was valued at USD 20.43 billion in 2025 and estimated to grow from USD 26.9 billion in 2026 to reach USD 106.42 billion by 2031, at a CAGR of 31.67% during the forecast period (2026-2031).
This report is Segmented by Reality Type (Virtual Reality (VR), Augmented Reality (AR), Mixed Reality (MR)), Component (Hardware, Software, Services), Device Form Factor (Consumer Headsets, Enterprise/Industrial Headsets, and More), End User (Gaming and E-Sports, Media and Entertainment, and More), and by Geography. The Market Forecasts are Provided in Terms of Value (USD).
Global Virtual, Augmented and Mixed Reality (VR/AR) Market Trends and Insights
Explosive Gaming and E-Sports Adoption
Gaming remains the anchor of the Virtual, Augmented and Mixed Reality market, yet the pivot toward e-sports and socially networked game worlds is broadening user bases and session lengths. Meta shipped record volumes of Quest-series headsets in 2024, validating demand for mid-priced all-in-one devices as content franchises scale on live-service models. AI-enabled coaching modules integrated into VR titles are delivering double-digit performance gains for professional teams, underlining a pathway from consumer leisure to high-performance training. Investor appetite is sustained, illustrated by multimillion-dollar studio financings aimed at cross-platform launches targeting North American audiences. The segment's evolution is expected to lift average revenue per user as premium tournaments, in-game merchandising and ad-supported spectator modes mature.
Enterprise Training and Remote-Assist Roll-outs
Corporations in the Virtual Augmented And Mixed Reality (VR/AR) Market migrating from isolated pilots to fleet-scale XR deployments as measurable returns crystallize. Medical institutions report a two-thirds reduction in surgical training time after adopting simulators from vendors such as Osso VR . Industrial leaders including Siemens have recorded 13% higher certification pass rates after converting safety modules to immersive formats, while chemical producer BASF leverages digital simulators to address skills gaps on shop floors. Adoption is reinforced by tele-proctoring, allowing expert mentors to guide remote procedures, cutting travel overheads and extending specialist reach. Longer session retention-documented at 80% one-year knowledge recall when digital twins are deployed-positions XR as an asset for regulated industries where error tolerance is low and compliance auditing is strict.
Health and Ergonomic Concerns
Extended headset wear still raises fatigue, vision strain and posture issues that discourage long sessions in professional settings. Academic trials in dental education underscore the need for session-length guidelines to guard against overexertion. Chip makers are patenting biometric monitoring to auto-throttle workloads when fatigue indicators arise, yet standard-setting bodies have not issued unified exposure limits. Premium devices offer superior optics but may weigh more than 600 grams, creating trade-offs between clarity and comfort. Liability considerations push enterprises to mandate shorter rotations, sometimes offsetting productivity gains promised by immersive training.
Other drivers and restraints analyzed in the detailed report include:
- 5G / Edge Networks Enabling Low-Latency XR Streaming
- Open-Source XR Dev-Kits Cutting Time-to-MVP
- High Device Price-Performance Gap
For complete list of drivers and restraints, kindly check the Table Of Contents.
Segment Analysis
Augmented Reality commanded 43.18% of 2025 revenue, reinforcing its role in overlaying contextual data onto physical workflows, from retail try-ons to assembly line guidance. The Virtual, Augmented and Mixed Reality market continues to favor AR for quick ROI in maintenance, navigation and remote inspection scenarios. Retailers deploying AR mirrors report reduced return rates and higher conversion. In parallel, Mixed Reality is forecast to expand at a 33.69% CAGR, qualifying as the fastest-growing modality. Hospitals are piloting MR surgical guidance that blends tactile view with holographic overlays, narrowing the gap between visualization and action. Developers see MR as bridging pure VR immersion and AR convenience, a middle path that broadens audience reach without deep hardware trade-offs.
Mixed Reality's momentum rests on lighter pass-through cameras and spatial-mapping algorithms refined by AI co-processors. The Virtual, Augmented and Mixed Reality market size for MR applications is projected to quadruple by 2030, providing vendors with volume to amortize R&D spending. Virtual Reality maintains a loyal gaming base but faces slower unit growth as competitive devices promote hybrid features. Overall, reality-type diversification signals a shift from one-size-fits-all hardware toward situational form factors
Hardware captured 56.05% of 2025 revenue, reflecting high ticket prices for headsets, sensors and optical modules. Despite this dominance, managed services, cloud rendering and analytics are predicted to rise at a 36.46% CAGR, the highest among components. Enterprises moving beyond proof-of-concepts are outsourcing device fleets, content updates and security patches to specialist providers. The Virtual, Augmented and Mixed Reality market size allocated to service contracts is set to overtake software licensing by 2028 as outcome-based pricing gains traction.
Software engines remain critical but are gradually abstracted behind no-code dashboards and AI-assisted creator tools. Hardware margins compress when generic chipsets meet commoditized optics, shifting profit pools to subscription dashboards that monitor utilization and training efficacy. Analytics platforms integrated by vendors such as ArborXR feed dashboards with session-level KPIs that link headset deployment to workforce productivity, sharpening CFO scrutiny and underpinning budget renewals.
Complete Report Scope:
- By Reality Type
- Virtual Reality (VR)
- Augmented Reality (AR)
- Mixed Reality (MR)
- By Component
- Hardware
- Software
- Services
- By Device Form Factor
- Consumer Headsets
- Enterprise/Industrial Headsets
- Smart Glasses
- Others
- By End-Use Industry
- Gaming and E-Sports
- Media and Entertainment
- Healthcare and Life-Sciences
- Retail and E-Commerce
- Manufacturing and Industrial
- Others
- By Geography
- North America
- United States
- Canada
- Mexico
- South America
- Brazil
- Argentina
- Rest of South America
- Europe
- Germany
- United Kingdom
- France
- Italy
- Spain
- Rest of Europe
- Asia-Pacific
- China
- India
- Japan
- South Korea
- Australia and New Zealand
- Rest of Asia-Pacific
- Middle East and Africa
- Middle East
- Saudi Arabia
- United Arab Emirates
- Turkey
- Rest of Middle East
- Africa
- South Africa
- Egypt
- Rest of Africa
- Middle East
- North America
Geography Analysis
North America continues to lead the Virtual Augmented And Mixed Reality Market, capturing 27.45% of global revenue in 2025, supported by venture financing, defense contracts and a dense ecosystem of software studios. Public filings reveal that Meta alone invests close to USD 20 billion annually in XR, anchoring supply chains and attracting component makers. Regulatory clarity on data privacy and export controls bolsters enterprise confidence, while 5G mid-band coverage in major metros underpins cloud-rendered workflows.
Asia-Pacific is the fastest-growing region, projected to compound at 34.57% through 2031. Government initiatives drive domestic ecosystem build-outs: South Korea targets a top-five global metaverse ranking by 2026, while China designates XR among "future industries" and funds R&D through provincial grants. Component supply chains headquartered in Japan and Taiwan deliver optics, sensors and ASICs to global OEMs, reducing lead times and fostering co-development programs. The Virtual, Augmented and Mixed Reality market continues to attract greenfield investment in Singapore, India and Australia as telecom incumbents deploy standalone 5G cores.
- Meta Platforms Inc. (Oculus)
- Sony Group Corp.
- HTC Corp. (Vive)
- Microsoft Corp.
- Apple Inc.
- Samsung Electronics Co. Ltd
- Lenovo Group Ltd
- Pico Interactive Inc.
- Qualcomm Technologies Inc.
- Magic Leap Inc.
- Vuzix Corp.
- RealWear Inc.
- DPVR (Lexiang Tech)
- Valve Corp.
- Unity Technologies Inc.
- Epic Games Inc. (Unreal Engine)
- Autodesk Inc.
- Dassault Systemes SE
- Ultraleap Ltd
- Niantic Inc.
Additional Benefits:
- The market estimate (ME) sheet in Excel format
- 3 months of analyst support
TABLE OF CONTENTS
1 INTRODUCTION
- 1.1 Study Assumptions and Market Definition
- 1.2 Scope of the Study
2 RESEARCH METHODOLOGY
3 EXECUTIVE SUMMARY
4 MARKET LANDSCAPE
- 4.1 Market Overview
- 4.2 Market Drivers
- 4.2.1 Explosive gaming and e-sports adoption
- 4.2.2 Enterprise training and remote-assist roll-outs
- 4.2.3 5G/edge networks enabling low-latency XR streaming
- 4.2.4 Open-source XR dev-kits cutting time-to-MVP
- 4.2.5 Industrial digital-twin maintenance workflows
- 4.2.6 Government metaverse RandD incentives (KR, CN)
- 4.3 Market Restraints
- 4.3.1 Health and ergonomic concerns
- 4.3.2 High device price-performance gap
- 4.3.3 Cyber-security and data-privacy exposure
- 4.3.4 Critical-material (rare-earth) supply-chain risk
- 4.4 Supply-Chain Analysis
- 4.5 Regulatory Landscape
- 4.6 Technological Outlook
- 4.7 Porter's Five Forces
- 4.7.1 Bargaining Power of Suppliers
- 4.7.2 Bargaining Power of Buyers
- 4.7.3 Threat of New Entrants
- 4.7.4 Threat of Substitutes
- 4.7.5 Competitive Rivalry
- 4.8 Assesment of Macroeconomic Factors on the market
5 MARKET SIZE AND GROWTH FORECASTS (VALUE)
- 5.1 By Reality Type
- 5.1.1 Virtual Reality (VR)
- 5.1.2 Augmented Reality (AR)
- 5.1.3 Mixed Reality (MR)
- 5.2 By Component
- 5.2.1 Hardware
- 5.2.2 Software
- 5.2.3 Services
- 5.3 By Device Form Factor
- 5.3.1 Consumer Headsets
- 5.3.2 Enterprise/Industrial Headsets
- 5.3.3 Smart Glasses
- 5.3.4 Others
- 5.4 By End-Use Industry
- 5.4.1 Gaming and E-Sports
- 5.4.2 Media and Entertainment
- 5.4.3 Healthcare and Life-Sciences
- 5.4.4 Retail and E-Commerce
- 5.4.5 Manufacturing and Industrial
- 5.4.6 Others
- 5.5 By Geography
- 5.5.1 North America
- 5.5.1.1 United States
- 5.5.1.2 Canada
- 5.5.1.3 Mexico
- 5.5.2 South America
- 5.5.2.1 Brazil
- 5.5.2.2 Argentina
- 5.5.2.3 Rest of South America
- 5.5.3 Europe
- 5.5.3.1 Germany
- 5.5.3.2 United Kingdom
- 5.5.3.3 France
- 5.5.3.4 Italy
- 5.5.3.5 Spain
- 5.5.3.6 Rest of Europe
- 5.5.4 Asia-Pacific
- 5.5.4.1 China
- 5.5.4.2 India
- 5.5.4.3 Japan
- 5.5.4.4 South Korea
- 5.5.4.5 Australia and New Zealand
- 5.5.4.6 Rest of Asia-Pacific
- 5.5.5 Middle East and Africa
- 5.5.5.1 Middle East
- 5.5.5.1.1 Saudi Arabia
- 5.5.5.1.2 United Arab Emirates
- 5.5.5.1.3 Turkey
- 5.5.5.1.4 Rest of Middle East
- 5.5.5.2 Africa
- 5.5.5.2.1 South Africa
- 5.5.5.2.2 Egypt
- 5.5.5.2.3 Rest of Africa
- 5.5.5.1 Middle East
- 5.5.1 North America
6 COMPETITIVE LANDSCAPE
- 6.1 Market Concentration
- 6.2 Strategic Moves
- 6.3 Market Share Analysis
- 6.4 Company Profiles (includes Global level Overview, Market level overview, Core Segments, Financials as available, Strategic Information, Market Rank/Share for key companies, Products and Services, and Recent Developments)
- 6.4.1 Meta Platforms Inc. (Oculus)
- 6.4.2 Sony Group Corp.
- 6.4.3 HTC Corp. (Vive)
- 6.4.4 Microsoft Corp.
- 6.4.5 Apple Inc.
- 6.4.6 Samsung Electronics Co. Ltd
- 6.4.7 Lenovo Group Ltd
- 6.4.8 Pico Interactive Inc.
- 6.4.9 Qualcomm Technologies Inc.
- 6.4.10 Magic Leap Inc.
- 6.4.11 Vuzix Corp.
- 6.4.12 RealWear Inc.
- 6.4.13 DPVR (Lexiang Tech)
- 6.4.14 Valve Corp.
- 6.4.15 Unity Technologies Inc.
- 6.4.16 Epic Games Inc. (Unreal Engine)
- 6.4.17 Autodesk Inc.
- 6.4.18 Dassault Systemes SE
- 6.4.19 Ultraleap Ltd
- 6.4.20 Niantic Inc.
7 MARKET OPPORTUNITIES AND FUTURE OUTLOOK
- 7.1 White-space and Unmet-need Assessment

 自動駕駛汽車遠端援助市場預測至2034年-按服務類型、技術、應用、車輛類型、最終用戶和地區分類的全球分析
 虛擬實境(VR)手套市場規模、佔有率和趨勢分析報告:按產品、技術、應用、地區和細分市場分類(2026-2033 年)
 全景VR解決方案市場規模、佔有率和成長分析:按組件、部署模式、應用、最終用戶和地區分類-2026-2033年產業預測
 教育領域的虛擬實境:市場佔有率分析、產業趨勢與統計及成長預測(2026-2031)
 虛擬實境(VR)全球市場規模、佔有率、趨勢和成長分析報告(2026-2034)
 基於太空的虛擬實境(VR)市場規模、佔有率和成長分析:按產品、應用、最終用戶和地區分類-2026-2033年產業預測製造業中的虛擬實境(VR)市場規模、佔有率、成長、全球產業分析、區域趨勢以及2026-2034年預測。虛擬實境(VR):市場佔有率分析、產業趨勢與統計數據、成長預測(2026-2031)
 觸覺虛擬實境市場-2026-2032年全球市場預測虛擬實境市場:依技術、組件、設備和最終用戶分類-2026-2032年全球市場預測