

 |
市場調查報告書
商品編碼
2100660
自動駕駛汽車感測器融合:市場佔有率分析、產業趨勢與統計及成長預測(2026-2031)Sensor Fusion in Autonomous Vehicles - Market Share Analysis, Industry Trends & Statistics, Growth Forecasts (2026 - 2031) |
||||||

※ 本網頁內容可能與最新版本有所差異。詳細情況請與我們聯繫。
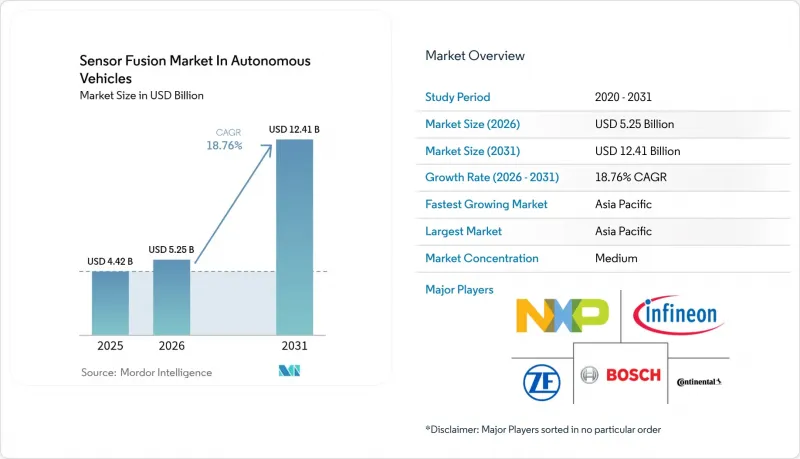
根據 Mordor Intelligence 預測,自動駕駛汽車感測器融合的市場規模預計將從 2025 年的 44.2 億美元成長到 2026 年的 52.5 億美元,並將從 2026 年到 2031 年以 18.76% 的複合年成長率成長,到 2031 億美元達到 124.1 億美元。
本報告按感測器類型(例如雷射雷達)、組件(例如硬體)、技術(MEMS感測器和非MEMS感測器)、自動化等級(例如L1級)、推進系統(例如內燃機車輛)、車輛類型(例如乘用車、輕型商用車)和地區進行細分。市場預測以美元計價。
自動駕駛汽車感測器融合市場洞察與趨勢
ADAS的普及正在加速多感測器技術的應用。
歐洲新車安全評鑑協會 (Euro NCAP) 2025 年的法規要求車輛必須具備前向碰撞緩解和車道維持功能才能獲得五星評級,這迫使歐洲主要汽車製造商採用多感測器堆疊。美國聯邦機動車輛安全標準 (FMVSS) 127 最終法規要求在 2029 年引入行人自動緊急煞車功能,並要求結合攝影機分類和雷達距離變化率來減少都市區的誤報。隨著中國新車安全評鑑協會 (C-NCAP) 2024 年評估標準修訂,將夜間行人偵測納入考量,比亞迪和吉利正在將 905 奈米雷射雷達與毫米波雷達整合。隨著時間安排日益緊湊,檢驗週期也在縮短,這使得能夠提供模擬庫和註釋的極端情況資料的供應商更具優勢。隨著法規的統一,自動駕駛汽車感測器融合市場正在形成良性循環,各大品牌之間的需求相互促進。
固態雷射雷達的單價正在跌破 400 美元。
Hesai 的 2024 年藍圖旨在透過 ASIC 整合和自動光學調節,到 2026 年將物料清單 (BOM) 成本降低到 200 美元以下。 Innoviz 已與一家歐洲高階 OEM 製造商簽訂了一份價值 350 美元的 50 萬件產品供應契約,這表明LiDAR的價格正迅速接近雷達。取消機械反射鏡可降低故障率,並符合 AEC-Q100 2 級熱循環標準,使其能夠應用於需要更高偵測閾值的L2+ 級車輛。隨著成本曲線的下降,自動駕駛汽車的感測器融合市場正從以雷達和攝影機為中心的配置轉向整合LiDAR的感知系統。這一趨勢在高階轎車和跨界車領域尤其明顯,因為消費者願意為安全性支付更高的價格。
OEM廠商之間缺乏全球統一的感測器資料標準
ISO 23150 仍處於草案階段,迫使供應商為每個客戶開發單獨的雷達、LiDAR和攝影機中間件。 SAE J2735 缺乏融合方案,而 AUTOSAR Adaptive 24-11 缺乏感測器間時間戳記的統一規範。因此,一級供應商被迫維護並行程式碼分支,導致工程成本增加 20-30%,並延遲產品發布。中小企業難以回收檢驗成本,自動駕駛汽車感測器融合市場的競爭也日漸式微。只有監管機構制定標準介面,才有可能取得突破,但美國、歐盟和中國之間達成協議可能還需要兩個車型週期的時間。
細分市場分析
由於成本低廉且全天候可靠性高,雷達在2025年仍將佔據自動駕駛汽車感測器融合市場35.72%的佔有率。同時,預計到2031年,LiDAR(LiDAR)感測器融合市場將以21.63%的複合年成長率成長。這是因為符合歐洲新車安全評估協會(Euro NCAP)標準的L3級自動駕駛系統,例如梅賽德斯-奔馳的「Drive Pilot」系統,依賴厘米級深度測量。即使在惡劣條件下,LiDAR也能保持較高的物體分類精度,因此對於高階汽車製造商而言,它是一項降低風險的投資。相機感應器雖然色彩豐富、像素密度高,但在漫射眩光下性能會下降。因此,汽車製造商正在將攝影機感測器與雷達多普勒測量數據融合,以穩定行人軌跡。超音波感測器和慣性測量單元(IMU)佔據了特定的細分市場,但由於其檢測範圍有限,它們只能作為核心感知功能的補充,而不能取代核心感知功能。
LiDAR的需求仍然主要集中在高階跨界車和無人駕駛計程車領域,因為這些領域的消費者往往願意為自動駕駛功能支付更高的成本。雷達成本的逐代下降正在鞏固其在大眾市場高級駕駛輔助系統(ADAS)領域的主導地位。然而,隨著固態雷射雷達單元的價格接近300美元,中端電動車計畫在2027年的車型改款中採用這項技術。供應商們正在角解析度和人眼安全波長方面展開競爭,而關於1550奈米雷射的相關規定可能會拓寬設計的可能性。因此,LiDAR的銷售成長速度超過了普通雷達,正在重塑自動駕駛汽車感測器融合市場的供應商格局。
預計到2025年,硬體(包括收發器、光學元件和微控制器)將佔銷售額的60.12%。然而,隨著汽車製造商轉向需要在車輛集群規模上持續進行重新訓練的神經網路融合技術,軟體的複合年成長率預計將達到21.34%,超過硬體。自動駕駛汽車感測器融合市場中涵蓋校準、地圖繪製和網路安全更新等服務的軟體服務規模龐大,正在形成持續的收入來源。大陸集團的先進雷達感測器540透過壓縮原始數據,將乙太網路流量減少了70%,體現了邊緣預處理和雲端推理之間工作負載共享的協同設計概念。
Mobileye 的「道路體驗管理」等服務可以將匿名化的駕駛資料轉化為高解析度地圖,從而在初始設備銷售之外創造價值。空中下載 (OTA) 管理平台的普及率正在不斷提高,尤其是在以訂閱模式為主的電動車品牌中。儘管價格壓力正在擠壓硬體利潤率,但經過認證的中間件卻能賣出高價。這種轉變正在改變供應商的議價能力,提供全端解決方案的供應商在自動駕駛汽車利潤池中的感測器融合市場佔有率,比單純的零件供應商更大。
區域分析
亞太地區佔41.88%的市場佔有率,預計將維持21.57%的複合年成長率,主要得益於中國將於2025年強制實施L2級自動駕駛技術,以及日本6.7億美元的「社會5.0」車聯網(V2X)預算。該地區的製造群正在縮短感測器製造廠與汽車組裝之間的迭代周期。
北美繼續作為這項技術的試驗場,美國聯邦通訊委員會(FCC)分配了30MHz的C-V2X頻段,加州也批准了洛杉磯和舊金山的自動駕駛計程車營運。在歐洲,儘管銷售成長放緩,但高階汽車製造商(OEM)的投資仍在持續,這主要得益於聯合國歐洲經濟委員會(UNECE)相關法規的實施以及旨在實現「零死亡」目標的經濟獎勵策略。
儘管南美、中東和非洲發展落後,但在巴西聖保羅和阿拉伯聯合大公國杜拜等物流走廊,一些開創性的試點計畫正在進行。由於外匯波動和基礎設施差異,大規模部署有所延遲,但雷射雷達成本的下降預計將在2028年前推動價格敏感型應用領域的擴張。總體而言,地域多元化正在緩解經濟波動的影響,並穩定自動駕駛汽車感測器融合市場的收入前景。
其他好處:
- Excel格式的市場預測(ME)表
- 3個月的分析師支持
目錄
第1章:引言
- 研究假設和市場定義
- 調查範圍
第2章:調查方法
第3章執行摘要
第4章 市場狀況
- 市場概覽
- 市場促進因素
- ADAS(先進駕駛輔助系統)的廣泛應用正在加速多感測器技術的應用。
- 固態LiDAR的單價已降至 400 美元以下。
- 汽車邊緣AI晶片組可實現小於10毫秒的融合延遲
- 無線通訊法規要求不斷更新情境察覺。
- 智慧城市車聯網示範實驗需要高度精確的環境模式。
- 保險公司為整合安全評分API提供遠端資訊處理獎勵
- 市場限制因素
- 目前各原始設備製造商之間沒有統一的全球感測器數據標準。
- 預計到 2025 年,LiDAR和慣性測量單元的進口將徵收兩位數的關稅。
- 即時網路安全認證的瓶頸
- 純電動車處理器的功耗限制低於 20 瓦。
- 產業價值鏈分析
- 監理情勢
- 技術展望
- 宏觀經濟因素的影響
- 波特五力分析
- 主要專利和研究活動
- 主要和新興應用
- 主動式車距維持定速系統(ACC)
- 自動緊急煞車(AEB)
- 電子控制牽引力控制(ESC)
- 前向碰撞預警(FCW)
- 其他用途
第5章 市場規模與成長預測
- 依感測器類型
- LiDAR
- 雷達
- 相機
- 超音波
- 慣性測量單元(IMU)
- 按組件
- 硬體
- 軟體
- 服務
- 透過技術
- MEMS感測器
- 非MEMS感測器
- 按自動化級別
- 一級
- 二級
- 3級
- 4級
- 5級
- 依推進類型
- 內燃機車
- 電池式電動車
- 油電混合車
- 燃料電池電動車
- 車輛類型
- 搭乘用車
- 輕型商用車
- 大型商用車輛
- 其他自動駕駛汽車
- 按地區
- 北美洲
- 美國
- 加拿大
- 墨西哥
- 南美洲
- 巴西
- 阿根廷
- 其他南美國家
- 歐洲
- 德國
- 英國
- 法國
- 義大利
- 西班牙
- 其他歐洲國家
- 亞太地區
- 中國
- 日本
- 印度
- 韓國
- 澳洲
- 其他亞太國家
- 中東和非洲
- 中東
- 沙烏地阿拉伯
- 阿拉伯聯合大公國
- 土耳其
- 其他中東國家
- 非洲
- 南非
- 奈及利亞
- 埃及
- 其他非洲國家
- 中東
- 北美洲
第6章 競爭情勢
- 市場集中度
- 策略趨勢
- 市佔率分析
- 公司簡介
- Robert Bosch GmbH
- Continental AG
- ZF Friedrichshafen AG
- NXP Semiconductors NV
- Infineon Technologies AG
- STMicroelectronics NV
- Denso Corporation
- Aptiv PLC
- Texas Instruments Incorporated
- Analog Devices, Inc.
- NVIDIA Corporation
- Mobileye Global Inc.
- Valeo SA
- Renesas Electronics Corporation
- ON Semiconductor Corporation
- TDK Corporation
- TE Connectivity Ltd.
- Elmos Semiconductor SE
- LeddarTech Inc.
- BASELABS GmbH
- Kionix, Inc.(Rohm Co., Ltd.)
- CEVA, Inc.
- Memsic, Inc.
- Sensata Technologies, Inc.
- Velodyne Lidar, Inc.
- Innoviz Technologies Ltd.
- Ouster, Inc.
- Quanergy Systems, Inc.
- PlusAI Inc.
第7章 市場機會與未來展望
According to Mordor Intelligence, the sensor fusion market size in autonomous vehicles is expected to grow from USD 4.42 billion in 2025 to USD 5.25 billion in 2026 and is forecast to reach USD 12.41 billion by 2031 at 18.76% CAGR over 2026-2031.
This report is Segmented by Sensor Type (LiDAR, and More), Component (Hardware, and More), Technology (MEMS Sensors and Non-MEMS Sensors), Level of Automation (Level 1, and More), Propulsion Type (Internal Combustion Engine Vehicles, and More), Vehicle Type (Passenger Cars, Light Commercial Vehicles, and More), and Geography. The Market Forecasts are Provided in Terms of Value (USD).
Insights and Trends of Sensor Fusion Market in Autonomous Vehicles
Mainstream ADAS Mandates Accelerating Multi-Sensor Adoption
Euro NCAP's 2025 rules make forward-collision mitigation and lane-keeping mandatory for a five-star rating, pushing every major automaker in Europe to adopt multi-sensor stacks. The U.S. FMVSS 127 final rule requires the implementation of pedestrian automatic emergency braking by 2029, combining camera classification with radar range-rate to reduce urban false positives. China's C-NCAP 2024 scoring upgrade rewards nighttime pedestrian detection, prompting BYD and Geely to integrate 905-nanometer LiDAR with millimeter-wave radar. Tighter timelines compress validation cycles, favoring suppliers that provide simulation libraries and annotated edge-case data. As mandates converge, the sensor fusion market in autonomous vehicles gains a self-reinforcing demand loop among mainstream brands.
Declining Solid-State LiDAR Costs Below USD 400 per Unit
Hesai's 2024 roadmap aims to achieve a sub-USD 200 bill-of-material cost by 2026 through ASIC integration and automated optical alignment. Innoviz secured a USD 350 supply deal for 500,000 units with a European premium OEM, signaling that LiDAR is fast approaching radar price parity. Removing mechanical mirrors reduces failure rates and meets AEC-Q100 Grade 2 thermal cycles, enabling deployment in Level 2+ cars that require improved cut-in detection. As cost curves bend, the sensor fusion market in autonomous vehicles shifts from radar-camera dominance toward LiDAR-inclusive perception, especially in premium sedans and crossovers where consumers pay a safety premium.
Absence of Global Sensor-Data Standards Across OEMs
ISO 23150 remains in draft, leaving vendors to custom-code radar, LiDAR, and camera middleware per customer. SAE J2735 omits fusion schemas, and AUTOSAR Adaptive 24-11 lacks binding cross-sensor timestamp specs. Tier-1 suppliers, therefore, maintain parallel code branches, which inflates engineering spend by 20-30% and delays launches. Smaller firms struggle to recoup validation costs, thinning competition in the sensor fusion market for autonomous vehicles. A breakthrough may arrive only when regulators codify a canonical interface, but consensus across the U.S., EU, and China looks two model cycles away.
Other drivers and restraints analyzed in the detailed report include:
- In-Vehicle Edge-AI Chipsets Enabling less than and equal to 10 ms Fusion Latency
- Over-the-Air Regulation Requiring Continuous Perception Updates
- Double-Digit Tariffs on LiDAR and IMU Imports in 2025
For complete list of drivers and restraints, kindly check the Table Of Contents.
Segment Analysis
Radar retained 35.72% of the sensor fusion market share in autonomous vehicles in 2025, thanks to its low cost and all-weather reliability. The sensor fusion market size in autonomous vehicles for LiDAR, however, is projected to rise at a 21.63% CAGR through 2031, as Euro-NCAP-compliant Level 3 offerings, such as Mercedes-Benz Drive Pilot, rely on centimeter-level depth. Greater object-classification confidence in adverse light conditions makes LiDAR a de-risking investment for premium OEMs. Camera sensors deliver rich color and pixel density, but they falter in diffuse glare. Therefore, automakers fuse them with radar Doppler to stabilize pedestrian trajectories. Ultrasonic and IMU units fill specific niches, yet their limited range means they augment, not replace, core perception.
Demand for LiDAR remains skewed toward upper-trim crossovers and robotaxis, where customers are willing to tolerate higher costs for hands-free operation. Radar's incremental generational cost drops cement its dominance in mass-market ADAS. Still, as solid-state LiDAR units approach USD 300, mid-segment EVs plan to adopt them in the 2027 refresh. Suppliers compete on angular resolution and eye-safe wavelengths, while regulatory clarity on 1,550-nanometer lasers could broaden design windows. Consequently, LiDAR's dollar growth outstrips that of radar, reshaping supplier shares within the sensor fusion market in autonomous vehicles.
Hardware accounted for 60.12% of revenue in 2025, encompassing transceivers, optics, and microcontrollers. Yet, the software CAGR of 21.34% outpaces hardware as automakers pivot to neural-network fusion that requires constant fleet-scale retraining. The sensor fusion market size in autonomous vehicles for software services covers calibration, mapping, and cybersecurity updates, forming recurring revenue streams. Continental's Advanced Radar Sensor 540 compresses raw data to reduce Ethernet traffic by 70%, demonstrating a co-design ethos where edge preprocessing and cloud inference split workloads.
Services such as Mobileye's Road Experience Management turn anonymized drive data into high-definition maps, monetizing usage beyond initial equipment sales. Over-the-air management platforms expand attach rates, especially in subscription-oriented EV brands. Hardware margins compress under price pressure, while certified middleware commands a premium. The shift alters bargaining power: suppliers offering full-stack solutions capture a bigger share of the sensor fusion market in the autonomous vehicle profit pool than pure-play component vendors.
Complete Report Scope:
- By Sensor Type
- LiDAR
- Radar
- Camera
- Ultrasonic
- Inertial Measurement Units (IMU)
- By Component
- Hardware
- Software
- Services
- By Technology
- MEMS Sensors
- Non-MEMS Sensors
- By Level of Automation
- Level 1
- Level 2
- Level 3
- Level 4
- Level 5
- By Propulsion Type
- Internal Combustion Engine Vehicles
- Battery Electric Vehicles
- Hybrid Electric Vehicles
- Fuel Cell Electric Vehicles
- By Vehicle Type
- Passenger Cars
- Light Commercial Vehicles
- Heavy Commercial Vehicles
- Other Autonomous Vehicles
- By Geography
- North America
- United States
- Canada
- Mexico
- South America
- Brazil
- Argentina
- Rest of South America
- Europe
- Germany
- United Kingdom
- France
- Italy
- Spain
- Rest of Europe
- Asia-Pacific
- China
- Japan
- India
- South Korea
- Australia
- Rest of Asia-Pacific
- Middle East and Africa
- Middle East
- Saudi Arabia
- United Arab Emirates
- Turkey
- Rest of Middle East
- Africa
- South Africa
- Nigeria
- Egypt
- Rest of Africa
- Middle East
- North America
Geography Analysis
Asia Pacific captured 41.88% share and will hold a 21.57% CAGR, buoyed by China's Level 2 mandate in 2025 and Japan's USD 670 million Society 5.0 V2X budget. The region's manufacturing clusters compress iteration loops between sensor fabs and vehicle assembly lines.
North America remains a technology testbed, with the FCC allocating 30 MHz C-V2X spectrum and California green-lighting driverless robotaxis in Los Angeles and San Francisco. Europe enforces UNECE regulations and stimulus for zero-fatality targets, sustaining premium OEM spending despite softer unit demand.
South America, the Middle East, and Africa lag, but they operate lighthouse pilots in Brazil's Sao Paulo and the UAE's Dubai logistics corridors. Currency volatility and infrastructure gaps defer mass rollouts, but falling LiDAR costs could unlock price-sensitive applications by 2028. Overall, geographic diversification cushions cyclical shocks, stabilizing revenue visibility for the sensor fusion market in autonomous vehicles.
- Robert Bosch GmbH
- Continental AG
- ZF Friedrichshafen AG
- NXP Semiconductors N.V.
- Infineon Technologies AG
- STMicroelectronics N.V.
- Denso Corporation
- Aptiv PLC
- Texas Instruments Incorporated
- Analog Devices, Inc.
- NVIDIA Corporation
- Mobileye Global Inc.
- Valeo SA
- Renesas Electronics Corporation
- ON Semiconductor Corporation
- TDK Corporation
- TE Connectivity Ltd.
- Elmos Semiconductor SE
- LeddarTech Inc.
- BASELABS GmbH
- Kionix, Inc. (Rohm Co., Ltd.)
- CEVA, Inc.
- Memsic, Inc.
- Sensata Technologies, Inc.
- Velodyne Lidar, Inc.
- Innoviz Technologies Ltd.
- Ouster, Inc.
- Quanergy Systems, Inc.
- PlusAI Inc.
Additional Benefits:
- The market estimate (ME) sheet in Excel format
- 3 months of analyst support
TABLE OF CONTENTS
1 INTRODUCTION
- 1.1 Study Assumptions and Market Definition
- 1.2 Scope of the Study
2 RESEARCH METHODOLOGY
3 EXECUTIVE SUMMARY
4 MARKET LANDSCAPE
- 4.1 Market Overview
- 4.2 Market Drivers
- 4.2.1 Mainstream ADAS Mandates Accelerating Multi-Sensor Adoption
- 4.2.2 Declining Solid-State LiDAR Costs Below USD 400 per Unit
- 4.2.3 In-Vehicle Edge-AI Chipsets Enabling <10 ms Fusion Latency
- 4.2.4 Over-the-Air Regulation Requiring Continuous Perception Updates
- 4.2.5 Smart-City V2X Pilots Demanding High-Fidelity Environmental Models
- 4.2.6 Insurance Telematics Incentives for Fused Safety-Score APIs
- 4.3 Market Restraints
- 4.3.1 Absence of Global Sensor-Data Standards Across OEMs
- 4.3.2 Double-Digit Tariffs on LiDAR and IMU Imports in 2025
- 4.3.3 Real-Time Cyber-Security Certification Bottlenecks
- 4.3.4 Processor Power-Budget Limits in BEVs Below 20 W
- 4.4 Industry Value Chain Analysis
- 4.5 Regulatory Landscape
- 4.6 Technological Outlook
- 4.7 Impact of Macroeconomic Factors
- 4.8 Porter's Five Forces Analysis
- 4.8.1 Bargaining Power of Suppliers
- 4.8.2 Bargaining Power of Buyers
- 4.8.3 Threat of New Entrants
- 4.8.4 Intensity of Competitive Rivalry
- 4.8.5 Threat of Substitute Products
- 4.9 Key Patents and Research Activities
- 4.10 Major and Emerging Applications
- 4.10.1 Adaptive Cruise Control (ACC)
- 4.10.2 Autonomous Emergency Braking (AEB)
- 4.10.3 Electronic Stability Control (ESC)
- 4.10.4 Forward Collision Warning (FCW)
- 4.10.5 Other Applications
5 MARKET SIZE AND GROWTH FORECASTS (VALUE)
- 5.1 By Sensor Type
- 5.1.1 LiDAR
- 5.1.2 Radar
- 5.1.3 Camera
- 5.1.4 Ultrasonic
- 5.1.5 Inertial Measurement Units (IMU)
- 5.2 By Component
- 5.2.1 Hardware
- 5.2.2 Software
- 5.2.3 Services
- 5.3 By Technology
- 5.3.1 MEMS Sensors
- 5.3.2 Non-MEMS Sensors
- 5.4 By Level of Automation
- 5.4.1 Level 1
- 5.4.2 Level 2
- 5.4.3 Level 3
- 5.4.4 Level 4
- 5.4.5 Level 5
- 5.5 By Propulsion Type
- 5.5.1 Internal Combustion Engine Vehicles
- 5.5.2 Battery Electric Vehicles
- 5.5.3 Hybrid Electric Vehicles
- 5.5.4 Fuel Cell Electric Vehicles
- 5.6 By Vehicle Type
- 5.6.1 Passenger Cars
- 5.6.2 Light Commercial Vehicles
- 5.6.3 Heavy Commercial Vehicles
- 5.6.4 Other Autonomous Vehicles
- 5.7 By Geography
- 5.7.1 North America
- 5.7.1.1 United States
- 5.7.1.2 Canada
- 5.7.1.3 Mexico
- 5.7.2 South America
- 5.7.2.1 Brazil
- 5.7.2.2 Argentina
- 5.7.2.3 Rest of South America
- 5.7.3 Europe
- 5.7.3.1 Germany
- 5.7.3.2 United Kingdom
- 5.7.3.3 France
- 5.7.3.4 Italy
- 5.7.3.5 Spain
- 5.7.3.6 Rest of Europe
- 5.7.4 Asia-Pacific
- 5.7.4.1 China
- 5.7.4.2 Japan
- 5.7.4.3 India
- 5.7.4.4 South Korea
- 5.7.4.5 Australia
- 5.7.4.6 Rest of Asia-Pacific
- 5.7.5 Middle East and Africa
- 5.7.5.1 Middle East
- 5.7.5.1.1 Saudi Arabia
- 5.7.5.1.2 United Arab Emirates
- 5.7.5.1.3 Turkey
- 5.7.5.1.4 Rest of Middle East
- 5.7.5.2 Africa
- 5.7.5.2.1 South Africa
- 5.7.5.2.2 Nigeria
- 5.7.5.2.3 Egypt
- 5.7.5.2.4 Rest of Africa
- 5.7.5.1 Middle East
- 5.7.1 North America
6 COMPETITIVE LANDSCAPE
- 6.1 Market Concentration
- 6.2 Strategic Moves
- 6.3 Market Share Analysis
- 6.4 Company Profiles (includes Global level Overview, Market level overview, Core Segments, Financials as available, Strategic Information, Market Rank/Share for key companies, Products and Services, and Recent Developments)
- 6.4.1 Robert Bosch GmbH
- 6.4.2 Continental AG
- 6.4.3 ZF Friedrichshafen AG
- 6.4.4 NXP Semiconductors N.V.
- 6.4.5 Infineon Technologies AG
- 6.4.6 STMicroelectronics N.V.
- 6.4.7 Denso Corporation
- 6.4.8 Aptiv PLC
- 6.4.9 Texas Instruments Incorporated
- 6.4.10 Analog Devices, Inc.
- 6.4.11 NVIDIA Corporation
- 6.4.12 Mobileye Global Inc.
- 6.4.13 Valeo SA
- 6.4.14 Renesas Electronics Corporation
- 6.4.15 ON Semiconductor Corporation
- 6.4.16 TDK Corporation
- 6.4.17 TE Connectivity Ltd.
- 6.4.18 Elmos Semiconductor SE
- 6.4.19 LeddarTech Inc.
- 6.4.20 BASELABS GmbH
- 6.4.21 Kionix, Inc. (Rohm Co., Ltd.)
- 6.4.22 CEVA, Inc.
- 6.4.23 Memsic, Inc.
- 6.4.24 Sensata Technologies, Inc.
- 6.4.25 Velodyne Lidar, Inc.
- 6.4.26 Innoviz Technologies Ltd.
- 6.4.27 Ouster, Inc.
- 6.4.28 Quanergy Systems, Inc.
- 6.4.29 PlusAI Inc.
7 MARKET OPPORTUNITIES AND FUTURE OUTLOOK
- 7.1 White-space and Unmet-need Assessment

 自動駕駛汽車感測器融合市場:按技術、應用、車輛類型、感測器類型、國家和地區分類-全球產業分析、市場規模及佔有率和未來預測(2026-2033)
 感測器融合市場-2026-2032年全球市場預測
 汽車感測器融合市場預測至2034年:全球融合方法、感測器類型、自動化程度、技術、應用、銷售管道和區域分析
 感測器融合市場報告:按類型、技術、產業和地區分類(2026-2034 年)
 2026年全球感測器融合市場報告
 汽車感測器融合市場-策略洞察與預測(2026-2031年)
 感測器融合:市場佔有率分析、產業趨勢與統計、成長預測(2026-2031)
 感測器融合市場分析及預測(至2035年):依類型、產品類型、服務、技術、組件、應用、功能、部署類型及最終用戶分類感測器融合市場規模、佔有率、成長率及全球產業分析:按類型、應用和地區分類的洞察,2026-2034 年預測全球感測器融合市場規模、佔有率、趨勢和成長分析報告(2026-2034年)