


 |
市場調查報告書
商品編碼
2100498
POS終端:市佔率分析、產業趨勢與統計、成長預測(2026-2031年)Point-of-Sale Terminal - Market Share Analysis, Industry Trends & Statistics, Growth Forecasts (2026 - 2031) |
||||||

※ 本網頁內容可能與最新版本有所差異。詳細情況請與我們聯繫。
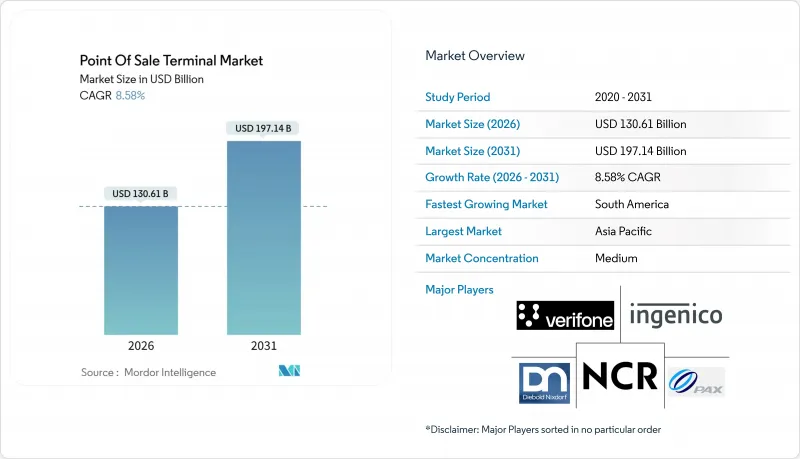
根據 Mordor Intelligence 預測,POS 終端市場規模預計將在 2026 年達到 1,306.1 億美元,到 2031 年將達到 1971.4 億美元,2026 年至 2031 年的年複合成長率(CAGR)為 8.58%。
本報告依支付方式(接觸式和非接觸式)、POS機類型(固定POS系統、行動/可攜式POS系統)、組件(硬體、軟體、服務)、部署模式(雲端、本地部署)、終端用戶產業(零售、飯店、醫療保健及其他)和地區進行細分。市場預測以美元計價。
全球POS終端市場趨勢及洞察
零售業採用率的擴大
統一商務計畫允許透過單一終端介面處理店內、線上和行動裝置購物,從而實現從貨架上尋找商品、完成線上訂單並降低最後一公里配送成本。快餐店正在部署自助服務終端,將支付和菜單客製化功能相結合,透過演算法提案額外商品,降低人事費用並提高顧客人均消費額。歐洲和北美的連鎖超市正在測試「掃碼即走」智慧型手機應用程式,讓消費者無需排隊結帳,但防盜和年齡驗證規則仍然是挑戰。時尚商店透過讓員工佩戴行動裝置並在現場完成銷售,顯著降低了顧客排隊等候時的放棄購買率。奢侈品零售商正在整合指紋識別器,以簡化分期付款和會員計劃的身份驗證流程。
雲端POS平台的廣泛應用
雲端架構將處理邏輯與固定硬體解耦,使企業能夠透過任何網路設備存取交易、庫存和客戶數據,從而降低現場 IT 成本。自動軟體更新免去了技術人員的差旅費用,這對於經營數百台終端的連鎖店而言是一項顯著優勢。訂閱式收費系統將資本支出 (CapEx) 轉化為可預測的營運支出 (OpEx),使中小企業能夠負擔得起升級費用。開放的應用程式介面 (API) 將會計、人員配備和行銷功能與核心支付流程整合,使終端轉變為業務管理中心。持續的雲端備份增強了災害復原,而提供者層級的 PCI 合規性則降低了單一商家的稽核複雜性。
對資料安全和網路詐騙的擔憂
如果韌體修補程式未能及時應用,惡意軟體可以從揮發性記憶體中提取數據,竊取原始的、未加密的卡片數據,這使得設備成為攻擊者的理想目標。違反支付卡產業資料安全標準 (PCI DSS) 可能導致每次違規最高 50 萬美元的罰款,長期違規甚至可能導致支付處理權限被吊銷。中小企業通常缺乏足夠的網路安全負責人,導致其繼續使用過時的軟體。令牌化和點對點加密可以降低風險,但硬體和收購方升級的成本阻礙了它們的普及。歐洲的《數位營運彈性法案》(DORA) 要求支付服務提供者在 24 小時內報告安全事件,這導致合規預算增加。
細分市場分析
至2025年,非接觸式終端將佔POS終端銷售額的71.23%。這主要歸功於晶片和PIN碼技術的引入,以響應全球責任轉移的趨勢。處理高價商品的商家仍然傾向於選擇PIN碼認證帶來的額外安全保障。在「一觸即付」的便利性以及政府為懲罰過度依賴現金的商家而採取的獎勵的推動下,非接觸式支付的普及率將以9.32%的複合年成長率持續成長至2031年。交通運輸、便利商店和快餐店引領著這一趨勢,因為更快的處理速度可以減少等待時間。
支援接觸式和非接觸式支付的混合終端正逐漸成為標準配置,因為近距離通訊天線的額外成本僅為2-3美元。在亞太地區,靜態QR碼進一步豐富了支付方式,使商家無需安裝昂貴的硬體。為了加快身份驗證速度,高階零售店和醫院藥房正在進行生物識別(指紋和臉部認證)的早期先導計畫。
即使到了2025年,固定櫃檯系統仍將佔據POS終端市場54.42%的佔有率,這主要得益於超市和藥局等需要大量交易的收銀台。在空間和電源充足的情況下,內建掃描器和錢箱能夠最大限度地提高收銀員的工作效率。同時,行動和可攜式終端正以9.67%的複合年成長率快速成長,吸引了需要隨時隨地收款的餐車、維修技師和戶外攤販等用戶。
平板電腦系統在高檔餐廳中逐漸普及,服務員可以在餐桌上分割和處理付款,從而降低餐桌周轉率並提高小費率。腕帶和戒指等穿戴式裝置正在音樂節和體育場進行測試,但由於電池續航力有限,其應用仍局限於小眾領域。環境適應性強的手持終端機則應用於倉庫和宅配車輛,即使在惡劣環境下也能進行庫存掃描和支付處理。
區域分析
亞太地區受中國龐大的商家群體和印度統一支付介面(UPI)的推動,預計到2025年將佔全球電子錢包銷售額的40.52%。隨著全球電子錢包競相爭取用戶,中國正加速從QR碼轉型為非接觸式近距離場通訊(NFC)的用戶。在印度,由於數位稅收的推廣,終端密度增加,但由於通訊基礎設施落後以及對費用的敏感性,農村地區的普及速度仍然緩慢。在日本,由於人口老化,行動支付的普及速度有所放緩,但2025年大阪世博會推動了飯店業的設備升級。韓國正在扮演生物識別支付系統測試和營運的「沙盒」角色,而印尼、泰國和越南則正在利用全通路平台整合電子商務和實體店。
在歐洲,諸如「數位時代的增值稅(VAT)」計畫和德國的「收銀機安全條例」等稅收法規正在推動終端設備的更新換代。經認證的安全模組雖然會增加硬體成本,但能為稅務機關提供即時可見性。英國脫歐後監管政策的差異迫使零售商適應不同的終端配置。北歐國家正朝著無現金社會邁進,對可同時處理現金和銀行卡的混合終端的需求有所下降,而東歐國家在加入歐盟後也在對其基礎設施進行現代化改造。
北美市場已趨於成熟,但創新仍蓬勃發展。 Square 和 Toast 等公司的整合平台正在取代傳統供應商,將薪資核算、數據分析和忠誠度計畫整合在一起。各州稅收制度的差異和隱私法規的碎片化增加了合規難度,從而推動了自動化軟體的普及。即時支付系統正在改善加拿大商家的現金流,而在墨西哥,電子帳單的推廣正迫使微型企業採用認證終端,儘管各地實施情況不盡相同。
南美洲的成長速度最快,預計複合年成長率將達到10.18%,這主要得益於巴西的「電子稅法」(Nota Fiscal Eletronica),該稅法對違規商家處以即時罰款。阿根廷的通貨膨脹推動了消費者對分期付款計劃的接受度,從而擴大了電子支付的普及範圍。智利和哥倫比亞也在製定類似的稅收框架,為服務覆蓋範圍廣的商家創造了區域性商機。中東和非洲仍在發展中,但肯亞和奈及利亞的行動支付正在建立一種替代基礎設施,這種基礎設施有可能超越傳統終端。
其他好處
- Excel格式的市場預測(ME)表
- 3個月的分析師支持
目錄
第1章:引言
- 研究假設和市場定義
- 調查範圍
第2章:調查方法
第3章執行摘要
第4章 市場狀況
- 市場概覽
- 市場促進因素
- 零售業採用率的擴大
- 雲端POS平台採用率的擴大
- 非接觸式和行動支付的需求加速成長
- POS數據、高級分析和CRM的整合
- 監管部門採取措施,推動會計流程數位化並強制推行電子帳單。
- 基於訂閱的「POS即服務」模式可降低資本支出(Cap-Ex)。
- 市場限制因素
- 對資料安全和網路詐騙的擔憂
- 與硬體可靠性和維護成本相關的挑戰
- 支付標準的區域碎片化
- 半導體供應鏈的波動性
- 價值鏈分析
- 監理情勢
- 科技趨勢(物聯網、人工智慧、邊緣處理)
- 波特五力分析
- 市場宏觀經濟趨勢的評估
第5章 市場規模與成長預測
- 透過付款方式
- 聯繫類型
- 非接觸式
- POS類型
- 固定式POS系統
- 行動/可攜式POS系統
- 按組件
- 硬體
- 軟體
- 服務
- 按實現類型
- 基於雲端的
- 本地部署
- 按最終用戶行業分類
- 零售
- 飯店業
- 醫療保健
- 運輸/物流
- 其他
- 按地區
- 北美洲
- 美國
- 加拿大
- 墨西哥
- 歐洲
- 德國
- 英國
- 法國
- 西班牙
- 義大利
- 其他歐洲國家
- 亞太地區
- 中國
- 日本
- 印度
- 韓國
- 東南亞
- 其他亞太國家
- 南美洲
- 巴西
- 阿根廷
- 其他南美國家
- 中東和非洲
- 中東
- GCC
- 土耳其
- 其他中東國家
- 非洲
- 南非
- 奈及利亞
- 其他非洲地區
- 中東
- 北美洲
第6章 競爭情勢
- 市場集中度
- 策略趨勢
- 市佔率分析
- 公司簡介
- Ingenico SA(Worldline)
- VeriFone Systems Inc.
- PAX Technology Ltd.
- NCR Corporation
- Diebold Nixdorf Inc.
- Toshiba Global Commerce Solutions
- HP Inc.
- Panasonic Corporation
- Fujitsu Ltd.
- Samsung Electronics Co. Ltd.
- Newland Payment Technology
- BBPOS Ltd.
- Square Inc.(Block)
- Fiserv Inc.(Clover)
- Lightspeed Commerce Inc.
- Shopify Inc.(Shopify POS)
- Toast Inc.
- Revel Systems Inc.
- Oracle Corporation(MICROS)
- Agilysys Inc.
- Aptos Inc.
- GK Software SE
- NEC Corporation
- NEXGO(Shenzhen Xinguodu Technology)
- Qashier Pte Ltd.
- Cegid Group
- Cow Hills Retail BV
- PCMS Group Ltd.
- SumUp Payments Limited
- Adyen NV
第7章 市場機會與未來展望
According to Mordor Intelligence, the point-of-Sale terminal market size stood at USD 130.61 billion in 2026 and is projected to reach USD 197.14 billion by 2031, translating into an 8.58% CAGR during 2026-2031.
This report is Segmented by Mode of Payment Acceptance (Contact-Based, and Contactless), POS Type (Fixed Point-Of-Sale Systems, and Mobile/Portable Point-Of-Sale Systems), Component (Hardware, Software, and Services), Deployment Mode (Cloud-Based, and On-Premise), and End-User Industry (Retail, Hospitality, Healthcare, and More) and Geography. The Market Forecasts are Provided in Terms of Value (USD).
Global Point-of-Sale Terminal Market Trends and Insights
Growing Adoption in the Retail Sector
Unified commerce initiatives allow store, online, and mobile purchases to clear through a single terminal interface, enabling stock sourced from store shelves to fulfill digital orders and trimming last-mile costs. Quick-service restaurants deploy self-service kiosks that marry payment with menu customization, cutting labor expenses and boosting basket size by presenting algorithmic add-ons. Grocery chains in Europe and North America piloted scan-and-go phone apps that let shoppers bypass staffed lanes, though theft controls and age-verification rules remain hurdles. Fashion stores equip associates with mobile devices that close sales on the showroom floor, slashing queue abandonment. Luxury retailers embed fingerprint readers to streamline identity confirmation for installment financing and loyalty redemption.
Rising Adoption of Cloud-based POS Platforms
Cloud architectures decouple processing logic from fixed hardware, so merchants retrieve transaction, stock, and customer data from any web device, a model that trims on-site IT costs. Automatic software updates end the expense of technician truck rolls, a boon to chains operating hundreds of terminals. Subscription pricing converts cap-ex to forecastable op-ex, making upgrades affordable for small businesses. Open application-programming-interfaces weave accounting, workforce scheduling, and marketing functions around the core payment flow, transforming terminals into business-management hubs. Continuous cloud backup improves disaster recovery, and provider-level PCI compliance shifts audit complexity away from individual merchants.
Data-Security and Cyber-fraud Concerns
Malware that scrapes volatile memory can snatch raw card data before encryption if firmware patches lag, keeping terminals an attractive attack vector. PCI DSS penalties may reach USD 500,000 per breach and prolonged non-compliance can lead to terminated processing privileges. Small businesses often lack cybersecurity staff, so outdated software persists. Tokenization and point-to-point encryption curb risk, yet hardware and acquirer upgrades impose costs that deter adoption. Europe's Digital Operational Resilience Act now forces payment providers to report incidents within 24 hours, lifting compliance budgets.
Other drivers and restraints analyzed in the detailed report include:
- Accelerating Demand for Contactless and Mobile Payments
- Integration of POS Data with Advanced Analytics and CRM
- Hardware Reliability and Maintenance-cost Issues
For complete list of drivers and restraints, kindly check the Table Of Contents.
Segment Analysis
Contact-based terminals accounted for 71.23% of the Point-of-Sale Terminal Market revenue in 2025, a legacy of chip-and-PIN rollouts following global liability shifts. High-ticket merchants still favor the added security of PIN verification. Contactless acceptance is scaling at a 9.32% CAGR through 2031, fueled by tap-and-go convenience and government incentives that penalize cash-heavy operations. Transit agencies, convenience stores, and quick-service restaurants lead adoption because faster throughput trims queue times.
Hybrid devices accepting both contact and contactless are becoming standard, as a near-field antenna adds only USD 2-3 to the bill of materials. In the Asia-Pacific region, static quick-response codes further diversify checkout options, allowing merchants to forgo costly hardware. Early pilots of biometric authentication, fingerprint and facial recognition, are underway in luxury retail and hospital pharmacies to accelerate identity proofing.
Fixed countertop systems still accounted for 54.42% of the Point-of-Sale Terminal Market in 2025, buoyed by grocery chains and pharmacies that process high transaction volumes at staffed stations. Integrated scanners and cash drawers maximize cashier efficiency where space and power are plentiful. Mobile and portable units, however, are advancing at a 9.67% CAGR, enticing food trucks, repair technicians, and outdoor vendors that require payment anywhere service is delivered.
Tablet-based systems dominate upscale restaurants, allowing servers to split checks and process payments tableside, reducing table turns and boosting tip percentages. Wearable forms such as wristbands and rings are trialed at festivals and stadiums, though limited battery life keeps usage niche. Ruggedized handhelds serve warehouses and courier fleets, marrying inventory scanning with payment collection under harsh conditions.
Complete Report Scope:
- By Mode of Payment Acceptance
- Contact-based
- Contactless
- By POS Type
- Fixed Point-of-Sale Systems
- Mobile / Portable Point-of-Sale Systems
- By Component
- Hardware
- Software
- Services
- By Deployment Mode
- Cloud-based
- On-Premise
- By End-User Industry
- Retail
- Hospitality
- Healthcare
- Transportation and Logistics
- Other End-User Industries
- By Geography
- North America
- United States
- Canada
- Mexico
- Europe
- Germany
- United Kingdom
- France
- Spain
- Italy
- Rest of Europe
- Asia-Pacific
- China
- Japan
- India
- South Korea
- Southeast Asia
- Rest of Asia-Pacific
- South America
- Brazil
- Argentina
- Rest of South America
- Middle East and Africa
- Middle East
- GCC
- Turkey
- Rest of Middle East
- Africa
- South Africa
- Nigeria
- Rest of Africa
- Middle East
- North America
Geography Analysis
Asia-Pacific delivered 40.52% of 2025 turnover, anchored by China's vast merchant base and India's Unified Payments Interface. China's shift from QR codes to contactless near-field communication is accelerating as global wallets compete for traffic. India's tax digitization push lifted terminal density, though rural adoption lags due to connectivity and fee sensitivity. Japan's aging demography tempers mobile uptake yet the 2025 Osaka Expo spurred hospitality upgrades. South Korea serves as a sandbox for biometric settlement trials, while Indonesia, Thailand, and Vietnam lean on omnichannel platforms to mesh e-commerce with storefronts.
Europe is in a replacement cycle triggered by fiscalization edicts such as the VAT in the Digital Age plan and Germany's Kassensicherungsverordnung. Certified security modules raise hardware costs but give tax agencies real-time visibility. The United Kingdom's post-Brexit divergence forces retailers to juggle distinct device configurations. Nordic countries are nearing cashless status, reducing demand for hybrid cash-card terminals, while EU accession is spurring infrastructure modernization in Eastern Europe.
North America is mature yet innovation-rich. Integrated platforms from Square and Toast displace legacy vendors by bundling payroll, analytics, and loyalty. State-level tax variation and patchwork privacy rules create compliance complexity that favors automated software. Canada's real-time rails improve cash flow for merchants, while Mexico's expanded e-invoicing mandate pushes micro-businesses toward certified devices despite uneven rural enforcement.
South America is the fastest riser at a predicted 10.18% CAGR, led by Brazil's Nota Fiscal Eletronica, which fines non-compliant merchants in real time. Argentina's inflation pushes consumers toward installment card plans, expanding electronic acceptance. Chile and Colombia are drafting similar fiscal frameworks, opening regional opportunities for vendors with service coverage. The Middle East and Africa remain nascent, but mobile money in Kenya and Nigeria is laying alternative rails that may leapfrog conventional terminals.
- Ingenico SA (Worldline)
- VeriFone Systems Inc.
- PAX Technology Ltd.
- NCR Corporation
- Diebold Nixdorf Inc.
- Toshiba Global Commerce Solutions
- HP Inc.
- Panasonic Corporation
- Fujitsu Ltd.
- Samsung Electronics Co. Ltd.
- Newland Payment Technology
- BBPOS Ltd.
- Square Inc. (Block)
- Fiserv Inc. (Clover)
- Lightspeed Commerce Inc.
- Shopify Inc. (Shopify POS)
- Toast Inc.
- Revel Systems Inc.
- Oracle Corporation (MICROS)
- Agilysys Inc.
- Aptos Inc.
- GK Software SE
- NEC Corporation
- NEXGO (Shenzhen Xinguodu Technology)
- Qashier Pte Ltd.
- Cegid Group
- Cow Hills Retail BV
- PCMS Group Ltd.
- SumUp Payments Limited
- Adyen N.V.
Additional Benefits:
- The market estimate (ME) sheet in Excel format
- 3 months of analyst support
TABLE OF CONTENTS
1 INTRODUCTION
- 1.1 Study Assumptions and Market Definition
- 1.2 Scope of the Study
2 RESEARCH METHODOLOGY
3 EXECUTIVE SUMMARY
4 MARKET LANDSCAPE
- 4.1 Market Overview
- 4.2 Market Drivers
- 4.2.1 Growing Adoption in the Retail Sector
- 4.2.2 Rising Adoption of Cloud-based POS Platforms
- 4.2.3 Accelerating Demand for Contactless and Mobile Payments
- 4.2.4 Integration of POS Data with Advanced Analytics and CRM
- 4.2.5 Regulatory Push for Fiscalisation and E-invoicing Mandates
- 4.2.6 Subscription-based "POS-as-a-Service" Models Lowering Cap-Ex
- 4.3 Market Restraints
- 4.3.1 Data-Security and Cyber-fraud Concerns
- 4.3.2 Hardware Reliability and Maintenance-cost Issues
- 4.3.3 Fragmentation of Regional Payment Standards
- 4.3.4 Semiconductor Supply-chain Volatility
- 4.4 Value Chain Analysis
- 4.5 Regulatory Landscape
- 4.6 Technological Outlook (IoT, AI, Edge-processing)
- 4.7 Porter's Five Forces Analysis
- 4.7.1 Bargaining Power of Suppliers
- 4.7.2 Bargaining Power of Buyers
- 4.7.3 Threat of New Entrants
- 4.7.4 Threat of Substitutes
- 4.7.5 Intensity of Competitive Rivalry
- 4.8 Assessment of Macro Economic Trends on the Market
5 MARKET SIZE AND GROWTH FORECASTS (VALUE)
- 5.1 By Mode of Payment Acceptance
- 5.1.1 Contact-based
- 5.1.2 Contactless
- 5.2 By POS Type
- 5.2.1 Fixed Point-of-Sale Systems
- 5.2.2 Mobile / Portable Point-of-Sale Systems
- 5.3 By Component
- 5.3.1 Hardware
- 5.3.2 Software
- 5.3.3 Services
- 5.4 By Deployment Mode
- 5.4.1 Cloud-based
- 5.4.2 On-Premise
- 5.5 By End-User Industry
- 5.5.1 Retail
- 5.5.2 Hospitality
- 5.5.3 Healthcare
- 5.5.4 Transportation and Logistics
- 5.5.5 Other End-User Industries
- 5.6 By Geography
- 5.6.1 North America
- 5.6.1.1 United States
- 5.6.1.2 Canada
- 5.6.1.3 Mexico
- 5.6.2 Europe
- 5.6.2.1 Germany
- 5.6.2.2 United Kingdom
- 5.6.2.3 France
- 5.6.2.4 Spain
- 5.6.2.5 Italy
- 5.6.2.6 Rest of Europe
- 5.6.3 Asia-Pacific
- 5.6.3.1 China
- 5.6.3.2 Japan
- 5.6.3.3 India
- 5.6.3.4 South Korea
- 5.6.3.5 Southeast Asia
- 5.6.3.6 Rest of Asia-Pacific
- 5.6.4 South America
- 5.6.4.1 Brazil
- 5.6.4.2 Argentina
- 5.6.4.3 Rest of South America
- 5.6.5 Middle East and Africa
- 5.6.5.1 Middle East
- 5.6.5.1.1 GCC
- 5.6.5.1.2 Turkey
- 5.6.5.1.3 Rest of Middle East
- 5.6.5.2 Africa
- 5.6.5.2.1 South Africa
- 5.6.5.2.2 Nigeria
- 5.6.5.2.3 Rest of Africa
- 5.6.5.1 Middle East
- 5.6.1 North America
6 COMPETITIVE LANDSCAPE
- 6.1 Market Concentration
- 6.2 Strategic Moves
- 6.3 Market Share Analysis
- 6.4 Company Profiles (Includes Global Level Overview, Market Level Overview, Core Segments, Financials as Available, Strategic Information, Market Rank/Share for Key Companies, Products and Services, and Recent Developments)
- 6.4.1 Ingenico SA (Worldline)
- 6.4.2 VeriFone Systems Inc.
- 6.4.3 PAX Technology Ltd.
- 6.4.4 NCR Corporation
- 6.4.5 Diebold Nixdorf Inc.
- 6.4.6 Toshiba Global Commerce Solutions
- 6.4.7 HP Inc.
- 6.4.8 Panasonic Corporation
- 6.4.9 Fujitsu Ltd.
- 6.4.10 Samsung Electronics Co. Ltd.
- 6.4.11 Newland Payment Technology
- 6.4.12 BBPOS Ltd.
- 6.4.13 Square Inc. (Block)
- 6.4.14 Fiserv Inc. (Clover)
- 6.4.15 Lightspeed Commerce Inc.
- 6.4.16 Shopify Inc. (Shopify POS)
- 6.4.17 Toast Inc.
- 6.4.18 Revel Systems Inc.
- 6.4.19 Oracle Corporation (MICROS)
- 6.4.20 Agilysys Inc.
- 6.4.21 Aptos Inc.
- 6.4.22 GK Software SE
- 6.4.23 NEC Corporation
- 6.4.24 NEXGO (Shenzhen Xinguodu Technology)
- 6.4.25 Qashier Pte Ltd.
- 6.4.26 Cegid Group
- 6.4.27 Cow Hills Retail BV
- 6.4.28 PCMS Group Ltd.
- 6.4.29 SumUp Payments Limited
- 6.4.30 Adyen N.V.
7 MARKET OPPORTUNITIES AND FUTURE OUTLOOK
- 7.1 White-space and Unmet-need Assessment

 POS終端市場-2026-2032年全球市場預測EMV POS終端市場-2026-2032年全球市場預測近距離場通訊 (NFC) POS 終端與支付市場-2026-2032 年全球市場預測電子資金轉帳市場:以組成部分、支付方式、交易類型、最終用戶和交易量分類-2026-2032年全球市場預測
 南美洲POS終端市場:市場佔有率分析、產業趨勢與統計及成長預測(2025-2030年)
 軟POS市場規模、佔有率和成長分析:按組件、支付類型、部署模式、作業系統、企業規模、應用、最終用戶和地區分類-2026-2033年產業預測
 零售POS終端市場-全球產業規模、佔有率、趨勢、機會、預測:按產品、組件、應用、地區和競爭對手分類,2021-2031年
 全球互聯POS終端市場-第九版
 全球零售POS終端市場規模、佔有率、趨勢及成長分析報告(2026-2034年)
 2026年全球銷售點終端市場報告