


 |
市場調查報告書
商品編碼
2100263
供應鏈分析:市場佔有率分析、產業趨勢與統計、成長預測(2026-2031)Supply Chain Analytics - Market Share Analysis, Industry Trends & Statistics, Growth Forecasts (2026 - 2031) |
||||||

※ 本網頁內容可能與最新版本有所差異。詳細情況請與我們聯繫。
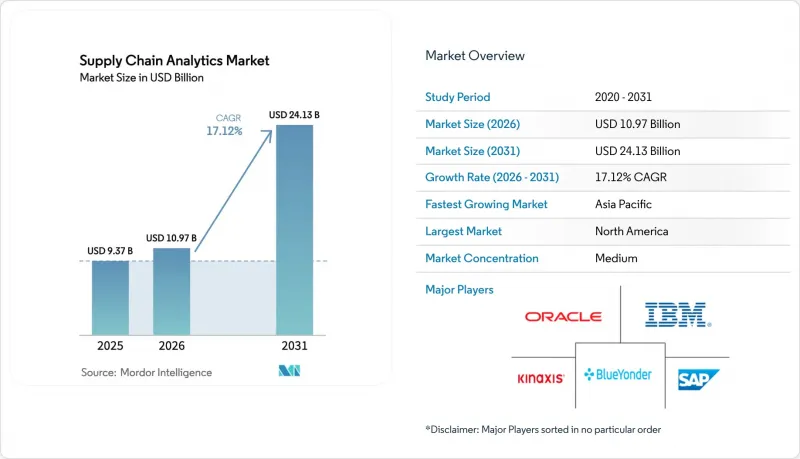
據 Mordor Intelligence 稱,供應鏈分析市場預計到 2026 年價值將達到 109.7 億美元,高於 2025 年的 93.7 億美元,預計到 2031 年將達到 241.3 億美元。
預計從 2026 年到 2031 年,其複合年成長率將達到 17.12%。
本報告按組件(軟體[需求規劃和預測等])、部署類型(本地部署、雲端部署等)、分析類型(說明分析等)、應用程式(庫存管理等)、最終用戶行業(零售、電子商務等)、公司規模(大型企業等)和地區進行分類。
全球供應鏈分析市場趨勢與洞察
提高零售與電子商務的履約效率
主要亮點
- 線上需求的爆炸性成長縮短了配送時限,迫使零售商將即時分析融入訂單、庫存和運輸的各個環節。隨著處方引擎實現承運商選擇和庫存分配的自動化,許多採用該技術的公司實現了30%的履約率提升和25%的物流成本降低。例如,加拿大輪胎公司透過在需求高峰期最佳化通路分配並應用全網最佳化措施,實現了20%的銷售額成長。隨著當日送達的需求擴展到新的產品類別,供應鏈分析市場將在維持利潤率和客戶維繫繼續發揮關鍵作用。
工業4.0帶來的現場數據激增
即時數據,包括品質、產量和能源消耗數據,從連網機器串流到更廣泛的供應鏈模型中,預計將整體設備效率 (OEE) 提高高達 15%,並將品質成本降低 20%。透過彌合營運技術 (OT) 和資訊技術 (IT) 之間的差距,負責人可以從靜態計劃轉向動態補貨計劃,以適應工廠的即時狀況。預測性維護觸發機制延長了資產壽命,而將工廠訊號與供應商評分卡結合,則能夠更快地進行缺陷根本原因分析。
資料管道遭受網路攻擊
企業間日益成長的資料流擴大了攻擊面,單次資料外洩的平均成本(總合罰款、停機時間和補救措施)目前高達 435 萬美元。儘管企業正透過零信任架構來降低風險,但額外的控制措施可能會延長專案週期並增加預算,從而抑制供應鏈分析市場的短期前景。
細分市場分析
隨著企業投資於能夠在單一環境中模擬需求、庫存、生產和物流的整合套件,到2025年,軟體收入將佔總收入的66.12%。這些引擎每天處理數十億個資料點,檢測異常情況並提案糾正措施。然而,推動市場成長的主要動力是服務業,而該產業正以24.6%的複合年成長率持續成長至2031年,因為企業越來越意識到永續價值取決於持續獎勵。供應商正在推出基於績效的契約,將薪酬與存貨周轉和服務水平的提升掛鉤,從而協調激勵機制並促進供應鏈分析市場的擴張。
在軟體領域,庫存和倉庫管理模組仍然是核心收入來源。隨著附加元件,而新興的小型供應商則發布了以強化學習為核心的雲端原生平台。因此,競爭的關鍵不在於功能清單的豐富程度,而在於獲取洞察的速度。
到 2025 年,雲端主機將佔新部署的 62.31%,證實了企業更傾向於可擴展的運算能力和即時功能更新,而非本地客製化架構。即使資料主權法規要求敏感工作負載保留在本地,將批量分析和 AI 訓練卸載到雲端的混合模式也因其成本效益而日益受到青睞。邊緣節點將本地自治與集中管治相結合,在連接延遲時向卡車司機駕駛室和貨場大門發送警報。這種分散式基礎設施支援多種企業用例,從即時追蹤海運到協同運力競標,從而拓展了雲端供應商的供應鏈分析市場。
區域分析
到2025年,北美將以40.85%的市佔率佔據榜首。這主要得益於早期雲端運算應用、充裕的創業投資資金以及監管機構對供應鏈透明度的迫切要求。美國零售商正利用預測性庫存分配來平衡實體店和電商庫存,而通用汽車等製造商則利用分析技術制定半導體籌資策略,以應對產能限制。聯邦政府為促進半導體生產回流美國以及發展清潔能源供應鏈而提供的獎勵,進一步擴大了企業的分析預算,因為企業需要即時情境建模來權衡本地化與成本風險之間的關係。
亞太地區是成長最快的地區,預計到2031年將維持24.8%的複合年成長率,這主要得益於電子商務的快速發展、智慧工廠項目的推進以及政府對雲端遷移的補貼。中國企業正在利用雲端平台靈活協調龐大產業叢集的生產,並促進供應商之間的合作(mdpi.com)。印度的生產連結獎勵計畫計畫(PLI)鼓勵全球品牌建立區域基地,而對三級供應商的了解已成為董事會的強制性要求。日本製造商正在利用分析技術重新設計其供應商生態系統,並增強應對自然災害和地緣政治風險的能力。
歐洲依然保持著強大的影響力,在支持嚴格的供應鏈資訊揭露要求(CSRD)的永續發展分析領域處於領先地位。汽車、航太和化學企業正在利用Confinity-X等協作平台整合需求預測並簡化入境物流,從而降低排放和成本。南美、中東和非洲正從小規模的基礎開始擴張,主要集中在消費品、採礦和能源貿易路線。在這些行業,缺乏透明度歷來導致營運資本膨脹。由雲端超大規模資料中心業者支援的跨境資料通道正在這些新興市場建立即時控制塔和整體視圖,進一步增強供應鏈分析市場的全球影響力。
其他好處:
- Excel格式的市場預測(ME)表
- 3個月的分析師支持
目錄
第1章:引言
- 市場定義與研究假設
- 調查範圍
第2章:調查方法
第3章執行摘要
第4章 市場狀況
- 市場概覽
- 市場促進因素
- 零售電子商務的快速成長正在縮短履約週期。
- 工業4.0的引入導致從現場收集的數據量增加。
- 進階分析堆疊中的雲端成本效率
- 多層次的可視性對於後疫情時代的韌性至關重要。
- 關於範圍 3 碳可追溯性的法規(歐盟碳排放交易指令,美國證券交易委員會)
- Gen-AI 副駕駛顯著降低了建模技能的進入門檻。
- 市場限制因素
- 針對整合資料管道的網路攻擊
- 升級舊有系統帶來的高昂整體擁有成本
- 各層級的資料品質與互通性問題
- 出口管制條例限制了雲端資料的居住要求
- 價值供應鏈分析
- 監理情勢
- 技術展望
- 波特五力分析
- 宏觀經濟因素的影響
第5章 市場規模與成長預測
- 按組件
- 軟體
- 需求計劃和需求預測
- 採購與尋源分析
- 庫存和倉庫分析
- 物流/運輸分析
- 可視化和報告創建
- 服務
- 專業服務
- 託管服務
- 軟體
- 不同的發展
- 現場
- 雲
- 混合
- 按分析類型
- 說明的
- 診斷
- 預測分析
- 規範
- 認知的
- 透過使用
- 庫存管理
- 需求預測
- 採購分析
- 供應商績效管理
- 物流和運輸最佳化
- 風險管理與合規
- 永續性分析
- 產業最終用途
- 零售與電子商務
- 製造業
- 車
- 醫療保健和生命科學
- 食品/飲料
- 面向消費者的包裝商品
- 航太/國防
- 高科技電子產品
- 其他
- 按公司規模
- 大公司
- 中小企業
- 按地區
- 北美洲
- 美國
- 加拿大
- 墨西哥
- 南美洲
- 巴西
- 阿根廷
- 其他南美國家
- 歐洲
- 德國
- 英國
- 法國
- 義大利
- 西班牙
- 俄羅斯
- 其他歐洲國家
- 亞太地區
- 中國
- 日本
- 印度
- 韓國
- 澳洲和紐西蘭
- 其他亞太國家
- 中東和非洲
- 中東
- 沙烏地阿拉伯
- UAE
- 土耳其
- 其他中東國家
- 非洲
- 南非
- 奈及利亞
- 肯亞
- 其他非洲國家
- 中東
- 北美洲
第6章 競爭情勢
- 市場集中度
- 策略趨勢
- 市佔率分析
- 公司簡介
- IBM Corporation
- SAP SE
- Oracle Corporation
- Blue Yonder Group Inc.
- Accenture PLC
- Manhattan Associates
- Kinaxis Inc.
- Infor(Koch Industries)
- Coupa Software(Llamasoft)
- SAS Institute Inc.
- TIBCO Software Inc.
- Software AG
- Genpact Ltd.
- Aera Technology
- Capgemini SE
- Datup.ai
- GEP Worldwide
- Logility Inc.
- Resilinc
- QlikTech International AB
第7章 市場機會與未來趨勢
- 評估未開發的領域和未滿足的需求
According to Mordor Intelligence, supply chain analytics market size in 2026 is estimated at USD 10.97 billion, growing from 2025 value of USD 9.37 billion with 2031 projections showing USD 24.13 billion, growing at 17.12% CAGR over 2026-2031.
This report is Segmented by Component (Software [Demand Planning and Forecasting, and More]), by Deployment (On-Premise, Cloud, and More), by Analytics Type (Descriptive, and More), by Application (Inventory Management, and More), by End-Use Industry (Retail and E-Commerce, and More), by Enterprise Size (Large Enterprises, and More), and Geography.
Global Supply Chain Analytics Market Trends and Insights
Retail e-commerce fulfilment compression
Key Highlights
- Explosive online demand is shrinking delivery windows and forcing retailers to embed real-time analytics across order, stock, and transport nodes. Most adopters achieve 30% higher fulfilment rates and 25% lower logistics costs once prescriptive engines automate carrier selection and inventory placement. Canadian Tire, for instance, improved channel allocation during volatile peaks and lifted sales 20% by applying network-wide optimisation. As same-day delivery expectations spread to new categories, the supply chain analytics market will remain pivotal to margin defence and customer retention.
Industry 4.0 shop-floor data surge
Connected machinery streams live quality, throughput, and energy data that feeds wider supply-chain models, lifting overall equipment effectiveness by up to 15% and cutting quality costs 20% . Closing the OT-IT gap lets planners move from static schedules to dynamic replenishment aligned with real-time plant conditions. Predictive maintenance triggers extend asset life, while linking factory signals to supplier scorecards allows faster root-cause analysis of defects.
Cyber-attacks on data pipelines
Inter-company data flows widen the attack surface, and an average breach now costs USD 4.35 million when fines, downtime, and remediation are tallied . Firms offset risk with zero-trust architectures, but extra controls can lengthen project timelines and inflate budgets, tempering the near-term outlook for the supply chain analytics market.
Other drivers and restraints analyzed in the detailed report include:
- Cloud affordability for analytics stacks
- Post-pandemic multi-tier visibility mandate
- High total cost of legacy upgrades
For complete list of drivers and restraints, kindly check the Table Of Contents.
Segment Analysis
Software claimed 66.12% of 2025 revenue as firms invested in integrated suites that model demand, inventory, production, and logistics in one environment. These engines ingest billions of data points daily, surfacing anomalies and prescribing corrective actions. Yet services are the market's growth engine, advancing at 24.6% CAGR to 2031 as companies grasp that sustained value depends on continuous tuning. Vendors package outcome-based engagements that link fees to inventory turns or service-level gains, aligning incentives and expanding the supply chain analytics market.
Inside software, inventory and warehouse modules remain the profit core. AI upgrades convert them from passive dashboards to autonomous agents that rebalance stock, schedule labour, and replot warehouse slots without human intervention. Established vendors retrofit deep-learning add-ons, whereas smaller entrants release cloud-native platforms built around reinforcement learning. Competition therefore hinges on speed of insight delivery rather than breadth of feature checklists.
Cloud hosts delivered 62.31% of new installs in 2025, confirming that organisations prefer scalable compute and instant feature updates to custom on-premise stacks. Hybrid models gain favour where data sovereignty rules require sensitive workloads to remain in-house, yet batch analytics and AI training burst to the cloud for cost efficiency. Edge nodes push alerts to truck cabins and yard gates when connectivity lags, blending local autonomy with central governance. This distributed fabric unlocks multi-company use cases-from real-time ocean-freight tracking to collaborative capacity auctions-broadening the supply chain analytics market size for cloud vendors.
Complete Report Scope:
- By Component
- Software
- Demand Planning and Forecasting
- Procurement and Sourcing Analytics
- Inventory and Warehouse Analytics
- Logistics and Transportation Analytics
- Visualization and Reporting
- Services
- Professional Services
- Managed Services
- Software
- By Deployment
- On-premise
- Cloud
- Hybrid
- By Analytics Type
- Descriptive
- Diagnostic
- Predictive
- Prescriptive
- Cognitive
- By Application
- Inventory Management
- Demand Forecasting
- Procurement Analytics
- Supplier Performance Management
- Logistics and Transportation Optimisation
- Risk Management and Compliance
- Sustainability Analytics
- By End-use Industry
- Retail and E-commerce
- Manufacturing
- Automotive
- Healthcare and Life Sciences
- Food and Beverage
- Consumer Packaged Goods
- Aerospace and Defence
- High-Tech and Electronics
- Others
- By Enterprise Size
- Large Enterprises
- Small and Medium Enterprises (SMEs)
- By Geography
- North America
- United States
- Canada
- Mexico
- South America
- Brazil
- Argentina
- Rest of South America
- Europe
- Germany
- United Kingdom
- France
- Italy
- Spain
- Russia
- Rest of Europe
- Asia-Pacific
- China
- Japan
- India
- South Korea
- Australia and New Zealand
- Rest of Asia-Pacific
- Middle East and Africa
- Middle East
- Saudi Arabia
- UAE
- Turkey
- Rest of Middle East
- Africa
- South Africa
- Nigeria
- Kenya
- Rest of Africa
- Middle East
- North America
Geography Analysis
North America led with 40.85% share in 2025, driven by early cloud uptake, rich venture funding, and regulatory push for supply-chain transparency. US retailers apply predictive allocations to balance store and e-commerce stock, while manufacturers such as GM use analytics to steer chip sourcing strategies around capacity constraints. Federal incentives for semiconductor reshoring and clean-energy supply chains further elevate analytics budgets, as firms need live scenario modelling to weigh localisation against cost and risk.
Asia-Pacific is the fastest-growing region at 24.8% CAGR to 2031, buoyed by e-commerce booms, smart-factory programs, and government subsidies for cloud migration. Chinese enterprises apply cloud platforms to orchestrate flexible production and synchronise suppliers in sprawling industrial clusters mdpi.com . India's PLI (production-linked incentives) schemes entice global brands to build regional nodes, making visibility into tier-three suppliers a board mandate. Japanese manufacturers leverage analytics to redesign supplier ecosystems for resilience against natural disasters and geopolitical risk.
Europe retains a strong presence, led by sustainability analytics that supports strict CSRD disclosures. Automotive, aerospace, and chemicals companies use collaborative platforms like Confinity-X to pool demand forecasts and streamline inbound logistics, cutting both emissions and cost. South America and the Middle East and Africa expand from smaller bases, primarily in consumer goods, mining, and energy trade lanes where visibility gaps historically inflated working capital. Cross-border data corridors powered by cloud hyperscalers now enable real-time control-tower views in these emerging markets, reinforcing the global scope of the supply chain analytics market.
- IBM Corporation
- SAP SE
- Oracle Corporation
- Blue Yonder Group Inc.
- Accenture PLC
- Manhattan Associates
- Kinaxis Inc.
- Infor (Koch Industries)
- Coupa Software (Llamasoft)
- SAS Institute Inc.
- TIBCO Software Inc.
- Software AG
- Genpact Ltd.
- Aera Technology
- Capgemini SE
- Datup.ai
- GEP Worldwide
- Logility Inc.
- Resilinc
- QlikTech International AB
Additional Benefits:
- The market estimate (ME) sheet in Excel format
- 3 months of analyst support
TABLE OF CONTENTS
1 INTRODUCTION
- 1.1 Market Definition and Study Assumptions
- 1.2 Scope of the Study
2 RESEARCH METHODOLOGY
3 EXECUTIVE SUMMARY
4 MARKET LANDSCAPE
- 4.1 Market Overview
- 4.2 Market Drivers
- 4.2.1 Retail e-commerce boom compressing fulfil-ment cycles
- 4.2.2 Industry 4.0 adoption amplifies shop-floor data exhaust
- 4.2.3 Cloud affordability for advanced analytics stacks
- 4.2.4 Post-pandemic resiliency mandates multi-tier visibility
- 4.2.5 Scope-3 carbon-traceability regulations (EU CSRD, SEC)
- 4.2.6 Gen-AI copilots slashing modelling skill barriers
- 4.3 Market Restraints
- 4.3.1 Cyber-attacks on integrated data pipelines
- 4.3.2 High total cost of ownership for legacy upgrades
- 4.3.3 Data quality and interoperability issues across tiers
- 4.3.4 Export-control rules throttling cloud data residency
- 4.4 Value / Supply-Chain Analysis
- 4.5 Regulatory Landscape
- 4.6 Technological Outlook
- 4.7 Porter's Five Forces Analysis
- 4.7.1 Bargaining Power of Suppliers
- 4.7.2 Bargaining Power of Consumers
- 4.7.3 Threat of New Entrants
- 4.7.4 Threat of Substitutes
- 4.7.5 Intensity of Competitive Rivalry
- 4.8 Impact of Macroeconomic Factors
5 MARKET SIZE AND GROWTH FORECASTS (VALUE)
- 5.1 By Component
- 5.1.1 Software
- 5.1.1.1 Demand Planning and Forecasting
- 5.1.1.2 Procurement and Sourcing Analytics
- 5.1.1.3 Inventory and Warehouse Analytics
- 5.1.1.4 Logistics and Transportation Analytics
- 5.1.1.5 Visualization and Reporting
- 5.1.2 Services
- 5.1.2.1 Professional Services
- 5.1.2.2 Managed Services
- 5.1.1 Software
- 5.2 By Deployment
- 5.2.1 On-premise
- 5.2.2 Cloud
- 5.2.3 Hybrid
- 5.3 By Analytics Type
- 5.3.1 Descriptive
- 5.3.2 Diagnostic
- 5.3.3 Predictive
- 5.3.4 Prescriptive
- 5.3.5 Cognitive
- 5.4 By Application
- 5.4.1 Inventory Management
- 5.4.2 Demand Forecasting
- 5.4.3 Procurement Analytics
- 5.4.4 Supplier Performance Management
- 5.4.5 Logistics and Transportation Optimisation
- 5.4.6 Risk Management and Compliance
- 5.4.7 Sustainability Analytics
- 5.5 By End-use Industry
- 5.5.1 Retail and E-commerce
- 5.5.2 Manufacturing
- 5.5.3 Automotive
- 5.5.4 Healthcare and Life Sciences
- 5.5.5 Food and Beverage
- 5.5.6 Consumer Packaged Goods
- 5.5.7 Aerospace and Defence
- 5.5.8 High-Tech and Electronics
- 5.5.9 Others
- 5.6 By Enterprise Size
- 5.6.1 Large Enterprises
- 5.6.2 Small and Medium Enterprises (SMEs)
- 5.7 By Geography
- 5.7.1 North America
- 5.7.1.1 United States
- 5.7.1.2 Canada
- 5.7.1.3 Mexico
- 5.7.2 South America
- 5.7.2.1 Brazil
- 5.7.2.2 Argentina
- 5.7.2.3 Rest of South America
- 5.7.3 Europe
- 5.7.3.1 Germany
- 5.7.3.2 United Kingdom
- 5.7.3.3 France
- 5.7.3.4 Italy
- 5.7.3.5 Spain
- 5.7.3.6 Russia
- 5.7.3.7 Rest of Europe
- 5.7.4 Asia-Pacific
- 5.7.4.1 China
- 5.7.4.2 Japan
- 5.7.4.3 India
- 5.7.4.4 South Korea
- 5.7.4.5 Australia and New Zealand
- 5.7.4.6 Rest of Asia-Pacific
- 5.7.5 Middle East and Africa
- 5.7.5.1 Middle East
- 5.7.5.1.1 Saudi Arabia
- 5.7.5.1.2 UAE
- 5.7.5.1.3 Turkey
- 5.7.5.1.4 Rest of Middle East
- 5.7.5.2 Africa
- 5.7.5.2.1 South Africa
- 5.7.5.2.2 Nigeria
- 5.7.5.2.3 Kenya
- 5.7.5.2.4 Rest of Africa
- 5.7.5.1 Middle East
- 5.7.1 North America
6 COMPETITIVE LANDSCAPE
- 6.1 Market Concentration
- 6.2 Strategic Moves
- 6.3 Market Share Analysis
- 6.4 Company Profiles (includes Global level Overview, Market level overview, Core Segments, Financials as available, Strategic Information, Market Rank/Share for key companies, Products and Services, and Recent Developments)
- 6.4.1 IBM Corporation
- 6.4.2 SAP SE
- 6.4.3 Oracle Corporation
- 6.4.4 Blue Yonder Group Inc.
- 6.4.5 Accenture PLC
- 6.4.6 Manhattan Associates
- 6.4.7 Kinaxis Inc.
- 6.4.8 Infor (Koch Industries)
- 6.4.9 Coupa Software (Llamasoft)
- 6.4.10 SAS Institute Inc.
- 6.4.11 TIBCO Software Inc.
- 6.4.12 Software AG
- 6.4.13 Genpact Ltd.
- 6.4.14 Aera Technology
- 6.4.15 Capgemini SE
- 6.4.16 Datup.ai
- 6.4.17 GEP Worldwide
- 6.4.18 Logility Inc.
- 6.4.19 Resilinc
- 6.4.20 QlikTech International AB
7 MARKET OPPORTUNITIES AND FUTURE TRENDS
- 7.1 White-space and Unmet-need Assessment

 2026-2030年全球物流與供應鏈人工智慧市場
 全球供應鏈分析市場規模、佔有率、趨勢和成長分析報告(2026-2034)
 2026-2030年全球供應鏈分析市場
 供應鏈分析市場:按組件、部署類型、組織規模、應用和產業分類-2026-2032年全球市場預測
 供應鏈和物流中的智慧體人工智慧:市場佔有率分析、產業趨勢和統計數據以及成長預測(2026-2031 年)
 2026年全球供應鏈分析市場報告
 2026-2030年全球逆向物流人工智慧市場
 供應鏈分析市場:按解決方案類型、部署方式、應用和區域分類全球供應鏈和物流領域基於代理的人工智慧市場:市場規模、佔有率、趨勢和成長分析報告(2026-2034)
 供應鏈分析市場規模、佔有率、趨勢和預測:按組件、部署類型、企業規模、行業和地區分類,2026-2034 年