


 |
市場調查報告書
商品編碼
2099421
AI框架最佳化:市場佔有率分析、產業趨勢與統計、成長預測(2026-2031年)AI Framework Optimization - Market Share Analysis, Industry Trends & Statistics, Growth Forecasts (2026 - 2031) |
||||||

※ 本網頁內容可能與最新版本有所差異。詳細情況請與我們聯繫。
根據 Mordor Intelligence 預測,人工智慧框架最佳化市場規模將從 2025 年的 45.1 億美元成長到 2026 年的 58.3 億美元,然後在 2031 年達到 186.6 億美元,2026 年至 2031 年的複合年成長率為 26.20%。
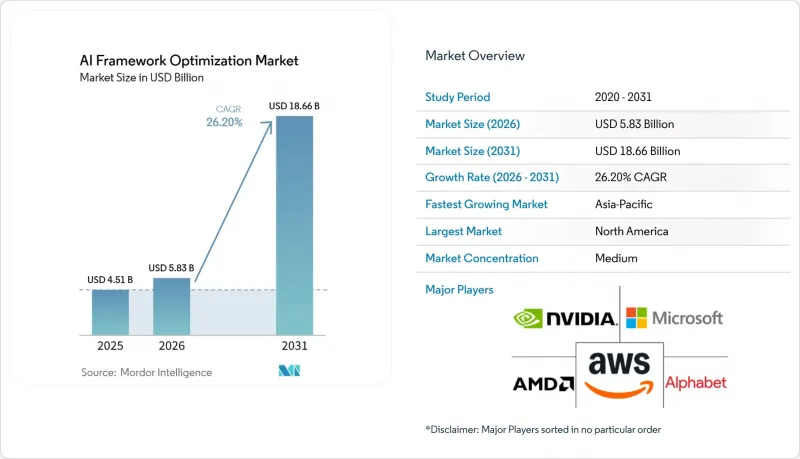
本報告按解決方案類型(例如,模型最佳化和壓縮軟體)、部署環境(例如,本地部署和私有雲端、設備端人工智慧)、組織規模(例如,大型企業、中小企業)、應用領域(例如,機器人、自主系統、邊緣智慧)和地區進行細分。市場預測以美元計價。
全球人工智慧框架最佳化市場趨勢與洞察
對超低延遲推理的需求日益成長
如今,延遲已成為互動式人工智慧、詐欺檢測、工業控制、機器人和其他即時生產系統的基本運作要求。人工智慧框架最佳化市場正從中受益,因為回應時間的縮短直接影響使用者體驗、基礎設施利用率和服務穩定性。這種壓力在基於代理的系統中特別顯著,因為單一工作流程在傳回結果之前可能會觸發多次模型呼叫、資料擷取步驟和工具操作。 2026年2月,NVIDIA報告稱,在Blackwell架構上使用DFlash進行推測性解碼,某些工作負載的吞吐量最高可提升15倍。這顯示軟體層仍有龐大的效能提升空間。正因如此,買家繼續專注於批次、快取、令牌調度和推測性執行,而不是將推理速度視為「已解決的問題」。因此,隨著工作負載變得越來越複雜,人工智慧框架最佳化市場持續投資於服務軟體和運行時控制,以將延遲控制在生產可接受的範圍內。
生成式人工智慧和基於代理的工作流程的發展
生成式人工智慧已不再局限於孤立的先導計畫,而是更加緊密地整合到實際業務流程、客戶支援流程、開發者工具和內部知識系統中。與傳統的單步人工智慧用例相比,基於代理的工作流程能夠迅速放大推理事件,因此人工智慧框架最佳化市場正受益於此轉變。隨著推理路徑、搜尋循環和外部工具呼叫次數的增加,記憶體負載、令牌吞吐量需求以及對更佳執行規劃的需求也隨之增加。 2026年3月,NVIDIA發布了專為基於代理的人工智慧設計的處理器Vera。這表明,供應商已經在重新設計其系統,以適應多階段人工智慧工作負載對運行時效能的高要求。因此,企業更加重視能夠管理提示、上下文、模型路由和迭代執行且不會引入不可接受延遲的編配層。隨著基於代理的設計日益普及,人工智慧框架最佳化市場預計將繼續與模型創新以及服務交付效率緊密相關。
專用人工智慧基礎設施高成本
最佳化仍然依賴對實際運行模型的生產環境硬體的直接存取。因此,人工智慧框架最佳化市場仍然受到加速器集群、高效能伺服器以及大規模測試所需的電力和冷卻能力成本的限制。對於中型買家以及運算資源和資料中心基礎設施不足的地區而言,這種負擔更為沉重。雖然雲端存取有所幫助,但也會導致成本持續增加,並可能削弱對基準測試、核心調優和檢驗週期的直接控制。 2026年6月,歐盟委員會提案了《雲端和人工智慧發展法案》,旨在建立一個歐盟範圍內的可靠雲端和人工智慧開發框架。這或許會在未來改善訪問狀況,但這只是一項政策措施,而非立竿見影的基礎設施解決方案。在存取規模大幅擴大之前,人工智慧框架最佳化市場將繼續面臨緩慢的普及,因為許多組織希望提高效率,但缺乏足夠的專用運算資源來進行有效的最佳化。
細分市場分析
到 2025 年,AI 推理服務和編配軟體將佔據 AI 框架最佳化市場佔有率的 27.11%,成為最大的解決方案細分市場。這一領先地位反映出,只有確保穩定的延遲和可用性,從而在生產環境中可靠地交付模型,最佳化才能帶來明顯的商業價值。企業通常從服務和編配進行部署,因為這一層直接將基礎設施決策與使用者體驗、服務連續性和營運成本連結起來。此外,由於需要重複使用模型,基於代理程式的工作流程需要比傳統 AI 部署更強大的路由、快取和會話控制,這也將使該細分市場受益。從實際角度來看,這將確保 AI 框架最佳化市場繼續圍繞著能夠使模型大規模運行的軟體展開,而不僅僅是提高孤立的基準測試分數。
在「模型最佳化和壓縮軟體」領域,人工智慧框架最佳化市場預計到2031年將以27.21%的複合年成長率成長,成為成長最快的解決方案細分市場。這一成長反映了商業性的轉變,即不再透過購買新硬體來解決所有部署問題,而是致力於從現有運算資源中挖掘更多吞吐量。 2025年發表在ACL Anthology上的一項研究表明,在大型模型中,精細的W8A8-INT量化可以將與FP8的精度差距降低至0.7個百分點,這證明了生產級壓縮技術在大規模部署中的有效性。圖編譯、運行時加速、效能分析、可觀測性和託管服務仍然至關重要,因為它們分別針對從模型準備到運作的不同階段。總而言之,人工智慧框架最佳化市場提供了豐富的解決方案組合,任何單一類別都無法在任何客戶環境中完全取代其他類別。
預計到2025年,雲端和超大規模資料中心將佔據人工智慧框架最佳化市場規模的54.33%,雲端基礎設施仍將是其主要收入來源。這反映了超大規模資料中心業者和大型企業營運共用推理平台、集中式模型更新和大規模生產工作負載的規模。此外,雲端環境只需一次部署即可輕鬆將最佳化變更的優勢惠及眾多使用者、團隊和服務。這種操作便利性對於正從試點階段過渡到持續生產的組織而言仍然是一項顯著優勢。因此,雲端原生服務、調度和可觀測性工具的支出將繼續佔據人工智慧框架最佳化市場的大部分佔有率。
預計到2031年,以設備端AI為導向的AI框架最佳化市場將以27.62%的複合年成長率成長,在所有部署環境中成長最高。由於隱私要求、網路連接不佳以及嚴格的回應時間目標,許多工作負載難以僅依靠雲端推理來支持,因此本地執行正日益受到關注。 NVIDIA計畫於2026年推出用於嵌入式汽車和機器人推理的TensorRT Edge-LLM,顯示設備專用最佳化堆疊正在興起。隨著許多組織將工作負載分佈在公共和私人環境中,而不是依賴單一運行時,本地部署、邊緣基礎設施和混合模式也變得越來越重要。這種多元化使得能夠同時管理跨多個部署路徑的可移植性、管治和效能的供應商在AI框架最佳化市場中擁有越來越大的優勢。
區域分析
到2025年,北美將佔據人工智慧框架最佳化市場48.44%的佔有率,並繼續保持其在收入方面的領先地位。美國憑藉著超大規模雲端容量、強大的供應商生態系統以及推理軟體和人工智慧硬體的持續產品發布,鞏固了這一地位。加拿大正透過其研究基礎設施和商業化網路深化其區域影響力,這些舉措有助於將模型開發轉向可部署的運行時和服務工具。南美洲雖然規模仍然較小,但隨著企業擴展其數位基礎設施並尋求低成本的方式來支援本地人工智慧執行,其對人工智慧的興趣日益濃厚。
歐洲仍然是人工智慧框架最佳化市場的領先地區,因為監管和效能如今都對部署設計產生顯著影響。歐盟人工智慧法案將於2026年8月2日全面實施,將提升高風險系統可審計最佳化工作流程的價值。德國、英國和法國是關鍵的需求中心,這得益於製造業、金融服務業、醫療保健業和公共部門等需要可靠推理行為的領域。此外,歐盟委員會於2026年6月提案的雲端人工智慧發展法案旨在建構一個更強大、更自主的運算框架,該框架能夠支援歐洲各地的本地部署和混合堆疊部署,並影響鄰近監管市場的採購優先順序。
預計到2031年,亞太地區將以27.42%的複合年成長率成長,成為人工智慧框架最佳化市場成長最快的區域板塊。這一成長主要得益於政府主導的人工智慧基礎設施規劃、大規模的設備製造地以及對本土軟體生態系統日益成長的興趣。中國、印度、日本和韓國正以不同的方式做出貢獻:中國強調自主研發,印度致力於擴大運算資源的普及,日本將人工智慧投資與產業現代化結合,韓國則著力支持硬體和設備生態系統的發展。隨著印尼、馬來西亞和越南的企業從實驗階段過渡到更穩定的營運部署,東南亞地區的成長動能也更加強勁。在政府主導的人工智慧專案和本地資料計畫的推動下,中東和非洲地區的人工智慧活動也日益活躍,這促使人們對可在雲端、私有雲和邊緣環境中運行的最佳化軟體產生了濃厚的興趣。
其他好處:
- Excel格式的市場預測(ME)表
- 3個月的分析師支持
目錄
第1章:引言
- 研究假設和市場定義
- 調查範圍
第2章:調查方法
第3章執行摘要
第4章 市場狀況
- 市場概覽
- 宏觀經濟因素對市場的影響
- 市場促進因素
- 對超低延遲定序的需求日益成長
- 擴展邊緣人工智慧和設備端智慧
- 企業增加支出以提高人工智慧運作效率
- 生成式人工智慧和基於代理的工作流程的成長
- 與硬體無關的最佳化和互通性需求
- 在引入人工智慧時,將資料主權和隱私放在首位。
- 市場限制因素
- 先進人工智慧基礎設施高成本
- 框架碎片化和整合複雜性
- 人工智慧最佳化和系統領域人才短缺
- 壓縮過程中模型精度的權衡
- 產業價值鏈分析
- 監理情勢
- 技術展望
- 波特五力分析
第5章 市場規模與成長預測
- 按解決方案類型
- 模型最佳化和壓縮軟體
- 圖編譯和核心最佳化軟體
- AI運行時和硬體加速軟體
- AI推理服務與編配軟體
- 效能分析、基準測試和可觀測工具
- 專業且託管的最佳化服務
- 按部署環境
- 雲端和超大規模資料中心
- 本地部署和私有雲端
- 邊緣基礎設施
- 設備端人工智慧
- 混合實現
- 按組織規模
- 大公司
- 小型企業
- 透過使用
- 生成式人工智慧、大規模語言模式、多模態人工智慧
- 自然語言處理和文件智慧
- 電腦視覺和影像分析
- 語音/音訊人工智慧
- 建議、搜尋和個人化引擎
- 預測分析、傳統機器學習、決策智慧
- 機器人技術、自主系統、邊緣智慧
- 其他用途
- 按地區
- 北美洲
- 美國
- 加拿大
- 墨西哥
- 歐洲
- 德國
- 英國
- 法國
- 義大利
- 其他歐洲國家
- 亞太地區
- 中國
- 日本
- 韓國
- 印度
- 東南亞
- 其他亞太國家
- 南美洲
- 中東和非洲
- 北美洲
第6章 競爭情勢
- 市場集中度
- 策略趨勢
- Market Positioning Analysis
- 公司簡介
- NVIDIA Corporation
- Advanced Micro Devices, Inc.
- Intel Corporation
- Alphabet Inc.
- Microsoft Corporation
- Amazon Web Services, Inc.
- IBM Corporation
- Oracle Corporation
- Meta Platforms, Inc.
- Qualcomm Incorporated
- Graphcore Limited
- Cerebras Systems, Inc.
- Hugging Face, Inc.
- Groq, Inc.
- Modular, Inc.
- Hailo Technologies Ltd.
- SambaNova Systems, Inc.
- Red Hat, Inc.
- Hewlett Packard Enterprise Company
- Google DeepMind
第7章 市場機會與未來展望
According to Mordor Intelligence, the AI framework optimization market size is expected to grow from USD 4.51 billion in 2025 to USD 5.83 billion in 2026 and is forecast to reach USD 18.66 billion by 2031 at 26.20% CAGR over 2026-2031.
This report is Segmented by Solution Type (Model Optimization and Compression Software, and More), Deployment Environment (On-Premises and Private Cloud, On-Device AI, and More), Organization Size (Large Enterprises, and Small and Medium Enterprises), Application (Robotics, Autonomous Systems, and Edge Intelligence, and More), and Geography. The Market Forecasts are Provided in Terms of Value (USD).
Global AI Framework Optimization Market Trends and Insights
Rising Demand for Ultra-Low Latency Inferencing
Latency is now a basic operating requirement in conversational AI, fraud detection, industrial control, robotics, and other live production systems. The AI framework optimization market is benefiting because every improvement in response time now has a direct effect on user experience, infrastructure utilization, and service consistency. This pressure is stronger in agentic systems, where a single workflow can trigger multiple model calls, retrieval steps, and tool actions before a result is returned. NVIDIA reported in February 2026 that DFlash speculative decoding on Blackwell architecture delivered throughput gains of up to 15x on specific workloads, which shows that large performance headroom still exists at the software layer. That remaining headroom keeps buyers focused on batching, caching, token scheduling, and speculative execution rather than treating inference speed as a solved problem. The AI framework optimization market therefore continues to draw spending into serving software and runtime controls that can hold latency inside production thresholds as workloads become more complex.
Growth of Generative AI And Agentic Workflows
Generative AI has moved beyond isolated pilots and now sits closer to real business processes, customer support flows, developer tools, and internal knowledge systems. The AI framework optimization market is gaining from this shift because agentic workflows multiply inference events faster than traditional single-step AI use cases. Each added reasoning pass, retrieval loop, and external tool call increases memory pressure, token throughput requirements, and the need for better execution planning. NVIDIA introduced Vera in March 2026 as a processor purpose-built for agentic AI, which signals that vendors are already redesigning systems around the heavy runtime behavior of multi-step AI workloads. The practical result is that enterprises are placing more value on orchestration layers that can manage prompts, context, model routing, and repeated execution without unacceptable delay. As agentic designs spread, the AI framework optimization market is likely to stay closely linked to serving efficiency rather than only to model innovation.
High Cost of Specialized AI Infrastructure
Optimization still depends on direct access to the hardware on which models will actually run in production. The AI framework optimization market therefore remains constrained by the cost of accelerator fleets, high-performance servers, and the supporting power and cooling capacity needed to test at scale. This burden is heavier for mid-market buyers and for regions where compute availability and data center readiness are less developed. Cloud access helps, but it can also add recurring expense and reduce direct control over benchmarking, kernel tuning, and validation cycles. The European Commission proposed the Cloud and AI Development Act in June 2026 to create an EU-wide framework for trusted cloud and AI development, which could improve access over time, but this is still a policy response rather than an immediate infrastructure fix. Until access broadens materially, the AI framework optimization market will continue to face slower adoption among organizations that want efficiency gains but cannot secure enough specialized compute to optimize effectively.
Other drivers and restraints analyzed in the detailed report include:
- Rising Enterprise Spending on AI Runtime Efficiency
- Expansion of Edge AI and On-Device Intelligence
- Framework Fragmentation and Integration Complexity
For complete list of drivers and restraints, kindly check the Table Of Contents.
Segment Analysis
AI Inference Serving and Orchestration Software held 27.11% of the AI framework optimization market share in 2025, which made it the largest solution segment. Its lead reflects the fact that optimization only creates visible business value when models can be served reliably in production with stable latency and availability. Enterprises often begin with serving and orchestration because this layer connects infrastructure decisions directly to user experience, service continuity, and operating cost. The segment also benefits from growing use of agentic workflows, where repeated model calls require stronger routing, caching, and session control than earlier AI deployments. In practical terms, this keeps the AI framework optimization market centered on software that can operationalize models at scale rather than simply improve isolated benchmark scores.
The AI framework optimization market size for Model Optimization and Compression Software is projected to expand at 27.21% CAGR through 2031, making it the fastest-growing solution segment. This growth reflects the commercial push to extract more throughput from existing compute rather than solve every deployment problem with new hardware purchases. ACL Anthology research published in 2025 showed that careful W8A8-INT quantization narrowed the reported accuracy gap versus FP8 to 0.7 points on large models, which helped validate production-grade compression pathways for larger deployments. Graph compilation, runtime acceleration, profiling, observability, and managed services remain important because each handles a different stage between model preparation and live execution. Taken together, these layers give the AI framework optimization market a broad solution mix where no single category can replace the others across all customer environments.
Cloud and Hyperscale Data Centers accounted for 54.33% of the AI framework optimization market size in 2025, which kept cloud infrastructure as the main revenue base for deployment. This position reflects the scale at which hyperscalers and large enterprises run shared inference platforms, centralized model updates, and heavy production workloads. Cloud environments also make it easier to roll out optimization changes once and distribute the benefit across many users, teams, and services. For organizations moving from pilot work into sustained production, that operational simplicity remains a strong advantage. As a result, the AI framework optimization market continues to send a large share of spending toward cloud-native serving, scheduling, and observability tools.
The AI framework optimization market size for On-Device AI is projected to expand at 27.62% CAGR through 2031, the fastest rate among deployment environments. Local execution is gaining because privacy requirements, weak connectivity, and strict response-time targets make many workloads difficult to support through cloud-only inference. NVIDIA introduced TensorRT Edge-LLM in 2026 for embedded automotive and robotics inference, which highlights the rise of device-specific optimization stacks. On-premises, edge infrastructure, and hybrid models are also becoming more relevant because many organizations now split workloads across public and private environments instead of relying on a single runtime. This diversification means the AI framework optimization market increasingly rewards vendors that can manage portability, governance, and performance across several deployment paths at once.
Complete Report Scope:
- By Solution Type
- Model Optimization and Compression Software
- Graph Compilation and Kernel Optimization Software
- AI Runtime and Hardware Acceleration Software
- AI Inference Serving and Orchestration Software
- Performance Profiling, Benchmarking, and Observability Tools
- Professional and Managed Optimization Services
- By Deployment Environment
- Cloud and Hyperscale Data Centers
- On-Premises and Private Cloud
- Edge Infrastructure
- On-Device AI
- Hybrid Deployment
- By Organization Size
- Large Enterprises
- Small and Medium Enterprises
- By Application
- Generative AI, Large Language Models, and Multimodal AI
- Natural Language Processing and Document Intelligence
- Computer Vision and Video Analytics
- Speech and Audio AI
- Recommendation, Search, and Personalization Engines
- Predictive Analytics, Classical ML, and Decision Intelligence
- Robotics, Autonomous Systems, and Edge Intelligence
- Other Applications
- By Geography
- North America
- United States
- Canada
- Mexico
- Europe
- Germany
- United Kingdom
- France
- Italy
- Rest of Europe
- Asia-Pacific
- China
- Japan
- South Korea
- India
- Southeast Asia
- Rest of Asia-Pacific
- South America
- Middle East and Africa
- North America
Geography Analysis
North America accounted for 48.44% of the AI framework optimization market size in 2025, which kept the region in the lead on revenue. The United States anchors this position through hyperscale cloud capacity, a dense vendor ecosystem, and a steady pace of product launches across inference software and AI hardware. Canada adds regional depth through its research base and commercialization networks, which help move model work into deployable runtime and serving tools. South America remains smaller, but interest is rising where enterprises are expanding digital infrastructure and looking for lower-cost ways to support local AI execution.
Europe remains a major region in the AI framework optimization market because regulation now shapes deployment design as much as performance does. The EU AI Act, which became fully applicable from August 2, 2026, increases the value of auditable optimization workflows for high-risk systems. Germany, the United Kingdom, and France form the main demand centers through manufacturing, financial services, healthcare, and public-sector use cases that require reliable inference behavior. The European Commission's June 2026 proposal for the Cloud and AI Development Act also points to stronger sovereign compute frameworks, which can support on-premises and hybrid stack adoption across Europe and influence buyer priorities in nearby regulated markets.
Asia-Pacific is projected to expand at 27.42% CAGR through 2031, making it the fastest-growing regional block in the AI framework optimization market. Growth in the region is supported by government-backed AI infrastructure plans, very large device manufacturing bases, and stronger interest in domestic software ecosystems. China, India, Japan, and South Korea each contribute in different ways, with China emphasizing self-reliance, India widening access to compute, Japan linking AI investment to industrial modernization, and South Korea supporting hardware and device ecosystems. Southeast Asia adds momentum because enterprises in Indonesia, Malaysia, and Vietnam are moving from experimentation toward more stable operational deployment. Middle East and Africa also show rising activity as sovereign AI programs and local data initiatives increase interest in optimization software that can work across cloud, private, and edge environments.
- NVIDIA Corporation
- Advanced Micro Devices, Inc.
- Intel Corporation
- Alphabet Inc.
- Microsoft Corporation
- Amazon Web Services, Inc.
- IBM Corporation
- Oracle Corporation
- Meta Platforms, Inc.
- Qualcomm Incorporated
- Graphcore Limited
- Cerebras Systems, Inc.
- Hugging Face, Inc.
- Groq, Inc.
- Modular, Inc.
- Hailo Technologies Ltd.
- SambaNova Systems, Inc.
- Red Hat, Inc.
- Hewlett Packard Enterprise Company
- Google DeepMind
Additional Benefits:
- The market estimate (ME) sheet in Excel format
- 3 months of analyst support
TABLE OF CONTENTS
1 INTRODUCTION
- 1.1 Study Assumptions and Market Definition
- 1.2 Scope of the Study
2 RESEARCH METHODOLOGY
3 EXECUTIVE SUMMARY
4 MARKET LANDSCAPE
- 4.1 Market Overview
- 4.2 Impact of Macroeconomic Factors on the Market
- 4.3 Market Drivers
- 4.3.1 Rising Demand for Ultra-Low Latency Inferencing
- 4.3.2 Expansion of Edge AI and On-Device Intelligence
- 4.3.3 Rising Enterprise Spending on AI Runtime Efficiency
- 4.3.4 Growth of Generative AI and Agentic Workflows
- 4.3.5 Hardware-Agnostic Optimization and Interoperability Needs
- 4.3.6 Data Sovereignty and Privacy-First AI Deployment
- 4.4 Market Restraints
- 4.4.1 High Cost of Specialized AI Infrastructure
- 4.4.2 Framework Fragmentation and Integration Complexity
- 4.4.3 Shortage of AI Optimization and Systems Talent
- 4.4.4 Model Accuracy Trade-Offs During Compression
- 4.5 Industry Value Chain Analysis
- 4.6 Regulatory Landscape
- 4.7 Technological Outlook
- 4.8 Porter's Five Forces Analysis
- 4.8.1 Bargaining Power of Suppliers
- 4.8.2 Bargaining Power of Buyers
- 4.8.3 Threat of New Entrants
- 4.8.4 Threat of Substitutes
- 4.8.5 Intensity of Competitive Rivalry
5 MARKET SIZE AND GROWTH FORECASTS (VALUE)
- 5.1 By Solution Type
- 5.1.1 Model Optimization and Compression Software
- 5.1.2 Graph Compilation and Kernel Optimization Software
- 5.1.3 AI Runtime and Hardware Acceleration Software
- 5.1.4 AI Inference Serving and Orchestration Software
- 5.1.5 Performance Profiling, Benchmarking, and Observability Tools
- 5.1.6 Professional and Managed Optimization Services
- 5.2 By Deployment Environment
- 5.2.1 Cloud and Hyperscale Data Centers
- 5.2.2 On-Premises and Private Cloud
- 5.2.3 Edge Infrastructure
- 5.2.4 On-Device AI
- 5.2.5 Hybrid Deployment
- 5.3 By Organization Size
- 5.3.1 Large Enterprises
- 5.3.2 Small and Medium Enterprises
- 5.4 By Application
- 5.4.1 Generative AI, Large Language Models, and Multimodal AI
- 5.4.2 Natural Language Processing and Document Intelligence
- 5.4.3 Computer Vision and Video Analytics
- 5.4.4 Speech and Audio AI
- 5.4.5 Recommendation, Search, and Personalization Engines
- 5.4.6 Predictive Analytics, Classical ML, and Decision Intelligence
- 5.4.7 Robotics, Autonomous Systems, and Edge Intelligence
- 5.4.8 Other Applications
- 5.5 By Geography
- 5.5.1 North America
- 5.5.1.1 United States
- 5.5.1.2 Canada
- 5.5.1.3 Mexico
- 5.5.2 Europe
- 5.5.2.1 Germany
- 5.5.2.2 United Kingdom
- 5.5.2.3 France
- 5.5.2.4 Italy
- 5.5.2.5 Rest of Europe
- 5.5.3 Asia-Pacific
- 5.5.3.1 China
- 5.5.3.2 Japan
- 5.5.3.3 South Korea
- 5.5.3.4 India
- 5.5.3.5 Southeast Asia
- 5.5.3.6 Rest of Asia-Pacific
- 5.5.4 South America
- 5.5.5 Middle East and Africa
- 5.5.1 North America
6 COMPETITIVE LANDSCAPE
- 6.1 Market Concentration
- 6.2 Strategic Moves
- 6.3 Market Positioning Analysis
- 6.4 Company Profiles (includes Global Level Overview, Market Level Overview, Core Segments, Financials as available, Strategic Information, Market Rank/Share, Products and Services, Recent Developments)
- 6.4.1 NVIDIA Corporation
- 6.4.2 Advanced Micro Devices, Inc.
- 6.4.3 Intel Corporation
- 6.4.4 Alphabet Inc.
- 6.4.5 Microsoft Corporation
- 6.4.6 Amazon Web Services, Inc.
- 6.4.7 IBM Corporation
- 6.4.8 Oracle Corporation
- 6.4.9 Meta Platforms, Inc.
- 6.4.10 Qualcomm Incorporated
- 6.4.11 Graphcore Limited
- 6.4.12 Cerebras Systems, Inc.
- 6.4.13 Hugging Face, Inc.
- 6.4.14 Groq, Inc.
- 6.4.15 Modular, Inc.
- 6.4.16 Hailo Technologies Ltd.
- 6.4.17 SambaNova Systems, Inc.
- 6.4.18 Red Hat, Inc.
- 6.4.19 Hewlett Packard Enterprise Company
- 6.4.20 Google DeepMind
7 MARKET OPPORTUNITIES AND FUTURE OUTLOOK
- 7.1 White-Space and Unmet-Need Assessment

 人工智慧程式碼助理軟體市場:全球市場預測,2026-2032年
 2026年全球人工智慧(AI)代碼工具市場報告2026年貝葉斯最佳化工具全球市場報告
 AI編碼助理市場:按產品、功能、部署、模型類型、程式語言、價格範圍、組織規模和最終用戶產業分類-市場規模、產業動態、機會分析和預測(2026-2035)
 綠色 DevOps 和碳意識 CI/CD 軟體:市場佔有率分析、行業趨勢和統計數據以及成長預測(2026-2031 年)AI代碼工具:市場佔有率分析、產業趨勢與統計、成長預測(2026-2031年)
 人工智慧驅動的軟體開發和編碼自動化市場預測至2034年:按交付、營運、部署、技術、應用、最終用戶和地區分類的全球分析AI程式碼產生和開發者支援工具:市場佔有率分析、產業趨勢和統計數據以及成長預測(2026-2031年)人工智慧程式碼開發工具市場預測至2034年:按交付方式、營運、部署方式、技術、應用、最終用戶和地區分類的全球分析
 AI代碼助理市場規模、佔有率和趨勢分析報告:按組件、部署模式、應用、最終用戶、地區和細分市場預測(2026-2033年)