


 |
市場調查報告書
商品編碼
2099265
GPU 電源基礎設施:市場佔有率分析、產業趨勢與統計、成長預測(2026-2031 年)GPU Power Infrastructure - Market Share Analysis, Industry Trends & Statistics, Growth Forecasts (2026 - 2031) |
||||||

※ 本網頁內容可能與最新版本有所差異。詳細情況請與我們聯繫。
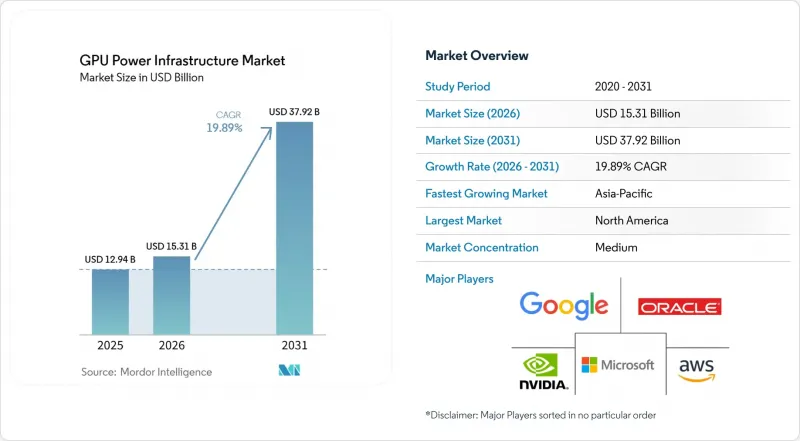
根據 Mordor Intelligence 預測,GPU 電源基礎設施市場預計將從 2025 年的 129.4 億美元成長到 2026 年的 153.1 億美元,到 2031 年達到 379.2 億美元,2026 年至 2031 年的複合年成長率預計為 19.89%。
本報告按組件(解決方案和服務)、電源架構(機架級電源、柱/艙級電源、基礎設施級電源)、配電拓撲結構(集中式等)、資料中心類型(超大規模資料中心、託管資料中心、企業級資料中心、邊緣資料中心)和地區進行細分。市場預測以美元(USD)為單位。
全球GPU供電基礎設施市場趨勢與洞察
人工智慧集群日益成長的功率密度正在推動基礎設施的重新設計。
由於近幾代GPU機架功率密度的大幅提升,GPU電源基礎設施市場呈現擴張跡象。這是因為系統級功率密度的成長速度遠超過晶片熱設計功耗(TDP)的成長速度。 NVIDIA表示,其Vera Rubin VR200 NVL72機架級系統每個機架的功耗為190-230千瓦。這遠遠超過了Hopper系列GPU的功耗水平,也顯著高於傳統資料中心配電室的設計標準。這種轉變使得GPU電源基礎設施市場不再只是一個採購類別,而是影響專案進度的關鍵因素,因為電源供應如今決定著大規模AI叢集能否按計畫運作。預計在下一個平台週期中,這種壓力仍將持續,因為Rubin Ultra Kyber的機架功率密度為600千瓦,而後續平台正朝著1兆瓦級機架設計邁進。傳統的54伏特直流配電系統無法在不增加銅線用量、增加電纜體積和降低電阻損耗的情況下滿足如此高的功率密度。換句話說,即使是新建的機房,也需要重新設計電源架構,而不是簡單地擴展現有佈局。因此,GPU電源基礎設施市場不僅受益於伺服器數量的成長,也受益於每個投入運作的高密度機架的電源基礎設施支出結構性成長。
向高壓機架級電源架構過渡
GPU電源基礎設施市場也受惠於800VDC高壓直流設計的轉變。這種設計省去了之前限制端到端效率的多個轉換階段。據NVIDIA稱,800VDC線規的載流能力比同等規格的415VAC線規高出157%,從而降低了導體重量、電纜擁塞以及高密度AI部署環境中的轉換損耗。因此,隨著集中式整流器、支援800VDC的母線槽、保護系統和機架級DC-DC轉換器成為電氣堆疊中價值更高的組件,GPU電源基礎設施市場正在多個層面擴展。 Vertiv於2025年10月將其800VDC平台從概念階段推進到工程就緒階段,併計劃於2026年下半年進行商業發布,使供應商藍圖與NVIDIA的「Rubin Ultra」週期保持一致。此外,開放計算專案基金會(OCPF)於2025年推出了“電源分配專案”,旨在為800VDC系統制定電壓、連接器和安全標準。這將降低大規模部署的不確定性。隨著標準制定和產品供應的同步推進,GPU電源基礎設施市場的發展路徑將更加清晰,從早期採用到在超大規模資料中心和託管機房進行大規模部署。
高昂的初始投資限制了非超大規模業者的進入。
GPU電源基礎設施市場在企業營運商和中型託管服務供應商中面臨明顯的普及瓶頸。這是因為高密度GPU機房所需的電力投資遠高於傳統伺服器環境。向800VDC架構的過渡通常涉及引入新的集中式整流器、專用母線槽、冗餘電池系統和保護裝置,而這些設備難以納入傳統的升級週期。 NVIDIA指出,隨著部署從目前的GB200級系統轉向Vera Rubin CPX級系統,每個AI伺服器機架的電源基礎設施價值可能會增加1000%以上,從而大幅提高准入門檻。實際上,這意味著僅一個1MW的GPU機房所需的電力相關成本就相當於先前支援大規模的傳統設施的成本,這阻礙了頂級雲端服務供應商之外的其他雲端服務供應商進入該領域。此外,符合IEC 61439和UL 857等標準需要額外的設計和測試工作,這進一步有利於擁有更強大技術團隊的供應商和買家。因此,儘管 GPU 電源基礎設施市場需求強勁,但部分需求仍集中,因為許多潛在買家負擔不起新電源堆疊的初始部署成本。
細分市場分析
至2025年,解決方案領域將佔GPU電源基礎設施市場的83.19%。這反映出,在設施建設和擴建階段,大部分初始投資仍用於UPS陣列、變壓器、開關設備、PDU、集中式整流器及相關硬體。 GPU電源基礎設施市場的這一細分領域之所以保持主導地位,是因為隨著每一代GPU的重大更新,營運商都必須對其大部分電源設備進行升級,而不僅僅是在原有系統上增加負載。在這種情況下,設備採購仍然是首要且最大的資本投資決策,尤其是在超大規模園區中,電氣室的設計旨在適應跨多個機房的分階段擴容。此外,轉換階段的日益集中化和機架密度的不斷提高意味著設施級電源架構在技術複雜性方面佔據了更大的比重,這也支撐了解決方案市場的發展。這導致硬體合約規模龐大、分階段進行,並且與設施試運行計劃緊密相關。
預計2026年至2031年間,GPU電源基礎設施服務市場將以20.57%的複合年成長率成長。儘管基數較小,但預計它將成為GPU電源基礎設施市場中成長最快的細分領域。由於許多企業內部團隊的建構專注於傳統的資料中心運營,而非人工智慧驅動的運營,營運商越來越需要試運行、動態電源管理、數位孿生利用和高密度負載平衡方面的支援。 Vertiv在2026年3月發布的Vera Rubin DSX產品中重點介紹了其4000多名現場服務工程師,這表明強大的服務能力(除產品外)正成為直接的賣點。這種轉變表明,GPU電源基礎設施產業正在向生命週期模式轉型,買家不僅越來越重視設備本身,也越來越重視成熟的部署支援和持續的維運調優。此外,擁有強大現場團隊的供應商可以深化與客戶的關係,超越硬體交付的範疇,從而在整個預測期內拓展收入來源。
在2025年的GPU電源基礎設施市場中,基礎架構層電源將佔46.53%的市場佔有率,目前的部署情況表明,設施邊緣系統仍然佔據最大的價值佔有率。這一層包括中壓開關設備、主配電盤、設施級UPS系統、發電機以及支撐整個電氣設計的核心轉換資產。 GPU電源基礎設施市場之所以如此重視這種架構,是因為人工智慧資料中心必須先建立可靠的上游電源基礎,才能將價值進一步轉移到低層和機架層。向800VDC的過渡進一步鞏固了這一地位,因為它將更多的轉換和控制職責轉移到了集中式整流器和母線槽連接的配電系統。因此,基礎架構層電源仍然是一個關鍵的設計點,也是一個故障可能影響整個園區(而不僅僅是有限的機架組)的主要區域。
預計2026年至2031年間,機架級電源市場將以20.78%的複合年成長率成長,這表明即使在高密度GPU叢集的消耗點,價值創造也在快速成長。 NVIDIA的Kyber機架架構透過高比例64:1 LLC轉換器為每個運算節點分配高電壓,將機架介面從日常組件選擇提升為一項重要的工程規格。這種轉變正在擴大GPU電源基礎設施市場,實現智慧機架級電源調節、機架內緩衝以及上游電源系統和運算節點之間的緊密協調控制。伊頓於2026年3月發布的Beam Rubin DSX平台定位為端到端的電網到晶片電源生態系統,體現了供應商如何滿足跨所有電氣層進行協調設計的需求。因此,基礎設施級資產的重要性並未降低,而是呈現更廣泛的架構競爭,與傳統伺服器環境相比,設施邊緣和機架邊緣都能創造更大的價值。
區域分析
到2025年,北美將佔據GPU電力基礎設施市場43.91%的佔有率,成為目前收入最高的區域中心。該地區受益於高度集中的超大規模園區、強大的GPU雲端服務供應商以及以人工智慧基礎設施為中心的大規模資本投資項目。 CoreWeave報告稱,2026年第一季將確認超過1吉瓦的運作電力和超過3.5吉瓦的簽約電力,這印證了該地區當前擴張壓力之大。北美也面臨著與過去十年相同的情況:電網延遲激增,改革措施仍在實施,這增加了對錶後支援系統的需求。這些因素共同推動了GPU電力基礎設施市場的蓬勃發展,不僅體現在園區層級的擴張,也體現在站點層面的投資,例如冗餘、電力調節和分階段供電。
隨著人工智慧資料中心的擴張與能源政策、能源效率法規和國家數位化策略的聯繫日益緊密,歐洲仍然是GPU電力基礎設施市場的重要參與者。德國處於這一區域格局的核心。 2026年3月,德國聯邦政府通過了一項資料中心策略,旨在到2030年將資料中心總容量加倍,並將專用人工智慧容量翻兩番。在德國,資料中心的電力消耗量從2024年的20太瓦時(TWh)增加到2025年的21.3太瓦時(TWh),這表明即使在下一波人工智慧專案完全建成之前,電力負載就已經在成長。從2027年起,德國將強制要求新建資料中心使用可再生能源,將進一步增加基礎設施規劃的複雜性。這要求營運商調整容量擴張計劃,以適應電力供應狀況和合規要求。雖然這些因素有利於歐洲GPU電力基礎設施市場的發展,但也意味著與其他地區相比,歐洲的專案進度和設計選擇更容易受到電力籌資策略的影響。
預計到2031年,亞太地區將以21.46%的複合年成長率成長,成為GPU電力基礎設施市場成長最快的區域市場。這一成長主要得益於政府主導的人工智慧專案、超大規模資料中心業者資料中心的擴張以及大型資料中心市場機架功率密度的快速提升。 2026年4月,NTT宣布計畫在2033會計年度將其IT電力容量從300兆瓦擴展至1吉瓦。此外,位於印西和白井的全新人工智慧園區正在建設中,目標是實現250兆瓦的總合IT容量。 Equinix也於2025年9月在清奈開設了其首個人工智慧資料中心。該資料中心初始投資6,900萬美元,採用水冷基礎設施處理高密度GPU工作負載。儘管南美洲、中東和非洲在 GPU 電源基礎設施市場仍處於早期階段,但最近的框架協議和早期園區投資表明,人工智慧賦能的電源容量正開始擴展到已建立的關鍵區域之外。
其他好處:
- Excel格式的市場預測(ME)表
- 3個月的分析師支持
目錄
第1章:引言
- 研究假設和市場定義
- 調查範圍
第2章:調查方法
第3章執行摘要
第4章 市場狀況
- 市場概覽
- 市場促進因素
- 提高GPU訓練大廳中AI集群的功率密度
- 向高壓機架級電源架構過渡
- 為高速運算而建構的超大規模和託管容量的擴展
- 現有設施維修中對模組化、可快速部署的電源模組的需求。
- 電網連接限制正在加速對現場電力調節的需求。
- 電源可靠性方面的風險日益增加,促使人們增加對多層冗餘的投資。
- 市場限制因素
- 高密度電氣室和備用架構的初始成本很高
- 開關設備、變壓器和大容量UPS系統的交貨週期越來越長。
- 招募技術嫻熟的試運行和電力整合工人很困難。
- 現有設施的熱力和空間限制限制了GPU的增加。
- 產業價值鏈分析
- 技術展望
- 宏觀經濟因素對市場的影響
- 波特五力分析
第5章 市場規模與成長預測
- 按組件
- 解決方案
- 服務
- 電源架構
- 機架級電源
- 行/艙級功耗
- 基礎設施級電力
- 按配電拓樸結構
- 集中
- 去中心化
- 依資料中心類型
- 超大規模資料中心
- 託管資料中心
- 企業資料中心
- 邊緣資料中心
- 按地區
- 北美洲
- 美國
- 加拿大
- 墨西哥
- 歐洲
- 德國
- 英國
- 法國
- 義大利
- 其他歐洲國家
- 亞太地區
- 中國
- 日本
- 韓國
- 印度
- 東南亞
- 其他亞太國家
- 南美洲
- 中東和非洲
- 北美洲
第6章 競爭情勢
- 市場集中度
- 策略趨勢
- Vendor Positioning Analysis
- 公司簡介
- NVIDIA Corporation
- Amazon Web Services, Inc.
- Microsoft Corporation
- Google LLC
- Oracle Corporation
- Advanced Micro Devices, Inc.
- Intel Corporation
- Dell Technologies Inc.
- Hewlett Packard Enterprise Development LP
- Super Micro Computer, Inc.
- Lenovo Group Limited
- CoreWeave, Inc.
- Lambda Labs, Inc.
- Alibaba Cloud
- Equinix, Inc.
- Digital Realty Trust, Inc.
- Vertiv Group Corp.
- Schneider Electric SE
第7章 市場機會與未來展望
According to Mordor Intelligence, the GPU power infrastructure market size is expected to increase from USD 12.94 billion in 2025 to USD 15.31 billion in 2026 and reach USD 37.92 billion by 2031, growing at a CAGR of 19.89% over 2026-2031.
This report is Segmented by Component (Solution, and Services), Power Architecture (Rack-Level Power, Row/Pod-Level Power, and Infrastructure-Level Power), Power Distribution Topology (Centralized, and More), Data Center Type (Hyperscale Data Centers, Colocation Data Centers, Enterprise Data Centers, and Edge Data Centers), and Geography. The Market Forecasts are Provided in Terms of Value (USD).
Global GPU Power Infrastructure Market Trends and Insights
Rising AI Cluster Power Density Drives Infrastructure Redesign
The GPU power infrastructure market is being pushed upward by the jump in rack power density between recent GPU generations, because the system-level increase has been much sharper than the rise in chip thermal design power alone. NVIDIA stated that its Vera Rubin VR200 NVL72 rack-scale systems draw 190-230 kW per rack, which is far above levels seen in the Hopper generation and well beyond the design point of older data center electrical rooms. That shift has changed the GPU power infrastructure market from a procurement category into a gating factor for project timing, because power delivery now determines whether large AI clusters can be energized on schedule. The next platform cycle keeps this pressure high, since Rubin Ultra Kyber has been specified at 600 kW per rack, and later platforms are moving toward 1 MW-class rack designs. Traditional 54 VDC distribution cannot support these densities without severe penalties in copper volume, cable bulk, and resistive losses, meaning even new facilities must redesign their electrical architecture rather than extend older layouts. The GPU power infrastructure market is therefore benefiting not only from higher server counts, but also from a structural increase in power infrastructure spend for every high-density rack that enters service.
Shift Toward High-Voltage Rack-Level Power Architectures
The GPU power infrastructure market is also being boosted by the shift toward 800 VDC high-voltage direct current designs, which eliminate several conversion stages that previously limited end-to-end efficiency. NVIDIA stated that an 800 VDC wire gauge can carry 157% more power than a 415 VAC equivalent, thereby reducing conductor weight, cable congestion, and conversion losses across dense AI deployments. This is expanding the GPU power infrastructure market across multiple layers, as centralized rectifiers, 800 VDC-rated busways, protection systems, and rack-level DC-DC conversion become higher-value parts of the electrical stack. Vertiv moved its 800 VDC platform from concept to engineering readiness in October 2025 and planned a commercial release in the second half of 2026, aligning vendor roadmaps with NVIDIA's Rubin Ultra cycle. The Open Compute Project Foundation also launched its Power Distribution Project in 2025 to define voltage, connector, and safety standards for 800 VDC systems, which reduces uncertainty around broad deployment. As standards and product availability move forward together, the GPU power infrastructure market gains a clearer path from early adoption to scaled rollouts across hyperscale and colocation facilities.
High Upfront Capital Intensity Limits Participation Among Non-Hyperscale Operators
The GPU power infrastructure market faces a clear adoption limit among enterprise operators and mid-tier colocation providers because high-density GPU halls require a much heavier electrical investment than traditional server environments. The move toward 800 VDC architectures often means new centralized rectifiers, specialized busways, redundant battery systems, and protection equipment that do not fit easily into legacy upgrade cycles. NVIDIA indicated that the value of power infrastructure per AI server rack could rise by more than 1,000% as deployments shift from current GB200-class systems to Vera Rubin CPX-class systems, sharply raising the capital threshold for participation. In practice, that means a single 1 MW GPU hall can demand the kind of electrical spending that previously supported a much larger conventional footprint, which slows entry by non-top-tier cloud operators. Compliance with standards such as IEC 61439 and UL 857 adds more engineering and testing work, which further favors suppliers and buyers with deeper technical teams. The GPU power infrastructure market, therefore, has strong demand momentum, yet part of that demand stays concentrated because many potential buyers cannot absorb the upfront replacement cost of the new power stack.
Other drivers and restraints analyzed in the detailed report include:
- Hyperscale And Colocation Expansion Creates Structural Demand For GPU-Optimized Power
- Modular Rapid-Deploy Power Blocks Address Brownfield Retrofit Constraints
- Electrical Equipment Supply Chain Bottlenecks Constrain Deployment Timelines
For complete list of drivers and restraints, kindly check the Table Of Contents.
Segment Analysis
Solutions held an 83.19% share of the GPU power infrastructure market in 2025, reflecting how much of the initial spending still goes toward UPS arrays, transformers, switchgear, PDUs, centralized rectifiers, and related hardware during facility buildout. This part of the GPU power infrastructure market remains dominant because each major GPU generation forces operators to refresh large sections of the electrical stack rather than bolt on higher loads to older systems. In that environment, equipment procurement remains the first and largest capital decision, especially for hyperscale campuses where the electrical room is designed for staged expansion across multiple halls. The solutions base is also supported by the fact that facility-level power architecture now captures a larger share of technical complexity as conversion stages are centralized and rack densities rise. That keeps hardware contracts large, multi-phase, and closely tied to site commissioning schedules.
Services are projected to grow at a 20.57% CAGR from 2026 to 2031, making them the fastest-growing component of the GPU power infrastructure market, even though they start from a smaller base. Operators increasingly need support with commissioning, dynamic power management, digital twin use, and high-density load balancing, as many internal teams were built for conventional data center operations rather than AI-powered behavior. Vertiv highlighted its 4,000-plus field service engineers in its March 2026 Vera Rubin DSX announcement, which shows how service capacity is becoming a direct selling point beside product depth. This shift suggests that the GPU power infrastructure industry is moving toward a lifecycle model, where buyers increasingly value validated deployment support and ongoing operational tuning along with the equipment itself. It also means vendors with strong field organizations can deepen customer relationships after hardware delivery and widen their revenue mix over the forecast period.
Infrastructure-level power accounted for 46.53% of the GPU power infrastructure market in 2025, indicating that facility-edge systems still account for the largest share of value in current deployments. This layer includes medium-voltage switchgear, main distribution boards, facility-level UPS systems, generators, and the core conversion assets that anchor the entire electrical design. The GPU power infrastructure market has favored this architecture because every AI-ready data center must establish a reliable upstream power foundation before value can shift deeper into row or rack layers. The move toward 800 VDC reinforces that position by transferring more conversion and control responsibility into centralized rectifiers and busway-linked distribution systems. As a result, infrastructure-level power remains the primary design point and the main area where failure would affect the entire campus rather than a limited rack group.
Rack-level power is projected to grow at a 20.78% CAGR from 2026 to 2031, indicating how quickly value is also being built at the point of consumption within dense GPU clusters. NVIDIA's Kyber rack architecture distributes high voltage to each compute node via a high-ratio 64:1 LLC converter, elevating the rack interface to a major engineering specification rather than a routine component choice. That change expands the GPU power infrastructure market for intelligent rack-level conditioning, in-rack buffering, and tightly coordinated control between upstream power systems and compute nodes. Eaton's Beam Rubin DSX platform, introduced in March 2026, was framed as an end-to-end grid-to-chip power ecosystem, which reflects how vendors are responding to the need for coordinated design across all electrical layers. The practical outcome is not a loss of relevance for infrastructure-level assets, but a broader architecture contest in which both the facility edge and the rack edge capture more value than they did in conventional server environments.
Complete Report Scope:
- By Component
- Solution
- Services
- By Power Architecture
- Rack-Level Power
- Row/Pod-Level Power
- Infrastructure-Level Power
- By Power Distribution Topology
- Centralized
- Distributed
- By Data Center Type
- Hyperscale Data Centers
- Colocation Data Centers
- Enterprise Data Centers
- Edge Data Centers
- By Geography
- North America
- United States
- Canada
- Mexico
- Europe
- Germany
- United Kingdom
- France
- Italy
- Rest of Europe
- Asia-Pacific
- China
- Japan
- South Korea
- India
- Southeast Asia
- Rest of Asia-Pacific
- South America
- Middle East and Africa
- North America
Geography Analysis
North America held a 43.91% share of the GPU power infrastructure market in 2025, making it the largest regional base for current revenue. The region benefits from a dense cluster of hyperscale campuses, a strong presence of GPU cloud operators, and very large capital deployment programs centered on AI infrastructure. CoreWeave reported more than 1 GW of active power in the first quarter of 2026 and more than 3.5 GW of contracted power, underscoring the scale of current expansion pressure in the region. North America also faces the same conditions that are increasing demand for behind-the-meter support systems, as interconnection queue wait times have risen sharply over the past decade, and reform measures are still being implemented. That combination keeps the GPU power infrastructure market active across both campus-level buildouts and site-level investments in redundancy, power conditioning, and staged energization.
Europe remains an important part of the GPU power infrastructure market because AI-capable data center expansion is now more closely linked to energy policy, efficiency rules, and national digital strategies. Germany is central to this regional picture, since the federal government adopted its data center strategy in March 2026 with a target to double general data center capacity and quadruple AI-specific capacity by 2030. The same country recorded data center electricity consumption rising from 20 TWh in 2024 to 21.3 TWh in 2025, which points to a growing power burden even before the next wave of AI projects is fully built out. Germany's requirement for new data centers to source energy from renewables from 2027 adds another layer of infrastructure planning, because operators must align capacity growth with both power availability and compliance needs. These conditions support the GPU power infrastructure market in Europe, but they also make project timing and design choices more dependent on power sourcing strategy than in some other regions.
Asia-Pacific is projected to grow at a 21.46% CAGR through 2031, which makes it the fastest-growing regional segment in the GPU power infrastructure market. The region is being driven by sovereign AI programs, hyperscaler expansion, and a fast rise in per-rack power density across large data center markets. NTT stated in April 2026 that it plans to expand IT power capacity from 300 MW to 1 GW by fiscal year 2033, with its new AI-focused campus in Inzai and Shiroi targeting 250 MW of total IT capacity. Equinix also opened its first AI-ready data center in Chennai in September 2025 with an initial investment of USD 69 million and liquid-cooling-ready infrastructure for high-density GPU workloads. South America and the Middle East and Africa remain earlier-stage markets in the GPU power infrastructure market, but recent framework agreements and early campus investments show that AI-ready electrical capacity is beginning to extend beyond the largest established regions.
- NVIDIA Corporation
- Amazon Web Services, Inc.
- Microsoft Corporation
- Google LLC
- Oracle Corporation
- Advanced Micro Devices, Inc.
- Intel Corporation
- Dell Technologies Inc.
- Hewlett Packard Enterprise Development LP
- Super Micro Computer, Inc.
- Lenovo Group Limited
- CoreWeave, Inc.
- Lambda Labs, Inc.
- Alibaba Cloud
- Equinix, Inc.
- Digital Realty Trust, Inc.
- Vertiv Group Corp.
- Schneider Electric SE
Additional Benefits:
- The market estimate (ME) sheet in Excel format
- 3 months of analyst support
TABLE OF CONTENTS
1 INTRODUCTION
- 1.1 Study Assumptions and Market Definition
- 1.2 Scope of the Study
2 RESEARCH METHODOLOGY
3 EXECUTIVE SUMMARY
4 MARKET LANDSCAPE
- 4.1 Market Overview
- 4.2 Market Drivers
- 4.2.1 Rising AI Cluster Power Density in GPU Training Halls
- 4.2.2 Shift Toward High-Voltage Rack-Level Power Architectures
- 4.2.3 Expansion of Hyperscale and Colocation Capacity Built for Accelerated Computing
- 4.2.4 Demand for Modular, Rapid-Deploy Power Blocks in Brownfield Retrofits
- 4.2.5 Grid Interconnection Constraints Accelerating On-Site Power Conditioning Demand
- 4.2.6 Utility Reliability Risk Increasing Multi-Layer Redundancy Investments
- 4.3 Market Restraints
- 4.3.1 High Upfront Cost of High-Density Electrical Rooms and Backup Architecture
- 4.3.2 Long Lead Times for Switchgear, Transformers, and High-Capacity UPS Systems
- 4.3.3 Limited Availability of Skilled Commissioning and Power-Integration Labor
- 4.3.4 Thermal and Spatial Constraints in Existing Facilities Restricting GPU Retrofit Scale-Up
- 4.4 Industry Value Chain Analysis
- 4.5 Technological Outlook
- 4.6 Impact of Macroeconomic Factors on the Market
- 4.7 Porter's Five Forces Analysis
- 4.7.1 Bargaining Power of Suppliers
- 4.7.2 Bargaining Power of Buyers
- 4.7.3 Threat of New Entrants
- 4.7.4 Threat of Substitutes
- 4.7.5 Industry Rivalry
5 MARKET SIZE AND GROWTH FORECASTS (VALUE)
- 5.1 By Component
- 5.1.1 Solution
- 5.1.2 Services
- 5.2 By Power Architecture
- 5.2.1 Rack-Level Power
- 5.2.2 Row/Pod-Level Power
- 5.2.3 Infrastructure-Level Power
- 5.3 By Power Distribution Topology
- 5.3.1 Centralized
- 5.3.2 Distributed
- 5.4 By Data Center Type
- 5.4.1 Hyperscale Data Centers
- 5.4.2 Colocation Data Centers
- 5.4.3 Enterprise Data Centers
- 5.4.4 Edge Data Centers
- 5.5 By Geography
- 5.5.1 North America
- 5.5.1.1 United States
- 5.5.1.2 Canada
- 5.5.1.3 Mexico
- 5.5.2 Europe
- 5.5.2.1 Germany
- 5.5.2.2 United Kingdom
- 5.5.2.3 France
- 5.5.2.4 Italy
- 5.5.2.5 Rest of Europe
- 5.5.3 Asia-Pacific
- 5.5.3.1 China
- 5.5.3.2 Japan
- 5.5.3.3 South Korea
- 5.5.3.4 India
- 5.5.3.5 Southeast Asia
- 5.5.3.6 Rest of Asia-Pacific
- 5.5.4 South America
- 5.5.5 Middle East and Africa
- 5.5.1 North America
6 COMPETITIVE LANDSCAPE
- 6.1 Market Concentration
- 6.2 Strategic Moves
- 6.3 Vendor Positioning Analysis
- 6.4 Company Profiles (includes Global Level Overview, Market Level Overview, Core Segments, Financials as available, Strategic Information, Market Rank/Share, Products and Services, Recent Developments)
- 6.4.1 NVIDIA Corporation
- 6.4.2 Amazon Web Services, Inc.
- 6.4.3 Microsoft Corporation
- 6.4.4 Google LLC
- 6.4.5 Oracle Corporation
- 6.4.6 Advanced Micro Devices, Inc.
- 6.4.7 Intel Corporation
- 6.4.8 Dell Technologies Inc.
- 6.4.9 Hewlett Packard Enterprise Development LP
- 6.4.10 Super Micro Computer, Inc.
- 6.4.11 Lenovo Group Limited
- 6.4.12 CoreWeave, Inc.
- 6.4.13 Lambda Labs, Inc.
- 6.4.14 Alibaba Cloud
- 6.4.15 Equinix, Inc.
- 6.4.16 Digital Realty Trust, Inc.
- 6.4.17 Vertiv Group Corp.
- 6.4.18 Schneider Electric SE
7 MARKET OPPORTUNITIES AND FUTURE OUTLOOK
- 7.1 White-Space and Unmet-Need Assessment

 AC/DC整合電源市場:全球市場預測,2026-2032年電壓型加速計市場:全球市場預測(2026-2032年)閘流體控制氫氣整流電源市場:全球市場預測,2026-2032年
 PowerNetGuardian電動車解決方案:全球市場佔有率、排名、總收入和需求預測(2026-2032年)
 電化學絕緣市場規模、佔有率和成長分析:按組件、技術、應用、最終用途和地區分類-2026-2033年產業預測
 直流電源系統市場規模、佔有率和成長分析:按系統類型、組件類型、最終用戶產業、額定功率、安裝類型、銷售管道和地區分類-2026-2033年產業預測
 GPU電源(PSU):市佔率分析、產業趨勢與統計數據以及成長預測(2026-2031)
 2026年全球船舶和碼頭連接系統市場報告
 全球可程式電源市場規模、佔有率、趨勢和成長分析報告(2026-2034)
 2026-2030年全球交流電源系統市場