


 |
市場調查報告書
商品編碼
2098587
網路威脅情報共用平台:市場佔有率分析、產業趨勢與統計、成長預測(2026-2031)Cyber Threat Intelligence Sharing Platforms - Market Share Analysis, Industry Trends & Statistics, Growth Forecasts (2026 - 2031) |
||||||

※ 本網頁內容可能與最新版本有所差異。詳細情況請與我們聯繫。
根據 Mordor Intelligence 預測,網路威脅情報共用平台市場規模預計將在 2025 年達到 35.4 億美元,2026 年達到 39.7 億美元,到 2031 年達到 76.2 億美元,2026 年至 2031 年的複合年成長率為 13.93%。
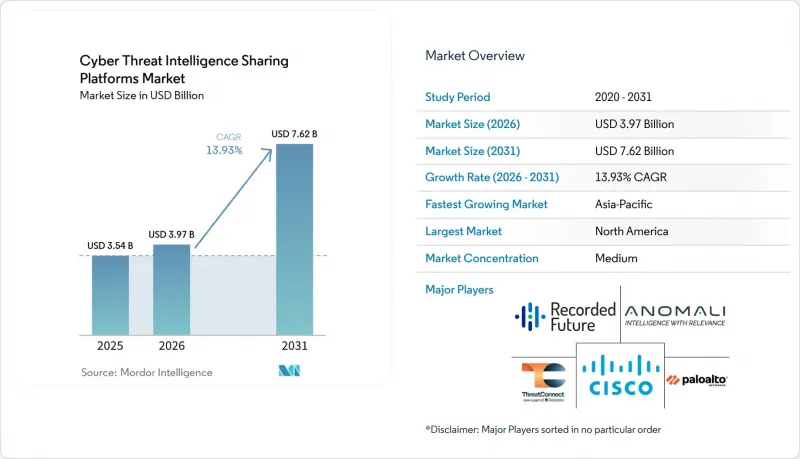
本報告按組件(軟體和服務)、部署模式(雲端、本地部署、混合部署)、企業規模(大型企業和中小企業)、威脅情報類型(戰略情報等)、最終用戶行業(銀行、金融服務和保險、醫療保健和生命科學等)以及地區進行細分。市場預測以美元計價。
全球網路威脅情報共用平台市場趨勢與洞察
監管機構對及時披露和共用事件資訊施加壓力
監管義務是網路威脅情報共用平台市場短期內最明顯的成長驅動力。這是因為監管義務正在將情報共用從自主安全措施轉向有據可查的控制措施。將於2025年1月17日生效的《數位營運風險法案》(DORA) 強制要求金融機構及其資訊通訊技術第三方供應商維護正式的網路彈性和報告流程,這增加了對結構化證據和可復現情報工作流程的需求。該草案也指出,NIS2擴大了歐洲各類組織對網路報告和資訊共用的期望範圍。這顯著增加了能夠自動收集、分類和分發資訊的平台的潛在基本客群。這項監管轉變之所以重要,是因為通用安全日誌無法提供正式網路威脅情報平台能夠提供的交換結構、用於豐富資訊的上下文或用於審查和事件後續跟進的文檔化證據。此外,這也對歐洲以外的跨國公司產生了影響,因為為歐洲客戶提供服務的供應商和服務合作夥伴越來越需要通用的工作流程來滿足這些合規性要求。事實上,監管正在影響網路威脅情報共用平台市場的產品設計和購買緊迫性。
多方威脅情報協作頻率增加
網路威脅情報共用平台市場持續擴張,協作共用模式能夠處理比以往任何時候都更多的數據、參與者以及更多特定產業用例。截至2025年底,RH-ISAC擁有333個核心成員機構,每年新增52個成員,成員參與率高達96%,平台上的情報共用總合2萬次。據FS-ISAC稱,2025年的活動反映了75個國家/地區5000多家金融企業成員的需求,其中,由人工智慧驅動的生成式詐騙和供應鏈攻擊被認為是該行業面臨的最關鍵威脅之一。隨著資訊提供者數量和共用指標數量的增加,買家越來越重視能夠將社群資訊流和商業情報整合到單一操作視圖中的平台。這進一步凸顯了資訊攝取、豐富、置信度評分和工作流程路由在網路威脅情報共用平台市場中的重要性。共用情報只有在易於實施的情況下才能創造價值,因此,能夠減少協作相關人工工作量的供應商將擁有競爭優勢。
過高的智慧和較低的信噪比
網路威脅情報共用平台市場面臨的一大阻礙因素是,資訊來源的成長速度遠超人力審查、豐富和回應的能力。谷歌雲端的一項調查顯示,82%的安全負責人擔心警報數量龐大會導致他們錯過關鍵威脅,61%的人認為資訊來源數量過大是有效實施威脅情報的主要障礙,60%的人指出分析師短缺。這意味著買家不僅需要更多的情報,還需要更好的過濾、排序和工作流程自動化。隨著社群驅動的資訊共用不斷擴展,這個問題更加嚴重,因為發布的資訊量成長速度可能超過組織評估指標和確定重要資訊的能力。因此,網路威脅情報共用平台市場並未從不斷成長的原始數據中獲益,因為低品質或優先順序不明確的訊號會降低其可操作價值。因此,提供初步研究、去重和減少警報等功能的供應商比主要只添加新資料來源的供應商更能滿足買家的需求。
細分市場分析
2025年,軟體在網路威脅情報共用平台市場佔據主導地位,市佔率高達59.84%。這表明,買家仍然傾向於採用集中式許可平台,以實現情報源的收集、評分、增強和分發。這種主導地位源自於對通用系統的實際需求,該系統能夠將情報與現有的安全工作流程連接起來,同時避免創建新的資訊孤島。在網路威脅情報共用平台市場,軟體也受益於與企業偵測和回應工具的深度整合。這種整合使得軟體成為那些需要廣泛可見性、標準化工作流程以及對內部和外部資料進行一致處理的組織的首選基礎架構。
預計2026年至2031年間,服務板塊的複合年成長率將達到14.98%,成為網路威脅情報共用平台市場中成長最快的板塊。服務板塊的成長反映出許多組織需要快速獲取情報結果,但同時又缺乏專門的分析師來管理整個內部流程。該草案以SOCRadar的「AI代理市場」為例,展示了供應商如何透過模組化交付模式實現諸如網路釣魚檢測、暗網監控和品牌濫用預防等任務的自動化。因此,在網路威脅情報共用平台市場中,儘管軟體仍然是核心層,但服務板塊正在擴大其服務範圍,以滿足那些尋求更快部署和更輕人員負擔的買家的需求。
到 2025 年,雲端將佔據威脅情報共用平台市場 52.91% 的佔有率,這得益於其可擴展性、更快的資料來源更新速度以及降低基礎設施開銷等優勢,尤其適合那些不希望在本地管理所有內容的團隊。許多買家更青睞這種模式,因為它縮短了設定時間,並能輕鬆地將威脅情報分發給眾多用戶和不同地點。在網路威脅情報共用平台市場,雲端模式對於需要廣泛功能但又無需大規模本地部署的中型企業來說也十分有效。因此,就目前的銷售佔有率而言,雲端模式仍保持著領先地位。
混合部署預計將在2026年至2031年間以15.09%的複合年成長率成長,成為網路威脅情報共用平台市場中成長最快的部署類型。這種成長趨勢在受監管產業中尤其顯著,這些產業希望在利用雲端規模資料增強和協作處理敏感度較低的指標的同時,直接控制高度敏感的遙測資料和現場證據。資料管理要求(DORA)及相關的管治壓力正在推動這種架構的發展,並增加了對文件化處理、彈性工作流程以及根據需要清晰分類敏感流程的需求。雖然網路威脅情報共用平台市場並未放棄雲,但它正在適應那些需要更易於管理的營運模式的買家的需求。
區域分析
到2025年,北美將佔據網路威脅情報共用平台市場31.09%的佔有率,成為本草案中最大的區域市場。該地區擁有大規模的企業保全行動基礎設施、成熟的ISAC生態系統,以及在銀行、金融和保險(BFSI)、能源、醫療保健和零售等行業的成熟應用案例。這些優勢支撐著網路威脅情報共用平台市場對能夠連接企業內部團隊、共用機構和商業情報資訊來源的平台的強勁需求。美國仍然是該地區需求的主要驅動力,其龐大的企業支出與廣泛的特定產業合作模式相結合。這為供應商提供了一個成熟的環境,有利於交叉銷售、工作流程整合和情報交付管理。
隨著NIS2實施階段和DORA運作階段的推進,監管義務迅速擴展,歐洲在2025年繼續佔據網路威脅情報共用平台市場的主要佔有率。根據草案,NIS2將合規範圍擴大到歐洲約2萬至30萬家營業單位,從而顯著增加了結構化共用和報告工作流程的潛在用戶群。 DORA在2026年帶來了進一步的壓力,因為它要求金融機構和相關ICT提供者採取更嚴格的文件和彈性程序。因此,在網路威脅情報共用平台市場,歐洲的採購決策與審計準備和正式的營運控制日益密切相關,因此顯得尤為突出。
預計亞太地區在2026年至2031年間的複合年成長率將達到15.53%,在所有地區中增速最高。根據這份草案,這一成長主要歸因於日本、印度和韓國等國國家行為體活動的活性化,以及監管的持續現代化。這些因素共同推動了對能夠將本地運作與更廣泛的威脅環境以及協調的防禦工作流程連接起來的工具的需求。此外,受數位金融系統擴張和正式情報共用框架日趨成熟的推動,網路威脅情報共用平台市場在南美、中東和非洲地區也擁有巨大的成長空間。
其他好處:
- Excel格式的市場預測(ME)表
- 3個月的分析師支持
目錄
第1章:引言
- 研究假設和市場定義
- 調查範圍
第2章:調查方法
第3章執行摘要
第4章 市場狀況
- 市場概覽
- 市場促進因素
- 多方在威脅情報領域的合作日益活躍。
- 監管壓力促使及時披露和共用事件訊息
- 跨不同安全堆疊自動進行IOC規範化
- 擴大參與特定領域ISAC和ISAO的規模
- 第三方和第四方風險造成的跨組織影響
- 雲端和以身分為中心的環境中對共用發現內容的需求
- 市場限制因素
- 資訊過載和低信噪比
- 對資料保密性和資訊來源歸屬缺乏信任。
- 與傳統 SIEM、SOAR 和 EDR 工作流程相關的整合複雜性。
- 小規模買家之間共用資訊貨幣化不平衡
- 產業價值鏈分析
- 監理情勢
- 技術展望
- 波特五力分析
第5章 市場規模與成長預測
- 按組件
- 軟體
- 服務
- 不同的發展
- 雲
- 現場
- 混合
- 按公司規模
- 大公司
- 小型企業
- 威脅情報的類型
- 戰略情報
- 戰術性情報
- 作戰情報
- 科技智慧
- 按最終用戶行業分類
- BFSI
- 醫療保健和生命科學
- 資訊科技/通訊
- 零售與電子商務
- 工業製造
- 政府/公共部門
- 其他終端用戶產業
- 按地區
- 北美洲
- 美國
- 加拿大
- 墨西哥
- 南美洲
- 巴西
- 阿根廷
- 其他南美國家
- 歐洲
- 德國
- 英國
- 法國
- 義大利
- 西班牙
- 俄羅斯
- 其他歐洲國家
- 亞太地區
- 中國
- 印度
- 日本
- 韓國
- 澳洲
- 其他亞太國家
- 中東和非洲
- 中東
- 沙烏地阿拉伯
- 阿拉伯聯合大公國
- 其他中東國家
- 非洲
- 南非
- 奈及利亞
- 其他非洲國家
- 中東
- 北美洲
第6章 競爭情勢
- 市場集中度
- 策略趨勢
- 市佔率分析
- 公司簡介
- Anomali, Inc.
- Recorded Future, Inc.
- ThreatConnect, Inc.
- Cisco Systems, Inc.
- Palo Alto Networks, Inc.
- CrowdStrike Holdings, Inc.
- Google LLC
- ZeroFox Holdings, Inc.
- KELA Group
- ReliaQuest, LLC
- Flashpoint, Inc.
- Intel 471, Inc.
- EclecticIQ BV
- SOCRadar Teknoloji AS
- Securonix, Inc.
- Cyble, Inc.
- Check Point Software Technologies Ltd.
- Fortinet, Inc.
- IBM Corporation
- Microsoft Corporation
第7章 市場機會與未來展望
According to Mordor Intelligence, the cyber threat intelligence sharing platforms market size is projected to be USD 3.54 billion in 2025, USD 3.97 billion in 2026, and reach USD 7.62 billion by 2031, growing at a CAGR of 13.93% from 2026 to 2031.
This report is Segmented by Component (Software and Services), Deployment (Cloud, On-Premises, and Hybrid), Enterprise Size (Large Enterprises and Small and Medium Enterprises), Threat Intelligence Type (Strategic Intelligence, and More), End-User Industry (BFSI, Healthcare and Life Sciences, and More), and Geography. The Market Forecasts are Provided in Terms of Value (USD).
Global Cyber Threat Intelligence Sharing Platforms Market Trends and Insights
Regulatory Pressure for Timely Incident Disclosure and Information Sharing
Regulatory mandates are the clearest near-term growth engine for the cyber threat intelligence sharing platforms market because they turn intelligence sharing into a documented control rather than a discretionary security practice. DORA has required financial entities and their ICT third-party providers to maintain formal cyber resilience and reporting processes since January 17, 2025, which raises the need for structured evidence and repeatable intelligence workflows. The source draft also notes that NIS2 expanded cyber reporting and information-sharing expectations across a much broader set of European organizations, which materially widened the addressable base for platforms that can automate intake, classification, and distribution. This regulatory shift matters because generic security logs do not provide the same exchange structure, enrichment context, or documentation trail that formal CTI platforms can provide during reviews and incident follow-up. It also affects multinational enterprises outside Europe, as suppliers and service partners supporting European customers increasingly need common workflows that meet these compliance expectations. In practice, the cyber threat intelligence sharing platforms market is seeing regulation shape both product design and purchasing urgency.
Rising Frequency of Multi-Party Threat Intelligence Collaboration
The cyber threat intelligence sharing platforms market is also expanding as collaborative sharing models handle more data, more participants, and more sector-specific use cases than before. RH-ISAC closed 2025 with 333 core member organizations, added 52 new members during the year, reached 96% member engagement, and recorded nearly 20,000 total intelligence shares across platforms. FS-ISAC reported that its 2025 work reflected the needs of more than 5,000 financial firm members across 75 countries, with GenAI-enabled fraud and supply chain attacks ranking among the most important threats facing the sector. As the number of contributors and the volume of shared indicators rise, buyers place greater value on platforms that can merge community feeds with commercial intelligence into a single operating view. This is raising the relevance of ingestion, enrichment, confidence scoring, and workflow routing in the cyber threat intelligence sharing platforms market. Vendors that reduce the manual burden of collaboration are better placed because shared intelligence only creates value when it is easy to operationalize.
Intelligence Overload and Low Signal-to-Noise Ratio
A major restraint in the cyber threat intelligence sharing platforms market is that feed volume is rising faster than the human capacity to review, enrich, and act on it. Google Cloud found that 82% of security practitioners worried about missing critical threats due to alert volume, 61% cited too many feeds as the main obstacle to effective operationalization of threat intelligence, and 60% pointed to insufficient analyst capacity. This means buyers are not only asking for more intelligence, but also for better filtering, ranking, and workflow automation. The problem becomes more serious when community sharing expands, because contribution volume can rise faster than an organization's ability to score indicators and decide which ones matter. As a result, the cyber threat intelligence sharing platforms market does not benefit equally from raw volume growth, since low-quality or poorly prioritized signals can reduce practical value. Vendors that offer pre-investigation, deduplication, and alert reduction are therefore better aligned with buyer needs than vendors that mainly add new feeds.
Other drivers and restraints analyzed in the detailed report include:
- Automation of IOC Normalization Across Disparate Security Stacks
- Expansion of Sectoral ISAC and ISAO Participation
- Trust Deficits Around Data Sensitivity and Source Attribution
For complete list of drivers and restraints, kindly check the Table Of Contents.
Segment Analysis
Software dominated the cyber threat intelligence sharing platforms market with a 59.84% share in 2025, which shows that buyers still prefer licensed platforms that centralize feed ingestion, scoring, enrichment, and dissemination. This leadership stems from the practical need for a common system that connects intelligence to existing security workflows without creating new silos. In the cyber threat intelligence sharing platforms market, software also benefits from deeper integration with enterprise detection and response tools. Those integrations make software the default foundation for organizations that need broad visibility, standardized workflows, and consistent handling of internal and external data.
Services is projected to grow at a 14.98% CAGR from 2026 to 2031, making it the fastest-growing component in the cyber threat intelligence sharing platforms market. Growth in services reflects the fact that many organizations need intelligence outcomes quickly but still lack enough dedicated analysts to manage the entire process in-house. The source draft points to SOCRadar's AI Agent Marketplace as an example of how vendors are automating tasks such as phishing detection, dark web monitoring, and brand abuse protection through modular delivery models. The cyber threat intelligence sharing platforms market is, therefore, keeping software as the core layer while services expand access for buyers that want faster deployment and lower staffing pressure.
Cloud captured 52.91% of the cyber threat intelligence sharing platforms market in 2025, supported by scalability, faster feed updates, and lower infrastructure overhead for teams that do not want to manage everything on premises. Many buyers prefer this model because it shortens setup time and makes it easier to distribute intelligence across many users and locations. In the cyber threat intelligence sharing platforms market, cloud deployment also works well for mid-sized organizations that want broad functionality without a large local operations footprint. This keeps cloud as the leading deployment model by current revenue share.
Hybrid deployment is projected to grow at a 15.09% CAGR from 2026 to 2031, making it the fastest-growing deployment type in the cyber threat intelligence sharing platforms market. The growth case is strongest in regulated sectors that want to keep sensitive telemetry or local evidence under direct control while still using cloud-scale enrichment and collaboration for less sensitive indicators. DORA and related governance pressures support this architecture by increasing the need for documented handling, resilient workflows, and clear separation of sensitive processes where needed. The cyber threat intelligence sharing platforms market is not moving away from cloud, but it is adapting to buyers who need more controlled operating models.
Complete Report Scope:
- By Component
- Software
- Services
- By Deployment
- Cloud
- On-Premises
- Hybrid
- By Enterprise Size
- Large Enterprises
- Small and Medium Enterprises
- By Threat Intelligence Type
- Strategic Intelligence
- Tactical Intelligence
- Operational Intelligence
- Technical Intelligence
- By End-user Industry
- BFSI
- Healthcare and Life Sciences
- Information Technology and Telecom
- Retail and E-commerce
- Industrial Manufacturing
- Government and Public Sector
- Other End-user Industries
- By Geography
- North America
- United States
- Canada
- Mexico
- South America
- Brazil
- Argentina
- Rest of South America
- Europe
- Germany
- United Kingdom
- France
- Italy
- Spain
- Russia
- Rest of Europe
- Asia-Pacific
- China
- India
- Japan
- South Korea
- Australia
- Rest of Asia-Pacific
- Middle East and Africa
- Middle East
- Saudi Arabia
- United Arab Emirates
- Rest of Middle East
- Africa
- South Africa
- Nigeria
- Rest of Africa
- Middle East
- North America
Geography Analysis
North America commanded 31.09% of the cyber threat intelligence sharing platforms market in 2025, making it the largest regional segment in the source draft. The region benefits from a large base of enterprise security operations, a mature ISAC ecosystem, and established usage across BFSI, energy, healthcare, and retail. In the cyber threat intelligence sharing platforms market, these conditions support strong demand for platforms that can connect internal teams with community sharing bodies and commercial intelligence sources. The United States remains the main engine of regional demand because it combines deep enterprise spending with a broad set of sector-specific collaboration models. This gives vendors a mature environment for cross-sell opportunities, workflow integration, and managed intelligence delivery.
Europe remained a major part of the cyber threat intelligence sharing platforms market in 2025, as regulatory obligations expanded sharply following the implementation phase of NIS2 and the operational phase of DORA. The source draft states that NIS2 widened the relevant compliance coverage from approximately 20,000 to 300,000 European entities, thereby materially expanding the potential user base for structured sharing and reporting workflows. DORA has added further pressure in 2026 because financial entities and related ICT providers now need stronger documentation and resilience procedures. Europe, therefore, stands out in the cyber threat intelligence sharing platforms market as a region where buying decisions are increasingly tied to audit readiness and formal operating controls.
Asia-Pacific leads all regions in projected growth with a 15.53% CAGR from 2026 to 2031. The source draft attributes this rise to stronger nation-state activity and continued regulatory modernization across Japan, India, and South Korea. That combination is lifting demand for tools that can connect local operations with broader threat context and collaborative defense workflows. The cyber threat intelligence sharing platforms market also has room to expand across South America, the Middle East, and Africa as digital financial systems scale and formal sharing frameworks mature.
- Anomali, Inc.
- Recorded Future, Inc.
- ThreatConnect, Inc.
- Cisco Systems, Inc.
- Palo Alto Networks, Inc.
- CrowdStrike Holdings, Inc.
- Google LLC
- ZeroFox Holdings, Inc.
- KELA Group
- ReliaQuest, LLC
- Flashpoint, Inc.
- Intel 471, Inc.
- EclecticIQ B.V.
- SOCRadar Teknoloji A.S.
- Securonix, Inc.
- Cyble, Inc.
- Check Point Software Technologies Ltd.
- Fortinet, Inc.
- IBM Corporation
- Microsoft Corporation
Additional Benefits:
- The market estimate (ME) sheet in Excel format
- 3 months of analyst support
TABLE OF CONTENTS
1 INTRODUCTION
- 1.1 Study Assumptions and Market Definition
- 1.2 Scope of the Study
2 RESEARCH METHODOLOGY
3 EXECUTIVE SUMMARY
4 MARKET LANDSCAPE
- 4.1 Market Overview
- 4.2 Market Drivers
- 4.2.1 Rising Frequency of Multi-Party Threat Intelligence Collaboration
- 4.2.2 Regulatory Pressure for Timely Incident Disclosure and Information Sharing
- 4.2.3 Automation of IOC Normalization Across Disparate Security Stacks
- 4.2.4 Expansion of Sectoral ISAC and ISAO Participation
- 4.2.5 Cross-Enterprise Exposure From Third-Party and Fourth-Party Risk
- 4.2.6 Demand for Shared Detection Content in Cloud and Identity-Centric Environments
- 4.3 Market Restraints
- 4.3.1 Intelligence Overload and Low Signal-to-Noise Ratio
- 4.3.2 Trust Deficits Around Data Sensitivity and Source Attribution
- 4.3.3 Integration Complexity With Legacy SIEM, SOAR, and EDR Workflows
- 4.3.4 Uneven Monetization of Shared Intelligence Across Smaller Buyers
- 4.4 Industry Value-Chain Analysis
- 4.5 Regulatory Landscape
- 4.6 Technological Outlook
- 4.7 Porter's Five Forces Analysis
- 4.7.1 Bargaining Power of Buyers
- 4.7.2 Bargaining Power of Suppliers
- 4.7.3 Threat of New Entrants
- 4.7.4 Threat of Substitutes
- 4.7.5 Intensity of Competitive Rivalry
5 MARKET SIZE AND GROWTH FORECASTS (VALUE)
- 5.1 By Component
- 5.1.1 Software
- 5.1.2 Services
- 5.2 By Deployment
- 5.2.1 Cloud
- 5.2.2 On-Premises
- 5.2.3 Hybrid
- 5.3 By Enterprise Size
- 5.3.1 Large Enterprises
- 5.3.2 Small and Medium Enterprises
- 5.4 By Threat Intelligence Type
- 5.4.1 Strategic Intelligence
- 5.4.2 Tactical Intelligence
- 5.4.3 Operational Intelligence
- 5.4.4 Technical Intelligence
- 5.5 By End-user Industry
- 5.5.1 BFSI
- 5.5.2 Healthcare and Life Sciences
- 5.5.3 Information Technology and Telecom
- 5.5.4 Retail and E-commerce
- 5.5.5 Industrial Manufacturing
- 5.5.6 Government and Public Sector
- 5.5.7 Other End-user Industries
- 5.6 By Geography
- 5.6.1 North America
- 5.6.1.1 United States
- 5.6.1.2 Canada
- 5.6.1.3 Mexico
- 5.6.2 South America
- 5.6.2.1 Brazil
- 5.6.2.2 Argentina
- 5.6.2.3 Rest of South America
- 5.6.3 Europe
- 5.6.3.1 Germany
- 5.6.3.2 United Kingdom
- 5.6.3.3 France
- 5.6.3.4 Italy
- 5.6.3.5 Spain
- 5.6.3.6 Russia
- 5.6.3.7 Rest of Europe
- 5.6.4 Asia-Pacific
- 5.6.4.1 China
- 5.6.4.2 India
- 5.6.4.3 Japan
- 5.6.4.4 South Korea
- 5.6.4.5 Australia
- 5.6.4.6 Rest of Asia-Pacific
- 5.6.5 Middle East and Africa
- 5.6.5.1 Middle East
- 5.6.5.1.1 Saudi Arabia
- 5.6.5.1.2 United Arab Emirates
- 5.6.5.1.3 Rest of Middle East
- 5.6.5.2 Africa
- 5.6.5.2.1 South Africa
- 5.6.5.2.2 Nigeria
- 5.6.5.2.3 Rest of Africa
- 5.6.5.1 Middle East
- 5.6.1 North America
6 COMPETITIVE LANDSCAPE
- 6.1 Market Concentration
- 6.2 Strategic Moves
- 6.3 Market Share Analysis
- 6.4 Company Profiles (includes Global Level Overview, Market Level Overview, Core Segments, Financials as available, Strategic Information, Market Rank/Share, Products and Services, Recent Developments)
- 6.4.1 Anomali, Inc.
- 6.4.2 Recorded Future, Inc.
- 6.4.3 ThreatConnect, Inc.
- 6.4.4 Cisco Systems, Inc.
- 6.4.5 Palo Alto Networks, Inc.
- 6.4.6 CrowdStrike Holdings, Inc.
- 6.4.7 Google LLC
- 6.4.8 ZeroFox Holdings, Inc.
- 6.4.9 KELA Group
- 6.4.10 ReliaQuest, LLC
- 6.4.11 Flashpoint, Inc.
- 6.4.12 Intel 471, Inc.
- 6.4.13 EclecticIQ B.V.
- 6.4.14 SOCRadar Teknoloji A.S.
- 6.4.15 Securonix, Inc.
- 6.4.16 Cyble, Inc.
- 6.4.17 Check Point Software Technologies Ltd.
- 6.4.18 Fortinet, Inc.
- 6.4.19 IBM Corporation
- 6.4.20 Microsoft Corporation
7 MARKET OPPORTUNITIES AND FUTURE OUTLOOK
- 7.1 White-Space and Unmet-Need Assessment

 威脅情報保全服務:市場佔有率分析、產業趨勢與統計資料、成長預測(2026-2031 年)
 網路威脅情報市場規模、佔有率和成長分析:按組件、部署模式、組織規模、威脅類型、情報類型、最終用戶和地區分類-2026-2033年產業預測
 銀行業網路安全與金融威脅情報市場預測至2034年-按安全類型、威脅類型、部署模式、技術、應用、最終用戶和地區分類的全球分析
 內部威脅防禦市場規模、佔有率和成長分析:按組件、部署模式、組織規模、產業和地區分類-2026-2033年產業預測
 2026-2030年全球人工智慧驅動的內部威脅偵測市場
 專業威脅分析與防護 (STAP) 市場:按類型、應用和地區分類 2026-2034 年
 威脅狩獵市場:按組件、服務類型、技術、部署模式、組織規模和產業分類-2026年至2032年全球市場預測
 網路威脅情報市場:按類型和地區分類
 2026年全球網路威脅情報市場報告
 威脅狩獵市場規模、佔有率和趨勢分析:按組件、部署模式、企業規模、最終用途、地區和細分市場預測(2026-2033 年)