


 |
市場調查報告書
商品編碼
2098571
天然海綿:市場佔有率分析、產業趨勢與統計、成長預測(2026-2031)Natural Sponge - Market Share Analysis, Industry Trends & Statistics, Growth Forecasts (2026 - 2031) |
||||||

※ 本網頁內容可能與最新版本有所差異。詳細情況請與我們聯繫。
根據 Mordor Intelligence 預測,天然海綿市場規模將從 2025 年的 12.2 億美元成長到 2026 年的 12.8 億美元,然後在 2031 年達到 16.5 億美元,2026 年至 2031 年的複合年成長率為 5.21%。
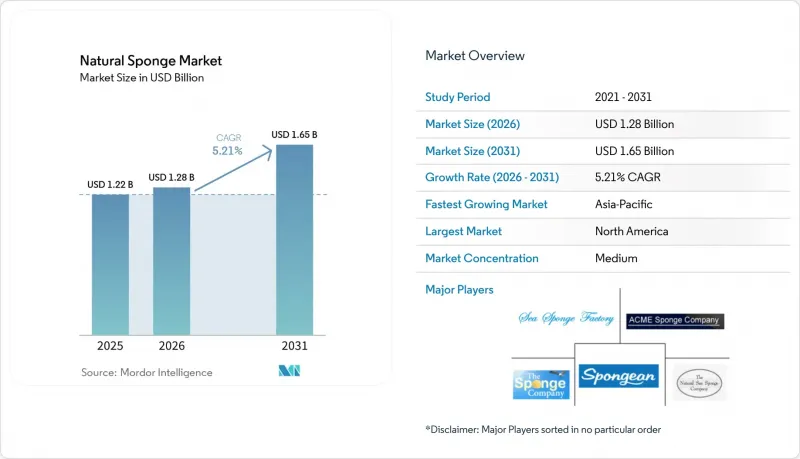
本報告按產品類型(蠶絲海綿、蜂巢海綿、羊毛海綿、黃海綿及其他)、分銷管道(實體店、網路商店)和地區(北美、歐洲、亞太、南美、中東和非洲)進行細分。市場預測以美元計價。
全球天然海綿市場趨勢與洞察
消費者越來越偏好選擇天然環保的個人保健產品
消費者對更清潔、更安全、更環保的個人保健產品的需求日益成長,為天然海綿市場創造了強勁的成長機會。隨著消費者越來越關注日常生活中使用的成分和材料,天然海綿因其可生物分解、可再生資源和不含化學物質等優點,越來越受到消費者的青睞,逐漸取代了合成替代品。根據美國國家衛生基金會 (NSF) 2024 年的一項調查,74% 的美國人更傾向於選擇有機成分的個人保健產品,65% 的人會主動尋求透明的成分標籤,以避免潛在的有害物質。這種對天然透明產品日益成長的興趣與天然海綿的特性完美契合——天然海綿不含人工添加劑和微塑膠。此外,消費者對永續消費和環保美容方式的日益重視,也促使他們將天然海綿融入護膚、沐浴和化妝等日常護理中,這將支持天然海綿市場的長期擴張。
人們對可生物分解的合成海綿替代品的需求正在成長。
人們整體關注塑膠廢棄物和微塑膠污染帶來的環境問題,這加速了個人保健產品和家居用品領域向可生物分解替代品的轉變。天然海綿取自可再生海洋資源,並在其生命週期結束時自然分解,是石油基合成海綿的環保替代品。消費者擴大選擇可生物分解產品,以減少對環境的影響,同時保持產品的性能和耐用性。品牌和零售商日益嚴格的永續發展舉措進一步推動了這一趨勢,許多品牌和零售商正在拓展產品線,推出不含塑膠和天然成分的產品。零浪費生活方式和循環經濟實踐的日益普及也推動了天然海綿在沐浴、護膚和化妝品領域的應用。
與合成海綿產品相比,價格更高
與合成海綿相比,天然海綿價格相對較高,這是其在市場上廣泛普及的主要挑戰。天然海綿需要精心收集、清洗、分類和加工,導致其生產成本高於由廉價石油衍生材料大規模生產的合成海綿。因此,天然海綿通常被定位為高級產品,對價格敏感型消費者的吸引力較低。這種價格差異在發展中國家市場尤其顯著,因為在這些市場,購買力在消費者的購買決策中扮演至關重要的角色。此外,零售商經常以多包裝和低價形式銷售合成海綿,進一步提升了其在日常家居用品中的吸引力。雖然天然海綿具有更優異的耐用性、可生物分解性和親膚性,但其較高的初始成本對初次購買者來說是一個阻礙。
細分市場分析
蜂窩海綿在天然海綿市場中佔最大佔有率,預計到2025年將佔總銷售額的32.47%。其主導地位主要得益於其卓越的吸水性、耐用性和柔軟的質地,使其在沐浴、護膚和化妝品領域廣受歡迎。消費者喜愛蜂窩海綿能夠產生豐富的泡沫,同時又溫和呵護敏感肌膚,這促使其在個人護理和健康領域得到廣泛應用。此外,在高級水療中心、美容院和豪華飯店等場所,由於這些場所偏好高品質的天然沐浴產品,蜂巢海綿的需求也十分旺盛。而且,與其他一些海綿相比,蜂巢海綿的使用壽命更長,保水性更強,為消費者提供了更高的價值。
預計到2031年,蠶絲海綿市場將以6.71%的複合年成長率高速成長,反映出消費者對優質、親膚、天然沐浴產品的需求日益成長。蠶絲海綿以其極其細膩的質地而廣受認可,是輕柔潔面、嬰兒護理和敏感肌膚護理的理想之選。消費者對溫和護膚的日益重視以及清潔美容產品的流行,正在加速推動此類產品的需求。高階護膚品牌和奢華健康服務的擴張,也進一步促進了蠶絲海綿在已開發市場和新興市場的普及。
區域分析
到2025年,北美將佔據全球天然海綿市場34.56%的佔有率,成為最大的區域市場。這個區域主導地位得益於消費者對永續和可生物分解個人保健產品的高度關注,以及消費者在高階護膚和沐浴用品上的強勁消費。美國和加拿大成熟的美容、健康和水療產業持續推動對高品質天然海綿的穩定需求。消費者對不含化學成分的去角質產品和環保合成沐浴用品替代品的日益偏好,也進一步促進了市場成長。
亞太地區預計將以最高的成長率(複合年成長率6.3%)持續成長至2031年,這主要得益於可支配收入的增加、快速的都市化以及消費者對個人保健產品日益成長的認知。全球約54%的城市人口,即超過22億人,居住在亞洲。到2050年,亞洲的城市人口預計將增加50%,新增12億人口。在中國、日本、韓國、印度和澳洲等國家,隨著消費者越來越注重健康的生活方式,對天然護膚品的需求也不斷成長。不斷壯大的中產階級以及美妝潮流(尤其是韓妝和日妝)的影響,正在推動溫和、天然成分的清潔產品(包括天然海綿)的使用。
歐洲作為成熟的天然海綿市場佔據主導地位,這主要得益於嚴格的環境法規、對永續產品的強勁需求以及有機個人保健產品日益成長的受歡迎程度。德國、法國、義大利和英國成熟的美容、健康和高階護膚產業支撐著市場需求。南美市場正在逐步成長,尤其是在巴西和阿根廷,這得益於人們對環保個人保健產品意識的提高和零售網路的不斷擴張。中東和非洲正在崛起為充滿潛力的市場,這主要得益於可支配收入的成長、飯店和水療中心的需求以及高階個人保健產品零售通路的拓展。
其他好處:
- Excel格式的市場預測(ME)表
- 3個月的分析師支持
目錄
第1章:引言
- 研究假設和市場定義
- 調查範圍
第2章:調查方法
第3章執行摘要
第4章 市場狀況
- 市場概覽
- 市場促進因素
- 消費者越來越偏好選擇天然環保的個人保健產品。
- 人們對可生物分解產品的需求日益成長,將其作為合成海綿的替代品。
- 天然海綿在高檔護膚品和化妝品的應用日益廣泛
- 人們對永續海洋衍生產品的認知不斷提高
- 水療、養生和豪華酒店業的成長
- 家庭對天然清潔產品的需求日益成長。
- 市場限制因素
- 與合成海綿替代品相比,價格更高
- 與低成本合成海綿和纖維素海綿的競爭
- 氣候變遷與海洋污染對海綿漁業的影響
- 新興市場消費者意識較低
- 消費行為分析
- 監理情勢
- 技術展望
- 波特五力分析
第5章 市場規模與成長預測
- 依產品類型
- 絲綢海綿
- 蜂巢海綿
- 羊毛海綿
- 黃色海綿
- 其他
- 透過分銷管道
- 實體店面
- 網路商店
- 按地區
- 北美洲
- 美國
- 加拿大
- 墨西哥
- 其他北美國家
- 歐洲
- 英國
- 德國
- 西班牙
- 法國
- 義大利
- 瑞典
- 愛爾蘭
- 奧地利
- 其他歐洲國家
- 亞太地區
- 中國
- 日本
- 印度
- 韓國
- 紐西蘭
- 澳洲
- 其他亞太國家
- 南美洲
- 巴西
- 阿根廷
- 其他南美國家
- 中東和非洲
- 阿拉伯聯合大公國
- 沙烏地阿拉伯
- 南非
- 其他中東和非洲國家
- 北美洲
第6章 競爭情勢
- 市場集中度
- 策略趨勢
- 市佔率分析
- 公司簡介
- The Natural Sea Sponge Company
- Sea Sponge Factory
- SPONGEAN
- Acme Sponge Company
- The Sponge Company
- Ideal Eponge SAS
- Setalg SA
- Swissco LLC
- Baby Buddy, Inc.
- Baudelaire, Inc.
- TOP SPONGE(Tsokis Christos)
- Bellini Srl
- Mediterranean Natural Sponges
- Caribbean Sea Sponge Company
- Sponges Direct Inc.
- Natural Sponge Company
- Natural Bath & Body Products, LLC
- Sponge Wholesale
- Oceanic Natural Sponges
- Greek Natural Sponges
第7章 市場機會與未來展望
According to Mordor Intelligence, the natural sponge market size is expected to grow from USD 1.22 billion in 2025 to USD 1.28 billion in 2026 and is forecast to reach USD 1.65 billion by 2031 at 5.21% CAGR over 2026-2031.
This report is Segmented by Product Type (Silk Sponge, Honeycomb Sponge, Wool Sponge, Yellow Sponge, Other Product Types), Distribution Channel (Offline Stores and Online Stores), and Geography (North America, Europe, Asia-Pacific, South America, Middle East and Africa). The Market Forecasts are Provided in Terms of Value (USD).
Global Natural Sponge Market Trends and Insights
Rising consumer preference for natural and eco-friendly personal care products
Consumer demand for cleaner, safer, and environmentally responsible personal care products is creating strong growth opportunities for the natural sponge market. As buyers become more conscious of the ingredients and materials used in their daily routines, natural sponges are increasingly favored over synthetic alternatives due to their biodegradable nature, renewable origin, and chemical-free composition. According to a 2024 survey by the National Sanitation Foundation (NSF), 74% of Americans prefer organic ingredients in personal care products, while 65% actively seek transparent ingredient labeling to avoid potentially harmful substances. This growing emphasis on natural and transparent products aligns well with the characteristics of natural sea sponges, which are free from artificial additives and microplastics. In addition, expanding awareness of sustainable consumption and eco-friendly beauty practices is encouraging consumers to incorporate natural sponges into skincare, bathing, and cosmetic applications, supporting long-term market expansion.
Growing demand for biodegradable alternatives to synthetic sponges
Increasing environmental concerns over plastic waste and microplastic pollution are accelerating the shift toward biodegradable alternatives across personal care and household products. Natural sponges, which are harvested from renewable marine sources and decompose naturally at the end of their lifecycle, offer an eco-friendly substitute to petroleum-based synthetic sponges. Consumers are increasingly choosing biodegradable products to reduce their environmental footprint while maintaining product performance and durability. This trend is further supported by stricter sustainability commitments from brands and retailers, many of which are expanding their portfolios with plastic-free and naturally sourced products. The growing popularity of zero-waste lifestyles and circular economy practices is also encouraging the adoption of natural sponges for bathing, skincare, and cosmetic applications.
Higher prices compared to synthetic sponge alternatives
The relatively high cost of natural sponges compared to synthetic alternatives remains a key challenge for broader market adoption. Natural sea sponges require careful harvesting, cleaning, grading, and processing, resulting in higher production costs than mass-produced synthetic sponges made from inexpensive petroleum-based materials. As a result, natural sponges are often positioned as premium products, making them less attractive to price-sensitive consumers. The price difference is particularly noticeable in developing markets, where affordability plays a major role in purchasing decisions. In addition, retailers frequently offer synthetic sponges in multi-pack, low-cost formats, increasing their appeal for everyday household use. Although natural sponges provide superior durability, biodegradability, and skin-friendly properties, their higher upfront cost can discourage first-time buyers.
Other drivers and restraints analyzed in the detailed report include:
- Expanding use of natural sponges in premium skincare and cosmetics
- Increasing awareness of sustainable marine-sourced products
- Competition from low-cost synthetic and cellulose sponges
For complete list of drivers and restraints, kindly check the Table Of Contents.
Segment Analysis
Honeycomb sponge accounted for the largest share of the natural sponge market, representing 32.47% of total revenue in 2025. Its leading position is primarily driven by its superior absorbency, durability, and soft texture, making it highly preferred for bathing, skincare, and cosmetic applications. Consumers value honeycomb sponges for their ability to produce a rich lather while remaining gentle on sensitive skin, supporting widespread adoption across both personal care and wellness segments. The product also benefits from strong demand in premium spa, beauty salon, and luxury hospitality settings where high-quality natural bathing accessories are preferred. In addition, its long service life and excellent water retention characteristics provide greater value to consumers compared to several alternative sponge varieties.
The silk sponge segment is projected to register the fastest CAGR of 6.71% through 2031, reflecting increasing demand for premium and skin-friendly natural bathing products. Silk sponges are widely recognized for their exceptionally fine texture, making them ideal for delicate facial cleansing, baby care, and sensitive skin applications. Rising consumer awareness regarding gentle skincare routines and the growing popularity of clean beauty products are accelerating demand for this product type. The expansion of premium skincare brands and luxury wellness services has further strengthened the adoption of silk sponges across developed and emerging markets.
Complete Report Scope:
- By Product Type
- Silk Sponge
- Honeycomb Sponge
- Wool Sponge
- Yellow Sponge
- Other Product Types
- By Distribution Channel
- Offline Stores
- Online Stores
- By Geography
- North America
- United States
- Canada
- Mexico
- Rest of North America
- Europe
- United Kingdom
- Germany
- Spain
- France
- Italy
- Sweden
- Ireland
- Austria
- Rest of Europe
- Asia-Pacific
- China
- Japan
- India
- South Korea
- New Zealand
- Australia
- Rest of Asia-Pacific
- South America
- Brazil
- Argentina
- Rest of South America
- Middle East and Africa
- United Arab Emirates
- Saudi Arabia
- South Africa
- Rest of Middle East and Africa
- North America
Geography Analysis
North America accounted for 34.56% of the global natural sponge market share in 2025, making it the largest regional market. The region's dominance is supported by high consumer awareness regarding sustainable and biodegradable personal care products, coupled with strong spending on premium skincare and bath accessories. The United States and Canada have well-established beauty, wellness, and spa industries that continue to drive consistent demand for high-quality natural sponges. Growing consumer preference for chemical-free exfoliation products and eco-friendly alternatives to synthetic bath accessories has further strengthened market growth.
Asia-Pacific is projected to expand at the fastest CAGR of 6.3% through 2031, driven by rising disposable incomes, rapid urbanization, and increasing awareness of premium personal care products. Around 54% of the global urban population, more than 2.2 billion people, live in Asia. By 2050, the urban population in Asia is expected to grow by 50% - an additional 1.2 billion people. Countries such as China, Japan, South Korea, India, and Australia are witnessing growing demand for natural skincare accessories as consumers increasingly adopt wellness-oriented lifestyles. The expanding middle-class population and the influence of beauty trends, particularly K-beauty and J-beauty, are encouraging greater use of gentle and natural cleansing products, including natural sponges.
Europe leads as a mature market for natural sponges, driven by stringent environmental regulations, strong demand for sustainable products, and the adoption of organic personal care solutions. Germany, France, Italy, and the United Kingdom sustain demand through established beauty, wellness, and luxury skincare industries. South America is growing gradually, supported by rising awareness of eco-friendly personal care products and expanding retail networks, particularly in Brazil and Argentina. The Middle East and Africa is emerging as a promising market, driven by higher disposable incomes, hotel and spa demand, and expanding premium personal care retail channels.
- The Natural Sea Sponge Company
- Sea Sponge Factory
- SPONGEAN
- Acme Sponge Company
- The Sponge Company
- Ideal Eponge SAS
- Setalg SA
- Swissco LLC
- Baby Buddy, Inc.
- Baudelaire, Inc.
- TOP SPONGE (Tsokis Christos)
- Bellini S.r.l.
- Mediterranean Natural Sponges
- Caribbean Sea Sponge Company
- Sponges Direct Inc.
- Natural Sponge Company
- Natural Bath & Body Products, LLC
- Sponge Wholesale
- Oceanic Natural Sponges
- Greek Natural Sponges
Additional Benefits:
- The market estimate (ME) sheet in Excel format
- 3 months of analyst support
TABLE OF CONTENTS
1 INTRODUCTION
- 1.1 Study Assumptions and Market Definition
- 1.2 Scope of the Study
2 RESEARCH METHODOLOGY
3 EXECUTIVE SUMMARY
4 MARKET LANDSCAPE
- 4.1 Market Overview
- 4.2 Market Drivers
- 4.2.1 Rising consumer preference for natural and eco-friendly personal care products
- 4.2.2 Growing demand for biodegradable alternatives to synthetic sponges
- 4.2.3 Expanding use of natural sponges in premium skincare and cosmetics
- 4.2.4 Increasing awareness of sustainable marine-sourced products
- 4.2.5 Growth in spa, wellness, and luxury hospitality industries
- 4.2.6 Rising demand for natural cleaning products in households
- 4.3 Market Restraints
- 4.3.1 Higher prices compared to synthetic sponge alternatives
- 4.3.2 Competition from low-cost synthetic and cellulose sponges
- 4.3.3 Vulnerability of sponge harvesting to climate change and ocean pollution
- 4.3.4 Limited consumer awareness in developing markets
- 4.4 Consumer Behavior Analysis
- 4.5 Regulatory Landscape
- 4.6 Technological Outlook
- 4.7 Porter's Five Forces Analysis
- 4.7.1 Bargaining Power of Suppliers
- 4.7.2 Bargaining Power of Buyers
- 4.7.3 Threat of New Entrants
- 4.7.4 Threat of Substitutes
- 4.7.5 Intensity of Competitive Rivalry
5 MARKET SIZE AND GROWTH FORECASTS (VALUE)
- 5.1 By Product Type
- 5.1.1 Silk Sponge
- 5.1.2 Honeycomb Sponge
- 5.1.3 Wool Sponge
- 5.1.4 Yellow Sponge
- 5.1.5 Other Product Types
- 5.2 By Distribution Channel
- 5.2.1 Offline Stores
- 5.2.2 Online Stores
- 5.3 By Geography
- 5.3.1 North America
- 5.3.1.1 United States
- 5.3.1.2 Canada
- 5.3.1.3 Mexico
- 5.3.1.4 Rest of North America
- 5.3.2 Europe
- 5.3.2.1 United Kingdom
- 5.3.2.2 Germany
- 5.3.2.3 Spain
- 5.3.2.4 France
- 5.3.2.5 Italy
- 5.3.2.6 Sweden
- 5.3.2.7 Ireland
- 5.3.2.8 Austria
- 5.3.2.9 Rest of Europe
- 5.3.3 Asia-Pacific
- 5.3.3.1 China
- 5.3.3.2 Japan
- 5.3.3.3 India
- 5.3.3.4 South Korea
- 5.3.3.5 New Zealand
- 5.3.3.6 Australia
- 5.3.3.7 Rest of Asia-Pacific
- 5.3.4 South America
- 5.3.4.1 Brazil
- 5.3.4.2 Argentina
- 5.3.4.3 Rest of South America
- 5.3.5 Middle East and Africa
- 5.3.5.1 United Arab Emirates
- 5.3.5.2 Saudi Arabia
- 5.3.5.3 South Africa
- 5.3.5.4 Rest of Middle East and Africa
- 5.3.1 North America
6 COMPETITIVE LANDSCAPE
- 6.1 Market Concentration
- 6.2 Strategic Moves
- 6.3 Market Share Analysis
- 6.4 Company Profiles (Includes Company Highlights, Strategic Information, Core Segments, Financials, Products & Services, Recent Developments)
- 6.4.1 The Natural Sea Sponge Company
- 6.4.2 Sea Sponge Factory
- 6.4.3 SPONGEAN
- 6.4.4 Acme Sponge Company
- 6.4.5 The Sponge Company
- 6.4.6 Ideal Eponge SAS
- 6.4.7 Setalg SA
- 6.4.8 Swissco LLC
- 6.4.9 Baby Buddy, Inc.
- 6.4.10 Baudelaire, Inc.
- 6.4.11 TOP SPONGE (Tsokis Christos)
- 6.4.12 Bellini S.r.l.
- 6.4.13 Mediterranean Natural Sponges
- 6.4.14 Caribbean Sea Sponge Company
- 6.4.15 Sponges Direct Inc.
- 6.4.16 Natural Sponge Company
- 6.4.17 Natural Bath & Body Products, LLC
- 6.4.18 Sponge Wholesale
- 6.4.19 Oceanic Natural Sponges
- 6.4.20 Greek Natural Sponges
7 MARKET OPPORTUNITIES AND FUTURE OUTLOOK

 柔軟性彈性體泡棉市場-2026-2032年全球市場預測彈性體泡棉市場-2026-2032年全球市場預測
 擠出發泡泡沫市場規模、佔有率和成長分析(按產品類型、應用、形狀、終端用戶產業、密度、分銷管道和地區分類):產業預測(2026-2033 年)
 異戊二烯橡膠市場-全球產業規模、佔有率、趨勢、機會、預測:銷售管道、最終用途、地區和競爭格局(2021-2031年)
 軟性彈性發泡橡膠:市場佔有率分析、產業趨勢與統計、成長預測(2026-2031)
 全球彈性體泡沫市場規模、佔有率、趨勢和成長分析報告(2026-2034)EPDM海綿墊片市場:依應用產業、形狀、硬度等級、顏色和通路-2026-2032年全球預測
 異戊二烯橡膠的全球市場 (2015-2032年):工廠生產能力、生產量、運作效率、供需數量、終端用戶產業、銷售管道、地區需求、國際貿易、企業佔有率