


 |
市場調查報告書
商品編碼
2098537
人工智慧加速器叢集:市場佔有率分析、產業趨勢與統計、成長預測(2026-2031)AI Accelerator Cluster - Market Share Analysis, Industry Trends & Statistics, Growth Forecasts (2026 - 2031) |
||||||

※ 本網頁內容可能與最新版本有所差異。詳細情況請與我們聯繫。
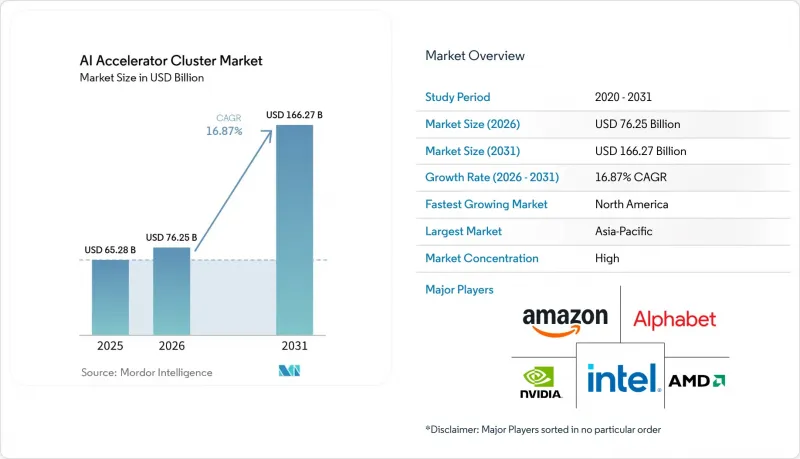
根據 Mordor Intelligence 預測,人工智慧加速器叢集市場規模將從 2025 年的 652.8 億美元成長到 2026 年的 762.5 億美元,然後在 2031 年達到 1,662.7 億美元,2026 年至 2031 年的複合年成長率為 16.87%。
本報告按元件(運算基礎架構、儲存基礎設備等)、加速器架構(基於GPU的叢集等)、叢集規模(256個加速器或以下等)、功能(訓練、推理等)、部署方式(本地部署等)、最終用戶(超大規模雲端服務供應商等)和地區進行細分。市場預測以美元(USD)計價。
全球人工智慧加速器叢集市場趨勢與洞察
生成式人工智慧訓練工作負載的快速成長
人工智慧加速器叢集市場正受到尖端模型訓練規模快速成長的驅動。這是因為買家現在計劃使用的計算模組比幾年前要大規模。為了適應這種轉變,機架級和工廠級基礎設施正被引入生產環境,這表明供應商預期的是持續的需求,而不僅僅是短期的項目激增。訓練週期也遠不止於初始購買,因為一旦在特定的運算和網路堆疊上建立了一系列模型,後續部署通常會遵循相同的架構。這提高了人工智慧加速器叢集市場硬體需求的永續性,尤其是在客戶要求更平滑的軟體相容性和更便利的系統擴展性的情況下。此外,建造延誤會增加營運商的“延遲成本”,因為這會影響後續的推理準備、供應商認證和軟體調優工作。因此,人工智慧加速器叢集市場正在經歷一種採購模式,即大規模訓練系統會影響運算、記憶體、軟體和設施設計等多個後續支出決策。
對人工智慧基礎設施超大規模雲端的資本投資
大型雲端服務供應商持續推動人工智慧加速器叢集市場的發展,其基礎設施項目決定系統訂單的進度、供應商的承諾以及部署計畫。 NVIDIA Vera Rubin平台的量產規模就是一個典型的例子,該平台於2026年5月透過150家供應鏈合作夥伴、350多家工廠和30個國家/地區全面投產。系統設計方面也出現了類似的趨勢,水冷機架平台現在以完整的基礎設施模組形式交付,而不是作為單獨的伺服器升級組件。這對人工智慧加速器叢集市場產生了重大影響,因為記憶體、先進封裝、網路和冷卻技術的長期規劃週期現在在採購流程的早期階段就已經啟動。此外,擁有長期設計訂單和合作夥伴關係的供應商可以比小規模買家更早鎖定產能,從而加劇了供應分配的不均衡。因此,超大規模企業的支出不僅增加了人工智慧加速器叢集市場的產能,也成為決定誰能及時採購關鍵組件的重要因素。
電力和製冷方面的總擁有成本較高
電力和冷卻仍然是人工智慧加速器叢集市場的主要阻礙因素。這是因為設施的就緒程度決定了系統能否依計畫部署。據英偉達稱,Vera Rubin NVL72 在持續訓練負載下運行功耗約為 132 kW,因此直接液冷已成為強制性要求而非可選項。同一資訊來源指出,液冷正成為人工智慧工廠設計的核心要素,這意味著硬體銷售往往取決於場地能否處理機架層級的熱密度和功率密度。國際能源總署 (IEA) 也報告稱,資料中心的電力需求在 2022 年至 2026 年間可能會加倍,這表明電網的限制正日益成為計畫延期的因素。這在人工智慧加速器叢集市場造成了多層次的成本問題,因為買家必須承擔加速器、冷卻系統、設施升級以及在某些情況下因電網故障造成的停機成本。此外,許多中型企業無法像超大規模資料中心業者或政府支持的專案那樣輕鬆地承擔維修的負擔,這就是為什麼公司範圍內的採用率較低的原因。
細分市場分析
到2025年,運算基礎設施將佔總收入的70.46%,成為人工智慧加速器叢集市場中最大的組成部分。這一主導地位反映了加速器半導體、機架級伺服器系統和配電硬體在每次部署中發揮的核心作用。網路基礎設施仍然是第二大投資領域,因為高頻寬網路架構決定了大規模叢集能否在訓練和推理負載下高效運作。儲存基礎設備和服務也仍然很重要,尤其是在需要並行檔案系統和近距離物件儲存來降低資料傳輸延遲的情況下。人工智慧加速器叢集市場在組件層面仍然表現出明顯的硬體偏好,因為大部分初始投資都分配給了可以安裝、啟動並部署到生產環境的系統。
預計從2026年到2031年,叢集管理軟體的複合年成長率將達到17.04%,成為人工智慧加速器叢集市場中成長最快的元件。這反映了一種實際的轉變:隨著系統向數量大規模的加速器遷移,在調度、災難復原和能源效率方面,編配變得更加具有挑戰性。此外,由於負責人需要管理混合硬體環境並要求跨不同節點類型實現更高的運轉率,軟體的價值也日益凸顯。從這個意義上講,人工智慧加速器叢集產業並非在放棄硬體需求,而是更加重視維護大規模系統穩定且高效運作的層面。隨著集群複雜性隨規模的擴大而不斷增加,未來軟體編配在人工智慧加速器叢集市場支出中的佔有率可能會越來越大。
2025年,基於GPU的叢集佔據了80.27%的銷售額,繼續保持其在人工智慧加速器叢集市場的主導地位。這一主導地位源於其在靈活的企業應用場景中的廣泛支持,在這些場景中,訓練、研發和軟體相容性仍然是優先考慮的因素。此外,這項良好記錄也增強了買家對支援工具、系統整合和開發人員能力的信心。基於TPU的叢集仍然專注於內部部署,而基於FPGA的叢集仍然局限於更有限的應用場景,例如低延遲推理和通訊工作負載。雖然異質加速器格式在特定環境中仍然很重要,但它們並沒有從根本上改變人工智慧加速器叢集市場的格局。
預計從2026年到2031年,基於客製化AI ASIC晶片的叢集將以17.21%的複合年成長率成長,成為AI加速器叢集市場中成長最快的架構。這一成長反映了明確的買家動機:專門設計的晶片在穩定、高容量的推理環境中具有更高的成本效益。這種轉變在大型營運商中最為顯著,因為他們可以將設計成本分攤到超大規模部署和迭代工作負載中。這進一步鞏固了客製化晶片在「每美元吞吐量」優先於廣泛可程式設計的領域中的地位,而GPU在通用柔軟性方面仍然保持著強大的優勢。隨著這種構成比的變化,預計AI加速器叢集市場在收入方面仍將以GPU主導,但在高容量推理發生的邊緣環境中,架構多樣化程度將會增加。
區域分析
2025年,北美繼續保持其最大區域市場的地位,佔據人工智慧加速器叢集市場佔有率的52.64%。該地區受益於超大規模資料中心業者的集中、成熟的資料中心走廊以及活躍的前沿人工智慧發展。此外,北美還擁有涵蓋加速器、伺服器、網路和系統整合等價值鏈企業的強大基礎。同時,併網能力成為大規模部署面臨的實際限制因素,政策層面也日益關注資料中心和電力供應。 2025年6月通過的德克薩斯州第6號法案旨在簡化ERCOT大規模負載連結流程的部分內容,並明確公用事業公司如何承擔新增需求所需的設備升級成本。
預計亞太地區在2026年至2031年間將以17.22%的複合年成長率成長,成為人工智慧加速器叢集市場成長最快的地區。這一成長主要得益於中國國內產能的擴張、政府對計算基礎設施的支持以及對電力供應充足地區部署需求的日益成長。華為宣布其Ascend 950PR將於2026年開始商用部署,並重點介紹了配備14000張卡、完全採用國產技術構建的深圳Ascend叢集,該集群已於2026年3月投入運作。此舉表明,亞太地區的生態系統並未受到出口管制壓力的阻礙,反而正在推動國內產能建設。因此,亞太地區在人工智慧加速器叢集市場的重要性日益凸顯,不僅因為其快速成長,更因為其正在形成更清晰的在地化供應和部署管道。
2025年,歐洲在人工智慧加速器集群市場佔據重要地位,其需求更受到主權目標的驅動,而非單一超大規模資料中心業者營運商的擴張。一份於2026年6月發布的法德聯合數位主權報告呼籲制定更強力的歐洲技術方案,並設定目標,到2027年和2028年,公共部門工作負載中主權計算的佔有率達到30%至50%。 EuroHPC遴選的「人工智慧工廠」透過在全部區域建立協調一致的公共基礎設施基礎,支持了這一方向。儘管南美洲和中東及非洲的市場規模仍然小規模,但由於主權投資和基礎設施多元化的努力,它們在更廣泛的人工智慧加速器叢集市場中的重要性正在逐步提升。
其他好處:
- Excel格式的市場預測(ME)表
- 3個月的分析師支持
目錄
第1章:引言
- 研究假設和市場定義
- 調查範圍
第2章:調查方法
第3章執行摘要
第4章 市場狀況
- 市場概覽
- 宏觀經濟因素對市場的影響
- 市場促進因素
- 生成式人工智慧訓練工作負載的快速成長
- 對人工智慧基礎設施超大規模雲端的資本投資
- 叢集規模下對低延遲互連的需求日益成長
- 企業資料中心向專用推理叢集遷移
- 為因應出口限制,國內人工智慧運算能力正在區域範圍內擴張
- 改進的高功率密度機架設計可實現大規模的叢集部署。
- 市場限制因素
- 電力和製冷的總擁有成本高
- 先進封裝和高頻寬記憶體的供應受限
- 軟體可移植性和廠商鎖定風險
- 巨型叢集資料中心網格互連延遲
- 產業價值鏈分析
- 監理情勢
- 技術展望
- 波特五力分析
第5章 市場規模與成長預測
- 按組件
- 計算基礎設施
- 網路基礎設施
- 儲存基礎設備基礎設施
- 集群管理軟體
- 服務
- 透過加速器架構
- 基於GPU的叢集
- 基於TPU的叢集
- 基於FPGA的叢集
- 客製化的基於ASIC的AI叢集
- 異質加速器集群
- 按叢集大小
- 256 或更少加速器
- 257–2,048 加速器
- 2,049–16,384 加速器
- 超過 16,384 個加速器
- 按功能
- 訓練
- 推理
- 按部署模式
- 基於雲端的
- 現場
- 混合
- 最終用戶
- 超大規模雲端服務供應商
- 公司
- 政府和研究機構
- 電信服務供應商
- 託管服務供應商
- 按地區
- 北美洲
- 美國
- 加拿大
- 墨西哥
- 歐洲
- 德國
- 英國
- 法國
- 義大利
- 其他歐洲國家
- 亞太地區
- 中國
- 日本
- 韓國
- 印度
- 東南亞
- 其他亞太國家
- 南美洲
- 中東和非洲
- 北美洲
第6章 競爭情勢
- 市場集中度
- 策略趨勢
- 市佔率分析
- 公司簡介
- NVIDIA Corporation
- Advanced Micro Devices, Inc.
- Intel Corporation
- Alphabet Inc.
- Amazon.com, Inc.
- Microsoft Corporation
- Google LLC
- Meta Platforms, Inc.
- Hewlett Packard Enterprise Company
- Dell Technologies Inc.
- Super Micro Computer, Inc.
- Lenovo Group Limited
- Cisco Systems, Inc.
- Broadcom Inc.
- Marvell Technology, Inc.
- Arista Networks, Inc.
- Taiwan Semiconductor Manufacturing Company Limited
- SK hynix Inc.
- Micron Technology, Inc.
- Samsung Electronics Co., Ltd.
- Oracle Corporation
第7章 市場機會與未來展望
According to Mordor Intelligence, the AI accelerator cluster market size is expected to grow from USD 65.28 billion in 2025 to USD 76.25 billion in 2026 and is forecast to reach USD 166.27 billion by 2031 at 16.87% CAGR over 2026-2031.
This report is Segmented by Component (Compute Infrastructure, Storage Infrastructure, and More), Accelerator Architecture (GPU-Based Clusters, and More), Cluster Size (Up To 256 Accelerators, and More), Function (Training, and Inference), Deployment (On-Premises, and More), End User (Hyperscale Cloud Service Providers, and More), and Geography. The Market Forecasts are Provided in Terms of Value (USD).
Global AI Accelerator Cluster Market Trends and Insights
Rapid Expansion Of Generative AI Training Workloads
The AI accelerator cluster market is being pushed higher by the rapid increase in training scale for frontier models, because buyers now plan for much larger compute blocks than they did a few years ago. Rack-level and factory-level infrastructure have moved into production to support this shift, which shows that vendors now expect sustained demand rather than short project spikes. The training cycle matters beyond the first purchase, because once a model family is built on a certain compute and networking stack, later deployment often stays aligned with the same architecture. That makes hardware demand more durable across the AI accelerator cluster market, especially when customers want smoother software compatibility and easier fleet expansion. It also raises the cost of delay for operators, because every postponed build can affect later inference readiness, vendor qualification, and software tuning work. The result is a procurement pattern in the AI accelerator cluster market where large training systems influence several later spending decisions across compute, memory, software, and facility design.
Hyperscale Cloud Capital Expenditure On AI Infrastructure
Large cloud operators continue to shape the AI accelerator cluster market because their infrastructure programs set the pace for system orders, supplier commitments, and deployment calendars. The scale of current factory-style rollouts is visible in the production ramp of NVIDIA's Vera Rubin platform, which entered full production in May 2026 through 150 supply-chain partners, 350+ factories, and 30 countries. The same pattern appears in system design, where liquid-cooled rack platforms are now being shipped as complete infrastructure blocks rather than as isolated server upgrades. This matters for the AI accelerator cluster market because long planning cycles in memory, advanced packaging, networking, and cooling now start much earlier in the buying process. It also makes supply access more uneven, since vendors with long-term design wins and partner alignment can secure build capacity ahead of smaller buyers. As a result, hyperscale spending is not only adding capacity in the AI accelerator cluster market, it is also shaping who can obtain key components on time.
High Total Cost Of Ownership For Power And Cooling
Power and cooling remain a major restraint on the AI accelerator cluster market because facility readiness is now a deciding factor in whether systems can be deployed on schedule. NVIDIA stated that Vera Rubin NVL72 runs at around 132 kW under sustained training loads, which makes direct liquid cooling a requirement rather than an option. The same source noted that liquid cooling is becoming central to AI factory design, which means the hardware sales often depend on whether the site can handle thermal and power density at the rack level. The International Energy Agency also reported that data center electricity demand could double between 2022 and 2026, and it flagged power grid limits as a growing source of project delay. This creates a layered cost issue in the AI accelerator cluster market, because buyers must fund accelerators, cooling systems, facility upgrades, and, in some cases, grid-related waiting periods. It also slows broader enterprise adoption, since many mid-sized operators cannot absorb the retrofit burden as easily as hyperscalers or state-backed programs.
Other drivers and restraints analyzed in the detailed report include:
- Rising Cluster-Scale Demand For Low-Latency Interconnects
- Shift Toward Dedicated Inference Clusters In Enterprise Data Centers
- Supply Constraints In Advanced Packaging And High-Bandwidth Memory
For complete list of drivers and restraints, kindly check the Table Of Contents.
Segment Analysis
Compute infrastructure held 70.46% of revenue in 2025, which made it the largest component in the AI accelerator cluster market. That lead reflected the central role of accelerator silicon, rack-scale server systems, and power distribution hardware in every deployment. Networking infrastructure remained the next most important spending layer, because high-bandwidth fabrics determine whether larger clusters can operate efficiently under training and inference loads. Storage infrastructure and services also remained important, especially where parallel file systems and nearby object storage were needed to reduce data movement delays. The AI accelerator cluster market still shows a clear hardware bias at the component level, because most early spending goes first to systems that can be installed, energized, and brought into production.
Cluster management software is projected to grow at 17.04% CAGR from 2026 to 2031, which makes it the fastest-moving component in the AI accelerator cluster market. This reflects a practical shift, because scheduling, fault recovery, and power-aware orchestration become harder as systems move toward very large accelerator counts. Software also gains value when operators manage mixed hardware environments and want higher utilization across different node types. In that sense, the AI accelerator cluster industry is not moving away from hardware demand, but it is assigning more value to the layer that keeps large systems stable and productive. Over time, software orchestration is likely to capture a larger share of wallet inside the AI accelerator cluster market because cluster complexity keeps rising with scale.
GPU-based clusters held 80.27% of revenue in 2025, which kept them at the center of the AI accelerator cluster market. Their lead came from broad support across training, research, and flexible enterprise use cases where software compatibility remains a priority. This installed base also gave buyers confidence in support tools, system integration, and developer familiarity. TPU-based clusters remained concentrated in internal deployments, while FPGA-based clusters stayed limited to narrower use cases such as low-latency inference or telecom workloads. Heterogeneous accelerator formats remained relevant in selected environments, but they did not alter the main structure of the AI accelerator cluster market.
Custom AI ASIC-based clusters are projected to grow at 17.21% CAGR from 2026 to 2031, which makes them the fastest-growing architecture in the AI accelerator cluster market. Their growth reflects a clear buyer motive, because purpose-built silicon can deliver better cost efficiency in stable, high-volume inference environments. The shift is most visible among large operators that can spread design costs across very large deployments and repeated workloads. This keeps GPUs in a strong position for general-purpose flexibility, but it also gives custom silicon a stronger foothold where throughput-per-dollar matters more than broad programmability. As this mix evolves, the AI accelerator cluster market is likely to stay GPU-led in revenue while becoming more architecturally varied at the high-volume inference edge.
Complete Report Scope:
- By Component
- Compute Infrastructure
- Networking Infrastructure
- Storage Infrastructure
- Cluster Management Software
- Services
- By Accelerator Architecture
- GPU-Based Clusters
- TPU-Based Clusters
- FPGA-Based Clusters
- Custom AI ASIC-Based Clusters
- Heterogeneous Accelerator Clusters
- By Cluster Size
- Up to 256 Accelerators
- 257-2,048 Accelerators
- 2,049-16,384 Accelerators
- Above 16,384 Accelerators
- By Function
- Training
- Inference
- By Deployment Model
- Cloud-Based
- On-Premises
- Hybrid
- By End User
- Hyperscale Cloud Service Providers
- Enterprises
- Government and Research Institutions
- Telecommunications Providers
- Colocation Service Providers
- By Geography
- North America
- United States
- Canada
- Mexico
- Europe
- Germany
- United Kingdom
- France
- Italy
- Rest of Europe
- Asia-Pacific
- China
- Japan
- South Korea
- India
- Southeast Asia
- Rest of Asia-Pacific
- South America
- Middle East and Africa
- North America
Geography Analysis
North America held 52.64% of the AI accelerator cluster market share in 2025, which kept it as the largest regional market. The region benefits from the concentration of hyperscaler headquarters, mature data center corridors, and a deep pool of frontier AI development activity. It also has a strong base of value-chain companies across accelerators, servers, networking, and systems integration. At the same time, grid readiness has become a real constraint for new large-scale deployments, and policy attention around data centers and power access has increased. Texas Senate Bill 6, enacted in June 2025, was designed to streamline parts of the ERCOT large-load interconnection process and clarify how utility upgrade costs are handled for new demand.
Asia-Pacific is projected to expand at 17.22% CAGR from 2026 to 2031, which makes it the fastest-growing regional part of the AI accelerator cluster market. Growth in the region reflects a mix of domestic Chinese capacity buildout, public support for compute infrastructure, and stronger interest in power-rich deployment corridors. Huawei stated that its Ascend 950PR entered commercial deployment in 2026, and it also highlighted the Shenzhen Ascend cluster as a fully indigenous 14,000-card installation that went live in March 2026. That development shows how export-control pressure is pushing regional ecosystems to deepen domestic capability rather than step back from expansion. The region is therefore becoming more important to the AI accelerator cluster market not only because it is growing quickly, but also because it is forming more distinct local supply and deployment paths.
Europe held a meaningful position in the AI accelerator cluster market in 2025, with demand shaped more by sovereignty goals than by stand-alone hyperscaler expansion. The Franco-German joint paper on digital sovereignty in June 2026 called for a stronger European technology package and targeted a 30-50% sovereign compute share for public-sector workloads by 2027 and 2028. EuroHPC's AI Factory selections are reinforcing that direction by creating a coordinated public infrastructure base across the region. South America and the Middle East and Africa remained smaller markets, but sovereign investment and infrastructure diversification efforts are gradually making them more relevant to the wider AI accelerator cluster market.
- NVIDIA Corporation
- Advanced Micro Devices, Inc.
- Intel Corporation
- Alphabet Inc.
- Amazon.com, Inc.
- Microsoft Corporation
- Google LLC
- Meta Platforms, Inc.
- Hewlett Packard Enterprise Company
- Dell Technologies Inc.
- Super Micro Computer, Inc.
- Lenovo Group Limited
- Cisco Systems, Inc.
- Broadcom Inc.
- Marvell Technology, Inc.
- Arista Networks, Inc.
- Taiwan Semiconductor Manufacturing Company Limited
- SK hynix Inc.
- Micron Technology, Inc.
- Samsung Electronics Co., Ltd.
- Oracle Corporation
Additional Benefits:
- The market estimate (ME) sheet in Excel format
- 3 months of analyst support
TABLE OF CONTENTS
1 INTRODUCTION
- 1.1 Study Assumptions and Market Definition
- 1.2 Scope of the Study
2 RESEARCH METHODOLOGY
3 EXECUTIVE SUMMARY
4 MARKET LANDSCAPE
- 4.1 Market Overview
- 4.2 Impact of Macroeconomic Factors on the Market
- 4.3 Market Drivers
- 4.3.1 Rapid Expansion of Generative AI Training Workloads
- 4.3.2 Hyperscale Cloud Capital Expenditure on AI Infrastructure
- 4.3.3 Rising Cluster-Scale Demand for Low-Latency Interconnects
- 4.3.4 Shift Toward Dedicated Inference Clusters in Enterprise Data Centers
- 4.3.5 Export-Control Driven Regional Buildout of Domestic AI Compute Capacity
- 4.3.6 Power-Dense Rack Design Improvements Enabling Larger Cluster Deployments
- 4.4 Market Restraints
- 4.4.1 High Total Cost of Ownership for Power and Cooling
- 4.4.2 Supply Constraints in Advanced Packaging and High-Bandwidth Memory
- 4.4.3 Software Portability and Vendor Lock-In Risk
- 4.4.4 Data Center Grid Interconnection Delays for Mega-Clusters
- 4.5 Industry Value Chain Analysis
- 4.6 Regulatory Landscape
- 4.7 Technological Outlook
- 4.8 Porter's Five Forces Analysis
- 4.8.1 Bargaining Power of Suppliers
- 4.8.2 Bargaining Power of Buyers
- 4.8.3 Threat of New Entrants
- 4.8.4 Threat of Substitutes
- 4.8.5 Industry Rivalry
- 4.8.6 Analysis
5 MARKET SIZE AND GROWTH FORECASTS (VALUE)
- 5.1 By Component
- 5.1.1 Compute Infrastructure
- 5.1.2 Networking Infrastructure
- 5.1.3 Storage Infrastructure
- 5.1.4 Cluster Management Software
- 5.1.5 Services
- 5.2 By Accelerator Architecture
- 5.2.1 GPU-Based Clusters
- 5.2.2 TPU-Based Clusters
- 5.2.3 FPGA-Based Clusters
- 5.2.4 Custom AI ASIC-Based Clusters
- 5.2.5 Heterogeneous Accelerator Clusters
- 5.3 By Cluster Size
- 5.3.1 Up to 256 Accelerators
- 5.3.2 257-2,048 Accelerators
- 5.3.3 2,049-16,384 Accelerators
- 5.3.4 Above 16,384 Accelerators
- 5.4 By Function
- 5.4.1 Training
- 5.4.2 Inference
- 5.5 By Deployment Model
- 5.5.1 Cloud-Based
- 5.5.2 On-Premises
- 5.5.3 Hybrid
- 5.6 By End User
- 5.6.1 Hyperscale Cloud Service Providers
- 5.6.2 Enterprises
- 5.6.3 Government and Research Institutions
- 5.6.4 Telecommunications Providers
- 5.6.5 Colocation Service Providers
- 5.7 By Geography
- 5.7.1 North America
- 5.7.1.1 United States
- 5.7.1.2 Canada
- 5.7.1.3 Mexico
- 5.7.2 Europe
- 5.7.2.1 Germany
- 5.7.2.2 United Kingdom
- 5.7.2.3 France
- 5.7.2.4 Italy
- 5.7.2.5 Rest of Europe
- 5.7.3 Asia-Pacific
- 5.7.3.1 China
- 5.7.3.2 Japan
- 5.7.3.3 South Korea
- 5.7.3.4 India
- 5.7.3.5 Southeast Asia
- 5.7.3.6 Rest of Asia-Pacific
- 5.7.4 South America
- 5.7.5 Middle East and Africa
- 5.7.1 North America
6 COMPETITIVE LANDSCAPE
- 6.1 Market Concentration
- 6.2 Strategic Moves
- 6.3 Market Share Analysis
- 6.4 Company Profiles (includes Global Level Overview, Market Level Overview, Core Segments, Financials as available, Strategic Information, Market Rank/Share, Products and Services, Recent Developments)
- 6.4.1 NVIDIA Corporation
- 6.4.2 Advanced Micro Devices, Inc.
- 6.4.3 Intel Corporation
- 6.4.4 Alphabet Inc.
- 6.4.5 Amazon.com, Inc.
- 6.4.6 Microsoft Corporation
- 6.4.7 Google LLC
- 6.4.8 Meta Platforms, Inc.
- 6.4.9 Hewlett Packard Enterprise Company
- 6.4.10 Dell Technologies Inc.
- 6.4.11 Super Micro Computer, Inc.
- 6.4.12 Lenovo Group Limited
- 6.4.13 Cisco Systems, Inc.
- 6.4.14 Broadcom Inc.
- 6.4.15 Marvell Technology, Inc.
- 6.4.16 Arista Networks, Inc.
- 6.4.17 Taiwan Semiconductor Manufacturing Company Limited
- 6.4.18 SK hynix Inc.
- 6.4.19 Micron Technology, Inc.
- 6.4.20 Samsung Electronics Co., Ltd.
- 6.4.21 Oracle Corporation
7 MARKET OPPORTUNITIES AND FUTURE OUTLOOK
- 7.1 White-Space and Unmet-Need Assessment

 2026年全球人工智慧(AI)模型評估平台市場報告
 人工智慧平台服務市場:按組件、部署模式、技術、應用、最終用戶和地區分類2026年全球空間分析平台市場報告
 全球搜尋增強生成平台市場:按產品、部署、搜尋方法、應用、組織規模和最終用戶產業分類-市場規模、產業動態、機會分析和預測(2026-2035 年)
 範圍 3 供應鏈排放透明度平台:市場佔有率分析、行業趨勢和統計數據、成長預測(2026-2031 年)
 2034年全球一體化城市智慧平台市場預測:按組件、部署模式、應用、最終用戶和地區分類的全球分析AI驅動的資料處理歷程解決方案市場預測至2034年:按組件、部署模式、技術、應用、最終用戶和地區分類的全球分析2026年全球集群管理應用市場報告人機互動(HITL)市場:按類型、應用、技術、國家和地區分類-全球產業分析、市場規模、市場佔有率及2026年至2033年預測2026年全球地址自動補全人工智慧(AI)市場報告