


 |
市場調查報告書
商品編碼
2097361
金融服務業虛擬桌面:市場佔有率分析、產業趨勢與統計、成長預測(2025-2030 年)Desktop Virtualization In Financial Services Industry - Market Share Analysis, Industry Trends & Statistics, Growth Forecasts (2025 - 2030) |
||||||

※ 本網頁內容可能與最新版本有所差異。詳細情況請與我們聯繫。
根據 Mordor Intelligence 預測,金融服務業虛擬桌面市場規模預計在 2025 年達到 288 萬美元,到 2030 年達到 575 萬美元,預測期內複合年成長率為 14.8%。
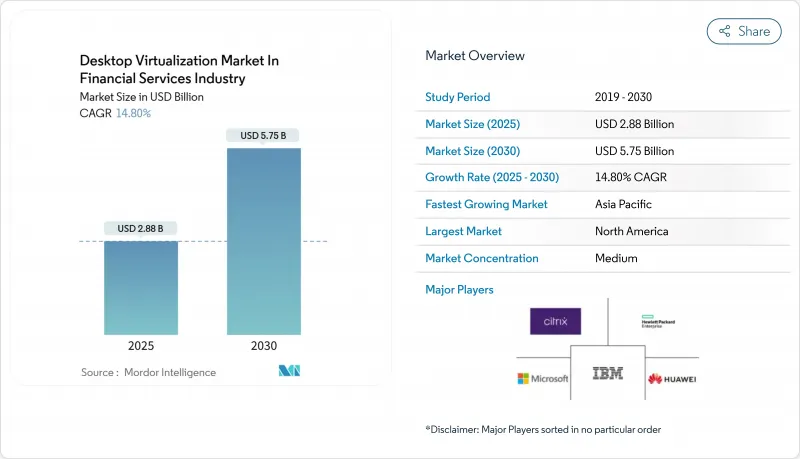
本報告按桌面交付平台(例如,託管虛擬桌面)、部署方式(本地部署、雲端部署、混合部署)、組織規模(大型企業、中小企業)、最終用戶(例如,零售/商業銀行)和地區(例如,北美、歐洲)進行細分。市場預測以美元計價。
金融服務業虛擬桌面市場趨勢及洞察。
面向一級銀行的全面雲端遷移策略
各大銀行正基於混合雲端架構重建其桌面環境,以提高系統彈性並降低整體擁有成本。雖然高度敏感的交易平台仍保留在本地,但後勤部門桌面正在遷移到雲端訂閱模式,從而能夠為承包商、測試團隊和災害復原培訓提供動態資源配置。因此,採購策略正從硬體更換週期轉向與業務成果掛鉤的基於營運成本的合約。這種轉變正在加速雲端原生安全控制的標準化,並促進跨虛擬會話的審計追蹤整合。隨著金融機構分階段部署遷移(歷時 24 至 36 個月),能夠彌合傳統資料中心和多重雲端編配之間差距的供應商的需求日益成長。
加速向零信任安全框架過渡
金融公司現在要求所有虛擬桌面連線都必須進行持續身份驗證,這需要整合多因素身份驗證 (MFA)、行為分析和基於會話的風險評分。交易員使用生物識別登錄,基於位置的控制措施會在出現異常情況時限制資料訪問,而合規團隊則會即時審核擊鍵歷史記錄。這些功能意味著 VDI 選擇標準不再局限於效能,還包括原生零信任合規性。因此,擁有網路安全和虛擬化專業知識的整合商可以收取高額諮詢費,平台藍圖也擴大納入用於威脅情報來源的 API 介面。
整合傳統大型主機的複雜性
許多銀行仍然使用幾十年前的大型主機來處理高價值交易。將這些系統連接到現代虛擬桌面基礎架構 (VDI) 需要客製化中間件、雙重身分驗證路徑和延遲補償措施,這會使部署時間延長 6 到 12 個月,預算也會增加兩位數。依賴稀缺的 COBOL 專家和專有工具會削弱與供應商的議價能力,減緩創新速度,並阻礙與數位化原生競爭對手相比實現價值的時間。
基於細分市場的分析
2024年,託管虛擬桌面仍維持47.1%的收入佔有率,但桌面即服務(DaaS)的複合年成長率(CAGR)達到17.8%,穩步削弱了老牌企業的統治地位。 DaaS之所以迅速崛起,是因為其付費使用制的定價模式能夠適應諮詢、交易和合規部門常見的員工人數波動。服務供應商將符合監管要求的日誌記錄功能和GPU選項捆綁在一起,使中型銀行能夠在無需大量資本支出的情況下使用企業級技術堆疊。託管共用桌面產品使用標準化應用程式,滿足特定環境的需求,而遠端桌面服務則支援分店的傳統Windows工作負載。
金融服務業的虛擬桌面市場正受益於DaaS供應商預先整合的零信任和災害復原方案,這可以將部署時間從數月縮短至數週。多租用戶控制平面可自動執行修補程式和漏洞掃描,從而減輕稽核負擔。相較之下,對於那些政策禁止異地資料儲存的金融機構而言,本地部署的HVD環境仍然具有吸引力,但它們面臨著因更新周期而導致的總體成本增加的挑戰。因此,前瞻性的買家傾向於採用混合採購模式,將核心交易桌面部署在私有雲端中,同時將管理用戶遷移到公有DaaS平台。
截至2024年,本地部署環境在金融服務業的虛擬桌面市場中佔據58.4%的佔有率,但預計到2030年,雲端實例將以16.2%的複合年成長率成長。銀行正透過將高度敏感的資料集隔離在本地,並將季節性和低風險的工作負載卸載到超大規模資料中心業者,來解決資料主權問題。混合編配平台會根據延遲、合規性標籤和成本來調度桌面。
隨著監管機構發布更清晰的加密、金鑰管理和存取審計指南,以及人們對風險的認知降低,遷移到雲端的趨勢正在加速。保險公司正在更靠近客戶的雲端區域處理理賠,以改善客戶體驗,而核心精算模型則仍保留在私有區域。由於金融機構力求避免平台鎖定,那些能夠在 AWS、Azure 和 GCP 等平台提供統一策略執行的供應商正在贏得市場佔有率。
區域分析
2024年,北美以41.2%的市佔率位居榜首。這主要得益於零信任架構的早期應用、密集的交易中心以及紐約、芝加哥和多倫多等地的大規模GPU虛擬化先導計畫。金融機構正大力投資系統彈性,在各大大都會圈區建構雙活桌面對,以滿足聯邦政府關於業務永續營運的指導方針。容錯移轉秒級故障轉移和傳輸中加密已成為標準功能,支出也轉向監控和自動化修復,以應對勒索軟體攻擊。
亞太地區預計將以12.7%的複合年成長率實現最高成長,這主要得益於新加坡、澳洲和日本監管機構明確了雲端使用規則,鼓勵銀行實現分店技術現代化並推出行動優先服務。金融集團正在部署混合桌面網格,將本地資料中心單元與區域超大規模資料中心業者資料中心容量結合,因此能夠快速推出至鄰近市場。印度和東南亞的金融科技生態系統透過突破傳統限制的待開發區建設,進一步推動了需求成長。
在歐洲,受GDPR(一般資料保護規則)合規性和強制性能源效率要求的推動,設備更新換代正在穩步推進。法蘭克福和巴黎的銀行優先採用符合ESG目標的精簡型用戶端,以整合集中管理虛擬桌面的低功耗終端取代老舊的PC。嚴格的資料主權法規正在推動對特定國家雲端區域和加密金鑰託管的投資。在中東和非洲,儘管仍處於早期階段,但採用率正在加速提升,杜拜和約翰尼斯堡等地的金融自由區鼓勵發放「數位優先」的銀行牌照。在南美洲,也出現了一些進展,巴西和智利的金融機構正在試行為客服中心客服人員部署雲端桌面,同時將核心應用程式保留在本地。
其他好處:
- Excel格式的市場預測(ME)表
- 3個月的分析師支持
目錄
第1章:引言
- 市場分析與定義的前提條件
- 分析範圍
第2章 分析方法
第3章執行摘要
第4章 市場狀況
- 市場概覽
- 市場促進因素
- 一級銀行採用雲端遷移策略
- 加速向零信任安全框架過渡
- 資本市場交易大廳實施強制混合辦公安排
- 受ESG(環境、社會和治理)因素驅動,對節能型精簡型用戶端的需求不斷成長。
- 利用GPU進行風險分析工作負載增加
- AI-PC終端的廣泛應用使得本地推理任務得以卸載。
- 市場限制因素
- 整合傳統大型主機的複雜性
- 雲端原生 VDI 操作技能缺口
- 依賴特定供應商的風險
- 監管資料居住要求推高了實施成本。
- 重要法規結構的評估
- 產業價值鏈分析
- 技術展望
- 波特五力分析
- 主要用例和案例研究
- 宏觀經濟因素對市場的影響
- 投資分析
第5章:預測市場規模與成長率
- 透過桌面交付平台
- 託管虛擬桌面 (HVD)
- 託管共用桌面 (HSD)
- DaaS (Desktop-as-a-Service)
- 遠端桌面服務 (RDS)
- 透過部署方法
- 現場
- 雲
- 混合
- 按組織規模
- 大公司
- 小型企業
- 最終用戶
- 零售/商業銀行
- 資本市場與資本交易
- 保險
- 金融科技、支付服務提供者
- 按地區
- 北美洲
- 美國
- 加拿大
- 墨西哥
- 南美洲
- 巴西
- 阿根廷
- 其他南美國家
- 歐洲
- 德國
- 英國
- 法國
- 義大利
- 西班牙
- 俄羅斯
- 其他歐洲國家
- 亞太地區
- 中國
- 日本
- 印度
- 韓國
- 其他亞太國家
- 中東和非洲
- 中東
- 沙烏地阿拉伯
- 阿拉伯聯合大公國
- 土耳其
- 其他中東國家
- 非洲
- 南非
- 奈及利亞
- 埃及
- 其他非洲國家
- 中東
- 北美洲
第6章 競爭情勢
- 市場集中度
- 策略趨勢
- 市佔率分析
- 公司簡介
- Citrix Systems, Inc.
- Microsoft Corporation
- VMware, Inc.
- Amazon Web Services, Inc.
- Hewlett Packard Enterprise Development LP
- IBM Corporation
- Dell Technologies Inc.
- Huawei Technologies Co., Ltd.
- Oracle Corporation
- Google LLC
- Parallels International GmbH(Corel)
- NComputing Co., Ltd.
- Evolve IP, LLC
- Ericom Software Ltd.
- Workspot, Inc.
- Nerdio, Inc.
- Anunta Tech Inc.
- Accops Systems Pvt. Ltd.
- XTIUM(ATSG)
- DXC Technology Company
第7章 市場機會與未來展望
According to Mordor Intelligence, the desktop virtualization market in financial services industry size stands at USD 2.88 million in 2025 and is projected to reach USD 5.75 million by 2030, posting a 14.8% CAGR over the forecast period.
This report is Segmented by Desktop Delivery Platform (Hosted Virtual Desktop, and More), Deployment Mode (On-Premise, Cloud, and Hybrid), Organization Size (Large Enterprises, and Small and Mid-Sized Enterprises), End-User (Retail and Commercial Banking, and More), and Geography (North America, Europe, and More). The Market Forecasts are Provided in Terms of Value (USD).
Insights and Trends of Desktop Virtualization Market In Financial Services Industry
Widespread Cloud-Migration Strategies Among Tier-1 Banks
Large banks are refactoring their desktop estates around hybrid-cloud blueprints to improve resilience and reduce ownership costs. Sensitive trading platforms remain on-premises, while back-office desktops transition to cloud subscription models, enabling dynamic provisioning for contractors, test teams, and disaster recovery drills. Procurement, therefore, pivots from hardware refresh cycles to operating-expense contracts aligned with business outcomes. The shift accelerates standardization on cloud-native security controls and drives embedded audit-trail functionality across virtual sessions. Vendors capable of bridging legacy data centers with multi-cloud orchestration capture heightened demand as institutions roll out phased migrations over 24-36 months.
Accelerated Move to Zero-Trust Security Frameworks
Financial firms now insist that every virtual desktop connection authenticates continuously, integrating MFA, behavioral analytics, and session-based risk scoring. Traders log in with biometrics and location controls that restrict data access when anomalies arise, while compliance teams audit keystroke-level histories in real-time. These capabilities elevate VDI selection criteria beyond performance to encompass native zero-trust alignment. Consequently, specialist integrators with combined cybersecurity and virtualization expertise command premium consulting rates, and platform roadmaps increasingly embed API hooks for threat-intelligence feeds.
Legacy Mainframe Integration Complexity
Many banks still process high-value transactions on decades-old mainframes. Bridging these systems to modern VDI stacks requires custom middleware, doubled authentication paths, and latency workarounds that add 6-12 months to rollouts and raise budgets by double-digit percentages. Dependence on scarce COBOL specialists and proprietary tooling reduces vendor leverage and slows innovation, hampering time-to-value compared to digital-native peers.
Other drivers and restraints analyzed in the detailed report include:
- Hybrid-Work Mandates for Capital-Market Trading Floors
- Growing GPU-Enabled Risk-Analytics Workloads
- Skills Gap in Cloud-Native VDI Operations
For complete list of drivers and restraints, kindly check the Table Of Contents.
Segment Analysis
Hosted Virtual Desktop retained a 47.1% revenue share in 2024, yet Desktop-as-a-Service posted a 17.8% CAGR that steadily eroded incumbent dominance. DaaS gains ground because fee-for-use pricing aligns with volatile head-count swings common in advisory, trading, and compliance units. Service providers bundle regulatory logging and GPU options, allowing mid-tier banks to access enterprise-grade stacks without incurring capital expenditure spikes. Hosted Shared Desktop products cater to niche environments with standardized applications, while Remote Desktop Services support legacy Windows workloads in branch offices.
The desktop virtualization market in financial services industry benefits as DaaS vendors pre-integrate zero-trust and disaster-recovery playbooks, shortening deployment from months to weeks. Multi-tenant control planes automate patching and vulnerability scans, easing audit pressures. In contrast, on-premises HVD estates still appeal to institutions whose policies prohibit off-site data, but they face refresh cycles that increase total cost. Forward-looking buyers therefore favor hybrid procurement, sinking core trading desktops into private clouds while diverting clerical users to public DaaS.
On-premises estates held a 58.4% desktop virtualization market in financial services industry in 2024, but cloud instances are expected to compound at 16.2% through 2030. Banks reconcile sovereignty concerns by ring-fencing sensitive data sets locally, then offloading seasonal or low-risk workloads to hyperscalers. Hybrid orchestration platforms schedule desktops based on latency, compliance tags, and cost.
Cloud acceleration intensifies as regulators publish clearer guidance on encryption, key management, and audit access, lowering perceived risk. Insurers run claims adjudication in cloud regions close to customers for a better experience, while core actuarial models remain in private zones. Vendors that deliver uniform policy enforcement across AWS, Azure, and GCP win share as institutions resist platform lock-in.
Complete Report Scope:
- By Desktop Delivery Platform
- Hosted Virtual Desktop (HVD)
- Hosted Shared Desktop (HSD)
- Desktop-as-a-Service (DaaS)
- Remote Desktop Services (RDS)
- By Deployment Mode
- On-Premises
- Cloud
- Hybrid
- By Organization Size
- Large Enterprises
- Small and Mid-sized Enterprises (SMEs)
- By End-User
- Retail and Commercial Banking
- Capital Markets and Trading
- Insurance
- FinTech and Payment Providers
- By Geography
- North America
- United States
- Canada
- Mexico
- South America
- Brazil
- Argentina
- Rest of South America
- Europe
- Germany
- United Kingdom
- France
- Italy
- Spain
- Russia
- Rest of Europe
- Asia-Pacific
- China
- Japan
- India
- South Korea
- Rest of Asia-Pacific
- Middle East and Africa
- Middle East
- Saudi Arabia
- United Arab Emirates
- Turkey
- Rest of Middle East
- Africa
- South Africa
- Nigeria
- Egypt
- Rest of Africa
- Middle East
- North America
Geography Analysis
North America led with 41.2% market share in 2024, powered by early zero-trust adoption, dense trading hubs, and large-scale GPU virtualization pilots in New York, Chicago, and Toronto. Institutions invest heavily in resilience, building active-active desktop pairs across metropolitan zones to meet federal guidelines on business continuity. Sub-second failover and encryption-in-transit are baseline specifications, and spending shifts toward monitoring and automated remediation to guard against ransomware.
The Asia-Pacific region is expected to record the fastest 12.7% CAGR, as regulators in Singapore, Australia, and Japan clarify cloud usage rules, encouraging banks to modernize their branch technology and launch mobile-first services. Financial groups deploy hybrid desktop grids that blend local data-center pods with regional hyperscaler capacity, allowing for rapid expansion into adjacent markets. FinTech ecosystems in India and Southeast Asia further fuel demand through green-field builds that leapfrog legacy limitations.
Europe experiences steady replacement cycles driven by GDPR compliance and energy-efficiency mandates. Banks in Frankfurt and Paris emphasize thin-client rollouts tied to ESG targets, swapping aging PCs for low-wattage endpoints that integrate with centralized virtual desktops. Stringent data-sovereignty statutes spur investments in country-specific cloud regions and encryption key escrow. Middle East and Africa show nascent but accelerating uptake in Dubai and Johannesburg, where financial free zones incentivize digital-first banking licenses. South America advances selectively, with Brazilian and Chilean lenders piloting cloud desktops for contact-centre agents while core applications stay on-premises.
- Citrix Systems, Inc.
- Microsoft Corporation
- VMware, Inc.
- Amazon Web Services, Inc.
- Hewlett Packard Enterprise Development LP
- IBM Corporation
- Dell Technologies Inc.
- Huawei Technologies Co., Ltd.
- Oracle Corporation
- Google LLC
- Parallels International GmbH (Corel)
- NComputing Co., Ltd.
- Evolve IP, LLC
- Ericom Software Ltd.
- Workspot, Inc.
- Nerdio, Inc.
- Anunta Tech Inc.
- Accops Systems Pvt. Ltd.
- XTIUM (ATSG)
- DXC Technology Company
Additional Benefits:
- The market estimate (ME) sheet in Excel format
- 3 months of analyst support
TABLE OF CONTENTS
1 INTRODUCTION
- 1.1 Study Assumptions and Market Definition
- 1.2 Scope of the Study
2 RESEARCH METHODOLOGY
3 EXECUTIVE SUMMARY
4 MARKET LANDSCAPE
- 4.1 Market Overview
- 4.2 Market Drivers
- 4.2.1 Widespread Cloud-migration Strategies Among Tier-1 Banks
- 4.2.2 Accelerated Move to Zero-trust Security Frameworks
- 4.2.3 Hybrid-work Mandates for Capital-market Trading Floors
- 4.2.4 ESG-driven Demand for Energy-efficient Thin Clients
- 4.2.5 Growing GPU-enabled Risk-analytics Workloads
- 4.2.6 Proliferation of AI-PC Endpoints Enabling Local Inference Off-loading
- 4.3 Market Restraints
- 4.3.1 Legacy Mainframe Integration Complexity
- 4.3.2 Skills Gap in Cloud-native VDI Operations
- 4.3.3 Concentrated Vendor-dependency Risk
- 4.3.4 Regulatory Data-residency Requirements Raising Deployment Cost
- 4.4 Evaluation of Critical Regulatory Framework
- 4.5 Industry Value Chain Analysis
- 4.6 Technological Outlook
- 4.7 Porter's Five Forces
- 4.7.1 Bargaining Power of Suppliers
- 4.7.2 Bargaining Power of Buyers
- 4.7.3 Threat of New Entrants
- 4.7.4 Threat of Substitutes
- 4.7.5 Competitive Rivalry
- 4.8 Key Use Cases and Case Studies
- 4.9 Impact on Macroeconomic Factors of the Market
- 4.10 Investment Analysis
5 MARKET SIZE AND GROWTH FORECASTS (VALUES)
- 5.1 By Desktop Delivery Platform
- 5.1.1 Hosted Virtual Desktop (HVD)
- 5.1.2 Hosted Shared Desktop (HSD)
- 5.1.3 Desktop-as-a-Service (DaaS)
- 5.1.4 Remote Desktop Services (RDS)
- 5.2 By Deployment Mode
- 5.2.1 On-Premises
- 5.2.2 Cloud
- 5.2.3 Hybrid
- 5.3 By Organization Size
- 5.3.1 Large Enterprises
- 5.3.2 Small and Mid-sized Enterprises (SMEs)
- 5.4 By End-User
- 5.4.1 Retail and Commercial Banking
- 5.4.2 Capital Markets and Trading
- 5.4.3 Insurance
- 5.4.4 FinTech and Payment Providers
- 5.5 By Geography
- 5.5.1 North America
- 5.5.1.1 United States
- 5.5.1.2 Canada
- 5.5.1.3 Mexico
- 5.5.2 South America
- 5.5.2.1 Brazil
- 5.5.2.2 Argentina
- 5.5.2.3 Rest of South America
- 5.5.3 Europe
- 5.5.3.1 Germany
- 5.5.3.2 United Kingdom
- 5.5.3.3 France
- 5.5.3.4 Italy
- 5.5.3.5 Spain
- 5.5.3.6 Russia
- 5.5.3.7 Rest of Europe
- 5.5.4 Asia-Pacific
- 5.5.4.1 China
- 5.5.4.2 Japan
- 5.5.4.3 India
- 5.5.4.4 South Korea
- 5.5.4.5 Rest of Asia-Pacific
- 5.5.5 Middle East and Africa
- 5.5.5.1 Middle East
- 5.5.5.1.1 Saudi Arabia
- 5.5.5.1.2 United Arab Emirates
- 5.5.5.1.3 Turkey
- 5.5.5.1.4 Rest of Middle East
- 5.5.5.2 Africa
- 5.5.5.2.1 South Africa
- 5.5.5.2.2 Nigeria
- 5.5.5.2.3 Egypt
- 5.5.5.2.4 Rest of Africa
- 5.5.5.1 Middle East
- 5.5.1 North America
6 COMPETITIVE LANDSCAPE
- 6.1 Market Concentration
- 6.2 Strategic Moves
- 6.3 Market Share Analysis
- 6.4 Company Profiles {(includes Global level Overview, Market level overview, Core Segments, Financials as available, Strategic Information, Market Rank/Share for key companies, Products and Services, and Recent Developments)}
- 6.4.1 Citrix Systems, Inc.
- 6.4.2 Microsoft Corporation
- 6.4.3 VMware, Inc.
- 6.4.4 Amazon Web Services, Inc.
- 6.4.5 Hewlett Packard Enterprise Development LP
- 6.4.6 IBM Corporation
- 6.4.7 Dell Technologies Inc.
- 6.4.8 Huawei Technologies Co., Ltd.
- 6.4.9 Oracle Corporation
- 6.4.10 Google LLC
- 6.4.11 Parallels International GmbH (Corel)
- 6.4.12 NComputing Co., Ltd.
- 6.4.13 Evolve IP, LLC
- 6.4.14 Ericom Software Ltd.
- 6.4.15 Workspot, Inc.
- 6.4.16 Nerdio, Inc.
- 6.4.17 Anunta Tech Inc.
- 6.4.18 Accops Systems Pvt. Ltd.
- 6.4.19 XTIUM (ATSG)
- 6.4.20 DXC Technology Company
7 MARKET OPPORTUNITIES AND FUTURE OUTLOOK
- 7.1 White-space and Unmet-Need Assessment

 遠端桌面軟體市場規模、佔有率、成長率、全球產業分析、區域趨勢及2026年至2034年預測
 桌面虛擬化市場-2026-2032年全球市場預測
 桌面虛擬化:市場佔有率分析、產業趨勢與統計、成長預測(2026-2031)
 桌面虛擬化市場報告:按類型、組件、組織規模、行業垂直領域和地區分類(2026-2034 年)
 2026年全球遠端桌面軟體市場報告2026年全球桌面虛擬化市場報告
 遠端桌面軟體市場分析及預測(至2035年):按類型、產品類型、服務、技術、組件、應用、部署類型、最終用戶和功能分類
 桌面虛擬化市場-全球產業規模、佔有率、趨勢、機會與預測:桌面交付平台、部署模式、終端用戶供應商、區域和競爭格局,2021-2031年遠端桌面軟體市場 - 全球產業規模、佔有率、趨勢、機會及預測(按部署方式、組織規模、技術、最終用戶、地區和競爭格局分類,2021-2031年)日本桌面虛擬化市場報告(按元件、類型(虛擬桌面基礎架構、桌面即服務、遠端桌面服務)、組織規模、產業垂直領域和地區分類,2026-2034 年)