


 |
市場調查報告書
商品編碼
2073443
桌面虛擬化:市場佔有率分析、產業趨勢與統計、成長預測(2026-2031)Desktop Virtualization - Market Share Analysis, Industry Trends & Statistics, Growth Forecasts (2026 - 2031) |
||||||

※ 本網頁內容可能與最新版本有所差異。詳細情況請與我們聯繫。
根據 Mordor Intelligence 估計,桌面虛擬化市場在 2026 年的價值為 136.4 億美元,預計在預測期(2026-2031 年)內將以 8.53% 的複合年成長率成長,到 2031 年達到 205.4 億美元。
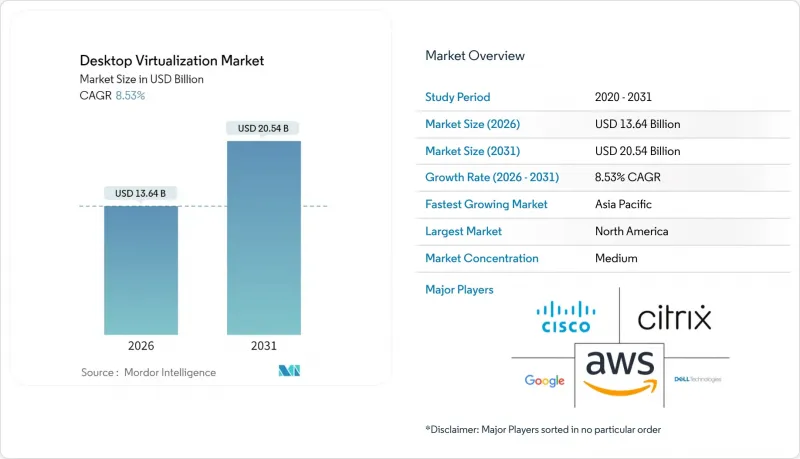
本報告按桌面交付平台(託管虛擬桌面、託管共用桌面、桌面即服務)、部署類型(本地部署、雲端部署)、最終用戶行業(金融服務、醫療保健、零售和電子商務等)、組織規模(中小企業、大型企業)和地區進行細分。市場預測以美元計價。
全球桌面虛擬化市場趨勢與洞察
自備設備辦公室 (BYOD) 政策的激增。
企業在推行自帶設備辦公室 (BYOD) 計劃以降低硬體成本並支持混合辦公模式的同時,也面臨著未受管理的終端設備會將企業資產暴露於惡意軟體和資料外洩的風險之中。美國國家標準與技術研究院 (NIST) 特別出版刊物800-46 Rev. 3 呼籲聯邦機構在啟動虛擬桌面基礎架構 (VDI) 會話之前執行設備健康檢查,私營企業的首席資訊安全(CISO) 也正在採納這一建議,以滿足網路保險的要求。桌面虛擬化透過僅向個人設備傳輸像素數據,在敏感工作負載和消費者作業系統之間創建了空氣間隙。摩根大通計劃在 2025 年之前為 6 萬名交易員部署 VDI,使他們能夠在員工在家辦公的同時,將演算法模型保留在資料中心內。隨著零信任框架的日趨成熟,在會話啟動前驗證設備健康狀況和使用者身分的條件存取策略正在加速桌面虛擬化在市場上的普及。
雲端託管桌面和桌面即服務 (DaaS) 的快速普及。
雲端原生虛擬桌面基礎架構 (VDI) 正在取代本機部署。這是因為 IT 團隊不再需要預測尖峰時段容量,而這項工作過去多年來一直不可或缺。傳統的預測方法會導致硬體閒置和效能瓶頸。 Azure 虛擬桌面和 AWS WorkSpaces 於 2025 年推出了自動擴充功能,使其能夠在平均會話密度超過 80% 時,在 90 秒內啟動額外的運算資源。像西門子這樣的公司透過將 200 個區域 VDI叢集整合到三個 Azure 區域並取消資料中心租賃協議,每年節省了 1,800 萬歐元(1,944 萬美元)。多重雲端部署現在已成為避免廠商鎖定的有效手段,三分之一的公司為了滿足資料主權法規的要求,在兩個或多個超大規模資料中心業者資料中心上運行桌面。
本地部署的VDI基礎設施初始成本高昂
建立內部虛擬桌面基礎架構 (VDI) 堆疊需要虛擬機器管理程式授權、共用儲存陣列和支援 GPU 的伺服器,在網路升級之前,每個使用者的成本可能超過 2,500 美元。企業需要 N+1 冗餘才能在硬體故障的情況下維持服務,這實際上會使伺服器支出翻倍。超融合解決方案雖然降低了複雜性,但仍需要資本投入,而中小企業 (SME) 很難在續約週期內攤銷這些成本。因此,許多中小企業更傾向於桌面即服務 (DaaS) 訂閱,這種訂閱方式將基礎設施、補丁和支援打包到月費中,從而改變了成本曲線並減少了本地設備的支出。
細分市場分析
2025年,託管虛擬桌面佔了45.92%的市場收入,但桌面即服務 (DaaS) 桌面虛擬化市場預計到2031年將以11.52%的年均成長率成長。透過雲端交付的桌面無需管理虛擬機器管理程序,同時允許管理員對所有會話應用相同的安全標準。微軟在2025年將Azure虛擬桌面與Intune整合,實現了實體端點與虛擬端點之間的策略繼承。零售等具有顯著季節性波動的行業,在假日期間用戶數量會增加300%,而託管共用伺服器無法應對這種情況。另一方面,股票交易對低延遲的要求仍然使得靠近交易所引擎的私有VDI叢集的使用成為必要。 Citrix的一份報告指出,68%的本地部署客戶在高度監管的細分市場中運營,這表明混合環境的共存將在預測期內持續存在。以 VMware Horizon Cloud Next-Gen 為代表的新型容器交付模式,透過 HTML5 瀏覽器串流使用 Docker 打包的 Windows 應用程式,進一步模糊了界限。
在標準化工作負載普遍存在的學術研究機構和客服中心,託管共用桌面正經歷利基市場的成長。桌面即服務 (DaaS) 消除了困擾共用伺服器的管理限制,使承包商能夠安裝專案特定的插件而不會影響相鄰會話。透過共享 GPU 資源,雲端託管桌面可以為設計師提供僅在渲染期間保留的 4GB 記憶體切片,從而降低閒置期間的額外成本。供應商正在銷售產業專用的捆綁包,例如包含彭博終端和審計日誌功能的金融 DaaS 包,其價格比通用許可證高出 20%。因此,桌面虛擬化市場在產品方面持續多元化發展,而非趨向於單一架構。
到 2025 年,雲端運算將佔據 60.44% 的市場佔有率,隨著超大規模資料中心業者實現 70-80% 的 CPU 使用率,其在桌面虛擬化市場的佔有率預計將進一步擴大。工作站的配置時間已接近 10 分鐘,遠超本地部署所需的 3 天前置作業時間。 AWS 於 2025 年推出了售價 195 美元的 WorkSpaces Thin Client,可直接啟動至雲端會話,並降低邊緣裝置的 Windows 授權成本。儘管數據引力使得地震建模和基因組分析等工作負載仍需在本地部署,但即使在這些領域,混合配置的實驗也正在進行中,旨在為外包供應商提供安全的雲端桌面。超融合設備透過將運算、儲存和網路整合到橫向擴展節點中,降低了運維負擔,與傳統 SAN 相比,五年內的總擁有成本降低了 28%。
由於歐洲 GDPR 的本地化條款,許多公司正在遷移到託管在其區域邊界內的私有雲端,儘管全球遷移趨勢如此,但對本地部署解決方案的投資仍在繼續。 Nutanix AHV 7.0 新增了動態 GPU 分配功能,可實現工作負載整合並延緩硬體升級。在邊緣工廠中,本地節點仍然至關重要,因為必須將到生產車間機器人的往返延遲控制在 10 毫秒以下。然而,AWS、Azure 和 Google Cloud 正在部署城域邊緣區域,在都會區內提供關鍵服務,這削弱了私有叢集延遲的必要性。在預測期內,大多數組織可能會為高階主管部署本地持久桌面,而為臨時員工按需使用雲端席位。這代表著一種基於實際考量而非理念的採用轉變。
區域分析
北美地區受惠於早期混合辦公模式的推廣和充足的雲端預算,預計到2025年將以37.21%的市場佔有率引領市場。目前,隨著市場需求從新部署轉向許可證續約和容量調整,成長速度有所放緩。區域供應商正透過FedRAMP High和StateRAMP認證來提升自身競爭力,從而贏得公共部門的合約。
亞太地區預計將以13.26%的複合年成長率成長,成為全球成長最快的地區。中國的《資料安全法》強制要求資料儲存在國內,迫使跨國公司部署本地虛擬桌面基礎架構(VDI)叢集,而不是透過海外區域路由會話。印度「數位印度」計畫的資金正在擴展光纖網路和超大規模資料中心,這是在教育機構和地方政府診所進行大規模部署的先決條件。中國移動等通訊業者提供的邊緣節點將往返延遲降低到20毫秒以下,使得GPU密集型編輯套件能夠在雲端運行,幾乎感覺不到延遲。
在歐洲,虛擬桌面基礎架構(VDI)的普及持續穩定地推進。 GDPR的在地化規則正在加速私有雲端雲和主權雲的使用。根據CISPE預測,2025年,62%的企業將在成員國境內執行VDI。中東各國政府正投資建置國家雲端基礎設施,沙烏地阿拉伯公共投資基金(PIF)已撥款64億美元用於建置託管政府桌面的資料中心。由於寬頻成本和稅收導致整體擁有成本(TCO)較高,南美和非洲的VDI發展仍處於起步階段。但巴西和肯亞的5G固定無線試點計畫表明,到2028年,VDI市場可能迎來轉機。對跨國公司而言,桌面虛擬化市場正從單一的全球部署結構分散為由資料居住法定義的區域性孤島。
其他好處:
- Excel格式的市場預測(ME)表
- 3個月的分析師支持
目錄
第1章:引言
- 研究假設和市場定義
- 調查範圍
第2章:調查方法
第3章執行摘要
第4章 市場狀況
- 市場概覽
- 市場促進因素
- 自備設備辦公室 (BYOD) 政策的激增
- 雲端桌面和桌面即服務 (DaaS) 的快速普及
- 對集中式安全和合規性的需求
- 透過GPU虛擬化降低CAD/CAE用戶的成本
- 利用邊緣運算部署低延遲虛擬桌面基礎架構
- 資料居住法規促進了國內虛擬桌面基礎架構的發展。
- 市場限制因素
- 本地部署的 VDI 基礎架構初始部署成本高昂
- 網路延遲和頻寬限制
- 複雜的多會話作業系統授權模式
- 基於 ARM 的終端設備中 GPU 直通的局限性
- 產業價值鏈分析
- 監理情勢
- 技術展望
- 波特五力分析
第5章 市場規模與成長預測
- 透過桌面交付平台
- 託管虛擬桌面 (HVD)
- 託管共用桌面 (HSD)
- 桌面即服務 (DaaS) / 其他形式
- 不同的發展
- 現場
- 雲
- 按最終用戶行業分類
- 金融服務
- 衛生保健
- 零售與電子商務
- 製造業
- 資訊科技/通訊
- 政府/公共部門
- 教育
- 其他終端用戶產業
- 按組織規模
- 中小企業
- 大公司
- 按地區
- 北美洲
- 美國
- 加拿大
- 墨西哥
- 南美洲
- 巴西
- 阿根廷
- 其他南美國家
- 歐洲
- 德國
- 英國
- 法國
- 義大利
- 西班牙
- 其他歐洲國家
- 亞太地區
- 中國
- 日本
- 印度
- 韓國
- ASEAN
- 其他亞太國家
- 中東
- 沙烏地阿拉伯
- 阿拉伯聯合大公國
- 其他中東國家
- 非洲
- 南非
- 奈及利亞
- 其他非洲國家
- 北美洲
第6章 競爭情勢
- 市場集中度
- 策略趨勢
- 市佔率分析
- 公司簡介
- Amazon Web Services, Inc.
- Citrix Systems, Inc.
- Cisco Systems, Inc.
- Dell Technologies Inc.
- Google LLC
- Fujitsu Limited
- Hewlett-Packard Inc.
- Huawei Technologies Co., Ltd.
- IGEL Technology GmbH
- Leostream Corporation
- Microsoft Corporation
- NEC Corporation
- Nutanix, Inc.
- NComputing Co., Ltd.
- Oracle Corporation
- Parallels International GmbH
- Red Hat, Inc.
- Sangfor Technologies Inc.
- Scale Computing, Inc.
- Stratodesk Corporation
- Tencent Cloud Computing(Beijing)Co., Ltd.
- Omnissa LLC
- VMware, Inc.
第7章 市場機會與未來展望
According to Mordor Intelligence, the desktop virtualization market size is estimated at USD 13.64 billion in 2026, and is expected to reach USD 20.54 billion by 2031, at a CAGR of 8.53% during the forecast period (2026-2031).
This report is Segmented by Desktop Delivery Platform (Hosted Virtual Desktop, Hosted Shared Desktop, and Desktop-As-A-Service), Deployment (On-Premises, and Cloud), End-User Vertical (Financial Services, Healthcare, Retail and E-Commerce, and More), Organization Size (Small and Medium Enterprises (SMEs), and Large Enterprises), and Geography. The Market Forecasts are Provided in Terms of Value (USD).
Global Desktop Virtualization Market Trends and Insights
Surge in Bring-Your-Own-Device Policies
Organizations have embedded BYOD programs to reduce hardware outlay and support hybrid work, yet unmanaged endpoints expose corporate assets to malware and data exfiltration. NIST Special Publication 800-46 Rev. 3 urged federal agencies to conduct device-posture checks before launching VDI sessions, a recommendation private-sector chief information security officers adopted to satisfy cyber-insurance requirements. By streaming only pixel data to personal devices, desktop virtualization creates an air gap between sensitive workloads and consumer operating systems. JPMorgan Chase delivered VDI to 60,000 traders in 2025, enabling algorithmic models to remain within data-center enclaves while employees worked from home networks. As zero-trust frameworks mature, conditional-access policies that verify device health and user identity before session launch are accelerating desktop virtualization market adoption.
Rapid Adoption of Cloud-Hosted Desktops and DaaS
Cloud-native VDI displaces on-premises builds because IT teams no longer forecast peak capacity years ahead, a practice that created stranded hardware or performance bottlenecks. Azure Virtual Desktop and AWS WorkSpaces introduced autoscaling in 2025, spinning up additional compute within 90 seconds once average session density crosses 80%. Enterprises such as Siemens consolidated 200 regional VDI clusters into three Azure regions, eliminating data-center leases and saving EUR 18 million (USD 19.44 million) annually. Multi-cloud deployment is now a hedge against vendor lock-in, with one-third of enterprises running desktops across two or more hyperscalers to meet data-sovereignty rules.
High Upfront Cost of On-Premises VDI Infrastructure
Building an in-house VDI stack demands hypervisor licenses, shared storage arrays, and GPU-ready servers that can exceed USD 2,500 per user before networking upgrades. Enterprises must provision N+1 redundancy to preserve service during hardware failures, effectively doubling server spend. Hyper-converged alternatives reduce complexity yet still require capital that smaller firms struggle to amortize over refresh cycles. Consequently, many SMEs favor Desktop-as-a-Service subscriptions that bundle infrastructure, patching, and support into monthly fees, shifting the cost curve and drawing spend away from on-premises equipment.
Other drivers and restraints analyzed in the detailed report include:
- Need for Centralized Security and Compliance
- Cost Savings from GPU Virtualization for CAD/CAE Users
- Network Latency and Bandwidth Constraints
For complete list of drivers and restraints, kindly check the Table Of Contents.
Segment Analysis
Hosted Virtual Desktop retained 45.92% of 2025 market revenue, yet the desktop virtualization market size for Desktop-as-a-Service is projected to grow at an annual rate of 11.52% to 2031. Cloud-provisioned desktops eliminate the need for hypervisor management while enabling administrators to enforce identical security baselines on every session. Microsoft integrated Azure Virtual Desktop with Intune in 2025, allowing policy inheritance between physical and virtual endpoints. Seasonal sectors, such as retail, scale seat counts by 300% during holidays, a use case that hosted shared servers cannot match. At the same time, low-latency demands in equities trading still justify the use of private VDI clusters located near exchange engines. Citrix reported 68% of on-premises customers operated in regulated niches, illustrating that hybrid coexistence will persist well into the forecast horizon. Emerging container delivery models, notably VMware Horizon Cloud Next-Gen, blur boundaries further by streaming Docker-packed Windows apps through HTML5 browsers.
Hosted Shared Desktop finds niche growth in academic labs and call centers where standardized workloads prevail. Desktop-as-a-Service (DaaS) removes administrator restrictions that plagued shared servers, allowing contractors to install project-specific plugins without jeopardizing neighboring sessions. GPU-fractionalization now lets cloud-hosted desktops serve designers with 4 GB slices reserved only during rendering, shrinking idle overspend. Vendors market vertical bundles, such as financial DaaS packages that embed Bloomberg terminals and audit logging, commanding 20% premiums over generic seats. Consequently, the desktop virtualization market continues to diversify delivery formats rather than converging on a single architecture.
Cloud held 60.44% of market value in 2025, and its desktop virtualization market share will deepen as hyperscalers achieve 70-80% CPU utilization. Ten-minute workstation provisioning is eclipsing the three-day lead time for on-premises builds. AWS launched a USD 195 WorkSpaces Thin Client in 2025 that boots directly into a cloud session and removes Windows license costs on edge devices. Data gravity keeps seismic modeling and genomic workloads on-premises, but even these sectors experiment with hybrid setups that reserve cloud desktops for contractors. Hyper-converged appliances reduce operational drag by bundling compute, storage, and networking into scale-out nodes, trimming five-year ownership costs by 28% compared with traditional SANs.
Europe's GDPR localization clause steers many enterprises toward private clouds hosted inside regional borders, sustaining on-premises investment despite global migration patterns. Nutanix AHV 7.0 added dynamic GPU assignment, consolidating workloads and postponing hardware refreshes. For edge factories requiring sub-10 ms round-trip to shop-floor robots, local nodes remain indispensable. However, AWS, Azure, and Google Cloud are deploying metro-edge zones that bring core services within city limits, undermining latency arguments for private clusters. Over the forecast horizon, most organizations will run persistent desktops on-premises for executives while bursting cloud seats for contingent staff, illustrating a pragmatic rather than ideological deployment split.
Complete Report Scope:
- By Desktop Delivery Platform
- Hosted Virtual Desktop (HVD)
- Hosted Shared Desktop (HSD)
- Desktop-as-a-Service (DaaS)/Other Forms
- By Deployment
- On-Premises
- Cloud
- By End-User Vertical
- Financial Services
- Healthcare
- Retail and E-commerce
- Manufacturing
- IT and Telecom
- Government and Public Sector
- Education
- Other End-Use Verticals
- By Organization Size
- Small and Medium Enterprises (SMEs)
- Large Enterprises
- By Geography
- North America
- United States
- Canada
- Mexico
- South America
- Brazil
- Argentina
- Rest of South America
- Europe
- Germany
- United Kingdom
- France
- Italy
- Spain
- Rest of Europe
- Asia-Pacific
- China
- Japan
- India
- South Korea
- ASEAN
- Rest of Asia-Pacific
- Middle East
- Saudi Arabia
- United Arab Emirates
- Rest of Middle East
- Africa
- South Africa
- Nigeria
- Rest of Africa
- North America
Geography Analysis
North America led 2025 revenue at 37.21% due to early hybrid-work mandates and substantial cloud budgets. Growth is now moderating as deployments shift from greenfield to license renewals and capacity tweaks. Regional vendors differentiate through FedRAMP High and StateRAMP certifications that unlock public-sector contracts.
Asia Pacific is projected to post a 13.26% CAGR, the fastest worldwide. China's Data Security Law compels in-country data storage, pushing multinationals to deploy local VDI clusters rather than route sessions through foreign regions. India's Digital India funding is expanding fiber networks and hyperscale data centers, prerequisites for mass rollouts in education and municipal health clinics. Edge nodes from carriers such as China Mobile cut round-trip latency below 20 ms, enabling GPU-intensive editing suites to run in the cloud without perceptible lag.
Europe remains a steady adopter. GDPR localization rules encourage private or sovereign clouds; 62% of enterprises operated VDI inside member-state borders in 2025, according to CISPE. Middle East governments invest in national-cloud infrastructure, with Saudi Arabia's Public Investment Fund allocating USD 6.4 billion for data centers to host government desktops. South America and Africa remain nascent because broadband costs and taxation schemes inflate total cost of ownership, but 5G fixed-wireless pilots in Brazil and Kenya signal a potential inflection by 2028. For multinationals, the desktop virtualization market is fragmenting into regional silos governed by data-residency laws rather than a single global deployment footprint.
- Amazon Web Services, Inc.
- Citrix Systems, Inc.
- Cisco Systems, Inc.
- Dell Technologies Inc.
- Google LLC
- Fujitsu Limited
- Hewlett-Packard Inc.
- Huawei Technologies Co., Ltd.
- IGEL Technology GmbH
- Leostream Corporation
- Microsoft Corporation
- NEC Corporation
- Nutanix, Inc.
- NComputing Co., Ltd.
- Oracle Corporation
- Parallels International GmbH
- Red Hat, Inc.
- Sangfor Technologies Inc.
- Scale Computing, Inc.
- Stratodesk Corporation
- Tencent Cloud Computing (Beijing) Co., Ltd.
- Omnissa LLC
- VMware, Inc.
Additional Benefits:
- The market estimate (ME) sheet in Excel format
- 3 months of analyst support
TABLE OF CONTENTS
1 INTRODUCTION
- 1.1 Study Assumptions and Market Definition
- 1.2 Scope of the Study
2 RESEARCH METHODOLOGY
3 EXECUTIVE SUMMARY
4 MARKET LANDSCAPE
- 4.1 Market Overview
- 4.2 Market Drivers
- 4.2.1 Surge in Bring-Your-Own-Device (BYOD) Policies
- 4.2.2 Rapid Adoption of Cloud-hosted Desktops and DaaS
- 4.2.3 Need for Centralized Security and Compliance
- 4.2.4 Cost Savings from GPU Virtualization for CAD/CAE Users
- 4.2.5 Edge-computing-enabled Low-latency VDI Roll-outs
- 4.2.6 Data-residency Regulations Spurring in-country VDI
- 4.3 Market Restraints
- 4.3.1 High Upfront Cost of On-premises VDI Infrastructure
- 4.3.2 Network Latency and Bandwidth Constraints
- 4.3.3 Complex Multi-session OS Licensing Models
- 4.3.4 Limited GPU Passthrough on ARM-based Endpoints
- 4.4 Industry Value Chain Analysis
- 4.5 Regulatory Landscape
- 4.6 Technological Outlook
- 4.7 Porter's Five Forces Analysis
- 4.7.1 Bargaining Power of Suppliers
- 4.7.2 Bargaining Power of Buyers
- 4.7.3 Threat of New Entrants
- 4.7.4 Threat of Substitutes
- 4.7.5 Intensity of Competitive Rivalry
5 MARKET SIZE AND GROWTH FORECASTS (VALUE)
- 5.1 By Desktop Delivery Platform
- 5.1.1 Hosted Virtual Desktop (HVD)
- 5.1.2 Hosted Shared Desktop (HSD)
- 5.1.3 Desktop-as-a-Service (DaaS)/Other Forms
- 5.2 By Deployment
- 5.2.1 On-Premises
- 5.2.2 Cloud
- 5.3 By End-User Vertical
- 5.3.1 Financial Services
- 5.3.2 Healthcare
- 5.3.3 Retail and E-commerce
- 5.3.4 Manufacturing
- 5.3.5 IT and Telecom
- 5.3.6 Government and Public Sector
- 5.3.7 Education
- 5.3.8 Other End-Use Verticals
- 5.4 By Organization Size
- 5.4.1 Small and Medium Enterprises (SMEs)
- 5.4.2 Large Enterprises
- 5.5 By Geography
- 5.5.1 North America
- 5.5.1.1 United States
- 5.5.1.2 Canada
- 5.5.1.3 Mexico
- 5.5.2 South America
- 5.5.2.1 Brazil
- 5.5.2.2 Argentina
- 5.5.2.3 Rest of South America
- 5.5.3 Europe
- 5.5.3.1 Germany
- 5.5.3.2 United Kingdom
- 5.5.3.3 France
- 5.5.3.4 Italy
- 5.5.3.5 Spain
- 5.5.3.6 Rest of Europe
- 5.5.4 Asia-Pacific
- 5.5.4.1 China
- 5.5.4.2 Japan
- 5.5.4.3 India
- 5.5.4.4 South Korea
- 5.5.4.5 ASEAN
- 5.5.4.6 Rest of Asia-Pacific
- 5.5.5 Middle East
- 5.5.5.1 Saudi Arabia
- 5.5.5.2 United Arab Emirates
- 5.5.5.3 Rest of Middle East
- 5.5.6 Africa
- 5.5.6.1 South Africa
- 5.5.6.2 Nigeria
- 5.5.6.3 Rest of Africa
- 5.5.1 North America
6 COMPETITIVE LANDSCAPE
- 6.1 Market Concentration
- 6.2 Strategic Moves
- 6.3 Market Share Analysis
- 6.4 Company Profiles (includes Global level Overview, Market Level Overview, Core Segments, Financials as Available, Strategic Information, Market Rank/Share for Key Companies, Products and Services, and Recent Developments)
- 6.4.1 Amazon Web Services, Inc.
- 6.4.2 Citrix Systems, Inc.
- 6.4.3 Cisco Systems, Inc.
- 6.4.4 Dell Technologies Inc.
- 6.4.5 Google LLC
- 6.4.6 Fujitsu Limited
- 6.4.7 Hewlett-Packard Inc.
- 6.4.8 Huawei Technologies Co., Ltd.
- 6.4.9 IGEL Technology GmbH
- 6.4.10 Leostream Corporation
- 6.4.11 Microsoft Corporation
- 6.4.12 NEC Corporation
- 6.4.13 Nutanix, Inc.
- 6.4.14 NComputing Co., Ltd.
- 6.4.15 Oracle Corporation
- 6.4.16 Parallels International GmbH
- 6.4.17 Red Hat, Inc.
- 6.4.18 Sangfor Technologies Inc.
- 6.4.19 Scale Computing, Inc.
- 6.4.20 Stratodesk Corporation
- 6.4.21 Tencent Cloud Computing (Beijing) Co., Ltd.
- 6.4.22 Omnissa LLC
- 6.4.23 VMware, Inc.
7 MARKET OPPORTUNITIES AND FUTURE OUTLOOK
- 7.1 White-space and Unmet-Need Assessment

 桌面虛擬化市場報告:按類型、組件、組織規模、行業垂直領域和地區分類(2026-2034 年)
 桌面虛擬化市場:按組件、部署模式、技術類型、組織規模和產業分類-2026年至2032年全球市場預測
 2026年全球遠端桌面軟體市場報告2026年全球桌面虛擬化市場報告
 遠端桌面軟體市場分析及預測(至2035年):按類型、產品類型、服務、技術、組件、應用、部署類型、最終用戶和功能分類
 遠端桌面軟體市場規模、佔有率、成長及全球產業分析:依部署類型、企業類型、最終用戶和地區劃分的洞察與預測(2026-2034 年)
 桌面虛擬化市場-全球產業規模、佔有率、趨勢、機會與預測:桌面交付平台、部署模式、終端用戶供應商、區域和競爭格局,2021-2031年遠端桌面軟體市場 - 全球產業規模、佔有率、趨勢、機會及預測(按部署方式、組織規模、技術、最終用戶、地區和競爭格局分類,2021-2031年)日本桌面虛擬化市場報告(按元件、類型(虛擬桌面基礎架構、桌面即服務、遠端桌面服務)、組織規模、產業垂直領域和地區分類,2026-2034 年)
 遠端桌面軟體市場規模、佔有率和成長分析(按部署類型、企業規模、最終用戶和地區分類)-2026-2033年產業預測