


 |
市場調查報告書
商品編碼
2097326
排碳權:市場佔有率分析、產業趨勢與統計、成長預測(2026-2031)Carbon Credit - Market Share Analysis, Industry Trends & Statistics, Growth Forecasts (2026 - 2031) |
||||||

※ 本網頁內容可能與最新版本有所差異。詳細情況請與我們聯繫。
根據 Mordor Intelligence 預測,排碳權市場規模將從 2025 年的 5.13 兆美元,2026 年至 2031 年的年複合成長率(CAGR)為 32.32%。
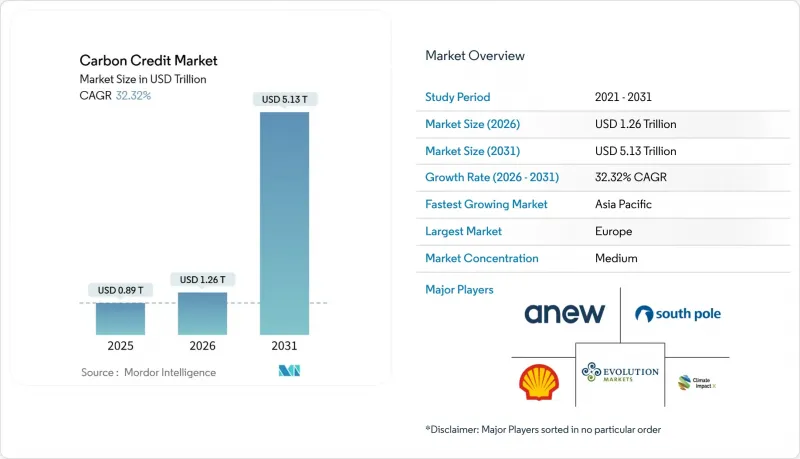
本報告按類型(合規碳市場、自願碳市場)、信用類型(可再生能源認證、林業和土地利用抵銷等)、交易類型(現貨、期貨和遠期)、最終用戶(能源和公共產業等)以及地區(北美、歐洲、亞太、南美、中東和非洲)進行細分。市場預測以美元計價。
全球排碳權市場趨勢及洞察
新興經濟體中基於合規性的排放交易體系(ETS)的擴展
2025年,中國已將鋼鐵、鋁和水泥納入其國家排放交易體系(ETS),涵蓋80億噸二氧化碳當量(tCO2e),約佔該國國內排放量的60-65%。碳價設定為每噸二氧化碳60-70元人民幣,由此建立了全球最大的碳權市場。印度計畫於2026年啟動全國性市場,印尼於2025年啟動了燃煤電廠的試點項目,這表明東協各國將受到波及。阿拉伯聯合大公國已推出自願性框架,沙烏地阿拉伯已撥款100億美元用於碳抵銷項目,而海灣國家則將自身定位為碳市場的買家和供應商。儘管流動性仍低於歐盟排放交易體系(EU ETS),但預計到2030年,這些體系的排放總合總和將超過30-40億噸二氧化碳當量,擴大排碳權市場。根據《條約》第 6 條,跨國貿易也在加速發展,到 2025 年底,已記錄在案的雙邊協定有 99 項,計畫項目有 1,000 多個。
企業淨零排放承諾正在加速對可變化學製造 (VCM) 的需求。
超過1萬家公司承諾在2025年實現淨零排放,其中5,000多家公司正在透過科學碳目標計劃(SBTi)接受檢驗。該檢驗要求在溫室氣體減量1.5度C的路徑上,每年減量4.2%。 2025年2月推出的淨零排放V2框架納入了持續排放責任的概念,正式認可了在目標實現路徑上事後獲得的碳權額度。這項政策轉變促使自願性碳權額度兌換量增加,到2025年達到2.11億噸二氧化碳當量,較去年同期成長9%。碳移除信用額度(包括直接空氣捕獲、生物炭和增強風化)的價格為每噸二氧化碳100至300美元,比傳統的碳排放抵消額度溢價20至60倍,這反映了買家對永久性的重視。此外,誠信委員會將在 2024 年底前認證 4 億份信用額度,使 CCP 標記的信用額度在 2025 年佔總量的比例從 3% 提高到 7%。這凸顯了向更可靠的信用供應模式的轉變。
低品質信貸供應過剩會削弱買家信心。
預計2020年之前發行的傳統可再生能源和炊具碳權額度在2025年進入市場時的價格將低於每噸二氧化碳5美元,這將對額外性評估產生負面影響。根據BeZero Carbon的評級,C評級信用額度的交易價格僅為BBB+級項目的六分之一。殼牌公司已加大對碳移除的投入,將其碳權額度攤銷額度從2024年的1400萬噸二氧化碳當量減少到2025年的975萬噸二氧化碳當量。在2024年發行的6.5億份碳權額度中,只有4億份獲得了誠信委員會的認證,而未認證的碳權額度則難以找到買家。因此,如果排碳權價格跌破每噸二氧化碳10美元,開發商將面臨更長的投資回收期,並推遲啟動新的森林管理和可再生能源專案。市場信心取決於評級系統和第三方審計的快速發展,以區分產品品質。
細分市場分析
預計到2025年,合規交易方案將佔總交易量的98.22%,主要驅動力來自歐盟排放交易體系(EU ETS)和中國80億噸二氧化碳當量(tCO2e)的排放上限。交易所流動性促進了積極的對沖交易,洲際交易所(ICE)同年清算了2,090萬份環境相關合約。同時,自願交易市場也呈現強勁成長,年複合成長率達42.15%,這得益於科學碳舉措計劃(SBTi)允許事後獲得碳權額,以及範圍3排放方面日益成長的壓力。這種成長正在逐步縮小合規市場和自願市場之間傳統的差距。
隨著航空公司採購合格CORSIA 標準的碳排放單元並滿足對帶有完整性標籤的碳移除的需求,價格預計將趨於一致。這一趨勢正促使自願性碳權發行機構採用合規性監測、報告和檢驗(MRV) 標準。如果成功,這種價格趨同可能會擴大排碳權市場,使能夠同時滿足合規性和自願性體係要求的專案開發商受益。
預計到2025年,可再生能源證書將佔市場佔有率的41.8%,但由於對額外性的質疑,其價格仍低於每噸二氧化碳5美元。林業和土地利用碳權額預計將以39.2%的複合年成長率成長,受益於生物多樣性帶來的次要效益以及合格國際碳減排計劃(CORSIA)的資格,但投資者仍然擔憂反向風險。新興的吸收技術雖然成本高昂,但符合全球品牌所重視的永久性標準,並預示著儘管初期供應受限,但未來可能會出現向高度一致的碳單位的長期轉變。
到2025年,保險覆蓋率預計將擴大到林業碳權額發行量的5%至10%,而基於衛星的MRV(測量、報告和檢驗)技術正在顯著降低檢驗成本,從而吸引機構投資者。由於二氧化碳移除碳權額的溢價在每噸100美元至300美元之間,自然移除和人工移除的市場佔有率預計將會擴大,這將影響各註冊機構的價格走勢。
區域分析
預計到2025年,歐洲將佔76.1%的市場佔有率,凸顯了歐盟排放交易體系(EU ETS)的影響。該體系規定了4.3%的年度排放上限。此外,市場穩定儲備也進一步收緊了供應,從而為該體系提供了支持。預計到2026年,歐盟排放權的平均價格將在每噸二氧化碳84歐元至93歐元(96.04美元至106.33美元)之間,這將推動洲際交易所(ICE)和歐洲交易所(EEX)的流動性達到歷史新高。此外,碳邊境調節機制(CBAM)將內部碳成本應用於進口,進一步鞏固了該地區的價格主導。自願性排碳權贖回量已達到5,000萬噸二氧化碳,這主要得益於總部位於倫敦、蘇黎世和阿姆斯特丹的公司為適應《企業永續性報告指令》(CSRD)所採取的行動。
預計到2031年,亞太地區的複合年成長率將達到38.7%。這主要得益於中國的擴大排放交易體系(ETS),該體系設定了80億噸二氧化碳當量(tCO2e)的上限,價格為每噸二氧化碳60-70元人民幣(約8.83-10.30美元)。印度正準備於2026年啟動其國家排放交易體系。其他進展包括韓國的K-ETS、印尼的試驗計畫以及新興的雙邊「第六條」交易,這些共同構成了一個多市場生態系統。為支持這一成長,交易基礎設施也在不斷發展;Xpansiv將於2026年2月與澳門交易所合作建立區域基準,而AirCarbon交易所則瞄準了航空領域的買家。
在北美,透過加州的總量管制與交易體系、區域溫室氣體舉措(RGGI)和加拿大的後備機制等項目,設定了2025年二氧化碳排放上限約為5億噸,價格在每噸二氧化碳15至35美元之間。節點交易所的排放排放權結算量創歷史新高,反映出避險交易參與度的提高。同時,拉丁美洲、中東和非洲仍處於市場發展的早期階段,但卻是重要的碳抵銷供應來源。巴西計畫中的排放交易體系(ETS)和沙烏地阿拉伯100億美元的專案基金可望擴大基於自然的碳權額度的創造,並將其出口到歐洲和亞洲的合規買家。
其他好處:
- Excel格式的市場預測(ME)表
- 3個月的分析師支持
目錄
第1章:引言
- 研究假設和市場定義
- 調查範圍
第2章:調查方法
第3章執行摘要
第4章 市場狀況
- 市場概覽
- 市場促進因素
- 新興市場基於合規性的排放交易體系(ETS)的擴展
- 企業淨零排放承諾正加速對VCM的需求。
- 擴大碳定價機制與提高排放權價格
- 透過數位化MRV和區塊鏈技術提高信用資訊的透明度。
- 範圍 3 的資訊揭露要求正在推動對移除抵免的需求。
- CORSIA 第二階段加強的法規正在促進和推廣基於自然的信用額度。
- 市場限制因素
- 低品質信貸供應過剩正在削弱買家信心。
- 全球標準差異及重複累計的風險
- 圍繞CBAM的地緣政治緊張局勢限制了跨國資本流動。
- 對償還義務的擔憂正在對林業貸款產生負面影響。
- 價值鏈分析
- 監理情勢
- 技術展望
- 波特五力模型
第5章 市場規模與成長預測
- 按類型
- 合規碳市場
- 自願性碳市場
- 按信用類型
- 可再生能源證書(REC)
- 林業和土地利用補償
- 能源效率積分
- 工業流程改進
- 按交易類型
- 現貨(實物)
- 期貨/遠期合約
- 最終用戶
- 能源公用事業
- 運輸
- 工業製造
- 農業和林業
- 按地區
- 北美洲
- 美國
- 加拿大
- 墨西哥
- 歐洲
- 德國
- 英國
- 法國
- 義大利
- 北歐國家
- 俄羅斯
- 其他歐洲國家
- 亞太地區
- 中國
- 印度
- 日本
- 韓國
- 東南亞國協
- 其他亞太國家
- 南美洲
- 巴西
- 阿根廷
- 其他南美國家
- 中東和非洲
- 沙烏地阿拉伯
- 阿拉伯聯合大公國
- 南非
- 埃及
- 其他中東和非洲國家
- 北美洲
第6章 競爭情勢
- 市場集中度
- 策略趨勢(併購、聯盟、購電協議)
- 市場佔有率分析(主要公司的市場排名和佔有率)
- 公司簡介
- Anew Climate, LLC
- AirCarbon Pte. Ltd.
- BP Target Neutral
- Carbon Trade Exchange Ltd.
- CBL Markets
- Chevron Environmental Management
- Climate Impact X Pte. Ltd.
- ClimatePartner GmbH
- Core Climate
- European Energy Exchange AG
- Evolution Markets Inc.
- Finite Carbon Corporation
- Gold Standard Foundation
- Intercontinental Exchange, Inc.
- Nasdaq Commodities
- Rearrange Carbon Markets
- Shell Environmental Products
- South Pole Holding AG
- Thallo Inc.
- Xpansiv Holdings, Inc.
第7章 市場機會與未來展望
According to Mordor Intelligence, the carbon credit market size is projected to expand from USD 0.89 trillion in 2025 and USD 1.26 trillion in 2026 to USD 5.13 trillion by 2031, registering a CAGR of 32.32% between 2026 to 2031.
This report is Segmented by Type (Compliance Carbon Market, Voluntary Carbon Market), Credit-Type (Renewable-Energy Certificates, Forestry and Land-Use Offsets, and More), Delivery Type (Spot, Futures/Forwards), End-User (Energy and Utilities, and More), and Geography (North America, Europe, Asia-Pacific, South America, Middle East and Africa). The Market Forecasts are Provided in Terms of Value (USD).
Global Carbon Credit Market Trends and Insights
Expansion of compliance ETS across emerging economies
In 2025, China incorporated steel, aluminum, and cement into its national emissions trading system, covering 8 billion tCO2e, which accounts for approximately 60-65% of its domestic emissions. The carbon prices were set at CNY 60-70 per tCO2, establishing the world's largest compliance market. India is set to launch a nationwide market in 2026, while Indonesia initiated a coal-power pilot in 2025, indicating a ripple effect across ASEAN. The UAE introduced a voluntary framework, and Saudi Arabia allocated USD 10 billion for offset projects, positioning Gulf countries as both buyers and suppliers in the carbon market. Although liquidity remains lower than the EU ETS, the combined caps of these schemes are projected to surpass 3-4 billion tCO2e by 2030, broadening the scope of the carbon credit market. Cross-border trades under Article 6 are gaining momentum, with 99 bilateral agreements and over 1,000 pipeline projects recorded by late 2025.
Corporate net-zero commitments accelerating VCM demand
Over 10,000 companies have pledged to achieve net-zero emissions by 2025, with more than 5,000 obtaining validation from the Science Based Targets initiative. This validation requires annual emissions reductions of 4.2%, aligned with a 1.5 °C pathway. The introduction of the Net Zero V2 framework in February 2025 incorporated the concept of "Ongoing Emissions Responsibility," formally acknowledging ex-post credits within target pathways. This policy shift contributed to an increase in voluntary retirements, reaching 211 million tCO2e in 2025, a 9% year-on-year growth. Removal credits, including those from direct air capture, biochar, and enhanced weathering, are priced at USD 100-300 per tCO2, representing a 20-60 times premium over traditional avoidance offsets, reflecting a buyer preference for permanence. Additionally, the Integrity Council labeled 400 million credits by late 2024, which increased CCP-tagged retirements from 3% to 7% of the total volume in 2025, highlighting a shift toward high-integrity credit supply.
Oversupply of Low-Quality Credits Eroding Buyer Confidence
Legacy renewable energy and cookstove credits issued before 2020 entered the market at prices below USD 5 per tCO2 in 2025, negatively impacting perceptions of additionality. According to BeZero Carbon's ratings, C-graded units are trading at one-sixth the price of BBB+ projects. Shell reduced its retirements from 14 million tCO2e in 2024 to 9.75 million in 2025, shifting its focus toward removals. Of the 650 million credits issued in 2024, only 400 million were labeled by the Integrity Council, leaving unlabeled stock struggling to attract buyers. As a result, developers face extended payback periods when carbon credit prices drop below USD 10 per tCO2, delaying new forestry and renewable energy projects. Market confidence will depend on the rapid expansion of rating systems and third-party audits to distinguish product quality.
Other drivers and restraints analyzed in the detailed report include:
- Rise in carbon pricing mechanisms and higher allowance prices
- Scope 3 Disclosure Mandates Lifting Removal-Credit Demand
- Fragmented Global Standards & Double-Counting Risks
For complete list of drivers and restraints, kindly check the Table Of Contents.
Segment Analysis
In 2025, compliance schemes accounted for 98.22% of the total volume, driven primarily by the EU ETS and China's cap of 8 billion tCO2e. Exchange liquidity facilitated robust hedging activities, with the Intercontinental Exchange clearing 20.9 million environmental contracts during the year. Meanwhile, the voluntary segment demonstrated a strong growth trajectory, with a CAGR of 42.15%, supported by the Science Based Targets initiative (SBTi) recognizing ex-post credits and increasing pressures related to Scope 3 emissions. This growth is gradually reducing the traditional divide between compliance and voluntary markets.
Price convergence appears likely as airlines procure CORSIA-eligible units and integrate demand for integrity-tagged removals. This trend is encouraging voluntary issuers to adopt compliance-grade monitoring, reporting, and verification (MRV) standards. If achieved, successful convergence could expand the carbon credit market for project developers capable of meeting the requirements of both compliance and voluntary regimes.
In 2025, renewable energy certificates accounted for 41.8% of the market share but faced skepticism regarding additionality, which limited prices to below USD 5 per tCO2. Forestry and land-use credits, projected to grow at a 39.2% CAGR, benefit from biodiversity co-benefits and eligibility under CORSIA, although investors remain concerned about reversal risks. Emerging removal technologies, while more expensive, fulfill permanence criteria valued by global brands, indicating a potential long-term shift toward high-integrity units despite initial supply constraints.
Insurance coverage for 5-10% of forestry issuance in 2025 is expanding, while satellite-based MRV significantly reduces verification costs, attracting institutional capital. With premiums for removals ranging from USD 100 to 300 per tCO2, the market share of nature-based and engineered removals is expected to increase, influencing price trends across various registries.
Complete Report Scope:
- By Type
- Compliance Carbon Market
- Voluntary Carbon Market
- By Credit-Type
- Renewable-Energy Certificates (RECs)
- Forestry and Land-Use Offsets
- Energy-Efficiency Credits
- Industrial-Process Improvements
- By Delivery Type
- Spot (Physical)
- Futures / Forwards
- By End-user
- Energy and Utilities
- Transportation
- Industrial Manufacturing
- Agriculture and Forestry
- By Geography
- North America
- United States
- Canada
- Mexico
- Europe
- Germany
- United Kingdom
- France
- Italy
- NORDIC Countries
- Russia
- Rest of Europe
- Asia-Pacific
- China
- India
- Japan
- South Korea
- ASEAN Countries
- Rest of Asia-Pacific
- South America
- Brazil
- Argentina
- Rest of South America
- Middle East and Africa
- Saudi Arabia
- United Arab Emirates
- South Africa
- Egypt
- Rest of Middle East and Africa
- North America
Geography Analysis
Europe's projected 76.1% market share in 2025 highlights the impact of the EU Emissions Trading System (EU ETS), which enforces a 4.3% annual cap reduction. This system is further supported by the Market Stability Reserve, which has tightened supply. Average EU Allowance prices, ranging from EUR 84 to EUR 93 (USD 96.04 to USD 106.33) per tCO2 in 2026, have driven record liquidity on ICE and EEX. Additionally, the Carbon Border Adjustment Mechanism has extended internal carbon costs to imports, solidifying the region's price leadership. Voluntary carbon credit retirements reached 50 million tCO2, primarily from firms based in London, Zurich, and Amsterdam, as they adapt to the Corporate Sustainability Reporting Directive.
The Asia-Pacific region is on track for a 38.7% compound annual growth rate (CAGR) through 2031, driven by China's expanded ETS, which caps 8 billion tCO2e at prices of CNY 60-70 (USD 8.83-10.30) per tCO2. India is preparing to launch its national program in 2026. Other developments include South Korea's K-ETS, Indonesia's pilot program, and emerging bilateral Article 6 trades, which are collectively shaping a multi-market ecosystem. Supporting this growth, exchange infrastructure is evolving, with Xpansiv partnering with Macao Exchange in February 2026 to establish regional benchmarks, and AirCarbon Exchange targeting aviation sector buyers.
North America accounted for approximately 500 million tCO2 of capped emissions in 2025 through programs such as California's cap-and-trade system, the Regional Greenhouse Gas Initiative (RGGI), and Canada's backstop mechanism, with prices ranging from USD 15 to USD 35 per tCO2. Nodal Exchange achieved record allowance clearances, reflecting increased hedge participation. Meanwhile, Latin America, the Middle East, and Africa remain in the early stages of market development but are critical as offset suppliers. Brazil's planned ETS and Saudi Arabia's USD 10 billion project fund have the potential to scale nature-based credit generation for export to compliance buyers in Europe and Asia.
- Anew Climate, LLC
- AirCarbon Pte. Ltd.
- BP Target Neutral
- Carbon Trade Exchange Ltd.
- CBL Markets
- Chevron Environmental Management
- Climate Impact X Pte. Ltd.
- ClimatePartner GmbH
- Core Climate
- European Energy Exchange AG
- Evolution Markets Inc.
- Finite Carbon Corporation
- Gold Standard Foundation
- Intercontinental Exchange, Inc.
- Nasdaq Commodities
- Rearrange Carbon Markets
- Shell Environmental Products
- South Pole Holding AG
- Thallo Inc.
- Xpansiv Holdings, Inc.
Additional Benefits:
- The market estimate (ME) sheet in Excel format
- 3 months of analyst support
TABLE OF CONTENTS
1 Introduction
- 1.1 Study Assumptions & Market Definition
- 1.2 Scope of the Study
2 Research Methodology
3 Executive Summary
4 Market Landscape
- 4.1 Market Overview
- 4.2 Market Drivers
- 4.2.1 Expansion of compliance ETS across emerging economies
- 4.2.2 Corporate net-zero commitments accelerating VCM demand
- 4.2.3 Rise in carbon pricing mechanisms and higher allowance prices
- 4.2.4 Digital MRV & blockchain boosting credit transparency
- 4.2.5 Scope-3 disclosure mandates lifting removal-credit demand
- 4.2.6 CORSIA Phase-2 tightening spurring nature-based credits
- 4.3 Market Restraints
- 4.3.1 Oversupply of low-quality credits eroding buyer confidence
- 4.3.2 Fragmented global standards & double-counting risks
- 4.3.3 Geopolitical CBAM tensions limiting cross-border flows
- 4.3.4 Re-versal liability concerns hurting forestry financing
- 4.4 Value Chain Analysis
- 4.5 Regulatory Landscape
- 4.6 Technological Outlook
- 4.7 Porters Five Forces
- 4.7.1 Threat of New Entrants
- 4.7.2 Bargaining Power of Buyers
- 4.7.3 Bargaining Power of Suppliers
- 4.7.4 Threat of Substitutes
- 4.7.5 Competitive Rivalry
5 Market Size & Growth Forecasts
- 5.1 By Type
- 5.1.1 Compliance Carbon Market
- 5.1.2 Voluntary Carbon Market
- 5.2 By Credit-Type
- 5.2.1 Renewable-Energy Certificates (RECs)
- 5.2.2 Forestry and Land-Use Offsets
- 5.2.3 Energy-Efficiency Credits
- 5.2.4 Industrial-Process Improvements
- 5.3 By Delivery Type
- 5.3.1 Spot (Physical)
- 5.3.2 Futures / Forwards
- 5.4 By End-user
- 5.4.1 Energy and Utilities
- 5.4.2 Transportation
- 5.4.3 Industrial Manufacturing
- 5.4.4 Agriculture and Forestry
- 5.5 By Geography
- 5.5.1 North America
- 5.5.1.1 United States
- 5.5.1.2 Canada
- 5.5.1.3 Mexico
- 5.5.2 Europe
- 5.5.2.1 Germany
- 5.5.2.2 United Kingdom
- 5.5.2.3 France
- 5.5.2.4 Italy
- 5.5.2.5 NORDIC Countries
- 5.5.2.6 Russia
- 5.5.2.7 Rest of Europe
- 5.5.3 Asia-Pacific
- 5.5.3.1 China
- 5.5.3.2 India
- 5.5.3.3 Japan
- 5.5.3.4 South Korea
- 5.5.3.5 ASEAN Countries
- 5.5.3.6 Rest of Asia-Pacific
- 5.5.4 South America
- 5.5.4.1 Brazil
- 5.5.4.2 Argentina
- 5.5.4.3 Rest of South America
- 5.5.5 Middle East and Africa
- 5.5.5.1 Saudi Arabia
- 5.5.5.2 United Arab Emirates
- 5.5.5.3 South Africa
- 5.5.5.4 Egypt
- 5.5.5.5 Rest of Middle East and Africa
- 5.5.1 North America
6 Competitive Landscape
- 6.1 Market Concentration
- 6.2 Strategic Moves (M&A, Partnerships, PPAs)
- 6.3 Market Share Analysis (Market Rank/Share for key companies)
- 6.4 Company Profiles (includes Global level Overview, Market level overview, Core Segments, Financials as available, Strategic Information, Products & Services, and Recent Developments)
- 6.4.1 Anew Climate, LLC
- 6.4.2 AirCarbon Pte. Ltd.
- 6.4.3 BP Target Neutral
- 6.4.4 Carbon Trade Exchange Ltd.
- 6.4.5 CBL Markets
- 6.4.6 Chevron Environmental Management
- 6.4.7 Climate Impact X Pte. Ltd.
- 6.4.8 ClimatePartner GmbH
- 6.4.9 Core Climate
- 6.4.10 European Energy Exchange AG
- 6.4.11 Evolution Markets Inc.
- 6.4.12 Finite Carbon Corporation
- 6.4.13 Gold Standard Foundation
- 6.4.14 Intercontinental Exchange, Inc.
- 6.4.15 Nasdaq Commodities
- 6.4.16 Rearrange Carbon Markets
- 6.4.17 Shell Environmental Products
- 6.4.18 South Pole Holding AG
- 6.4.19 Thallo Inc.
- 6.4.20 Xpansiv Holdings, Inc.
7 Market Opportunities & Future Outlook
- 7.1 White-space & Unmet-need Assessment

 城市森林排碳權市場分析及預測(至2035年):按類型、產品、服務、技術、應用、流程、最終用戶、解決方案和階段分類
 排碳權市場:2034 年預測-按信用類型、項目類型、市場類型、買方類型、交易平台、最終用戶和地區分類的全球分析生物炭碳去除市場預測至 2034 年—按原料類型、生產技術、生物炭應用、去除率檢驗、最終用戶和地區進行全球分析。
 碳抵銷/排碳權市場-2026-2032年全球市場預測2034年稅額扣抵交易市場預測:按稅額扣抵類型、交易機制、最終用戶和地區分類的全球分析排碳權檢驗市場預測至2034年-按檢驗類型、排碳權來源、檢驗標準、最終用戶和地區分類的全球分析農業排碳權平台市場:預測至2034年-按平台類型、部署方式、服務、最終用戶和地區分類的全球分析
 自然信貸市場規模、佔有率和成長分析:按信貸類型、結構、產業、最終用戶和地區分類-2026-2033年產業預測能源產業排碳權市場預測—按信用類型、專案類型、交易平台、最終用戶和地區分類的全球分析—2034年農業碳權市場預測至2034年-按信用類型、農業方法、平台類型、應用、最終用戶和地區分類的全球分析