


 |
市場調查報告書
商品編碼
2097284
生產力應用:市場佔有率分析、產業趨勢與統計、成長預測(2025-2030 年)Productivity Apps - Market Share Analysis, Industry Trends & Statistics, Growth Forecasts (2025 - 2030) |
||||||

※ 本網頁內容可能與最新版本有所差異。詳細情況請與我們聯繫。
根據 Mordor Intelligence 預測,生產力應用市場規模預計將在 2025 年達到 119.6 億美元,到 2030 年達到 180.9 億美元,2025 年至 2030 年的年複合成長率(CAGR)為 8.63%。
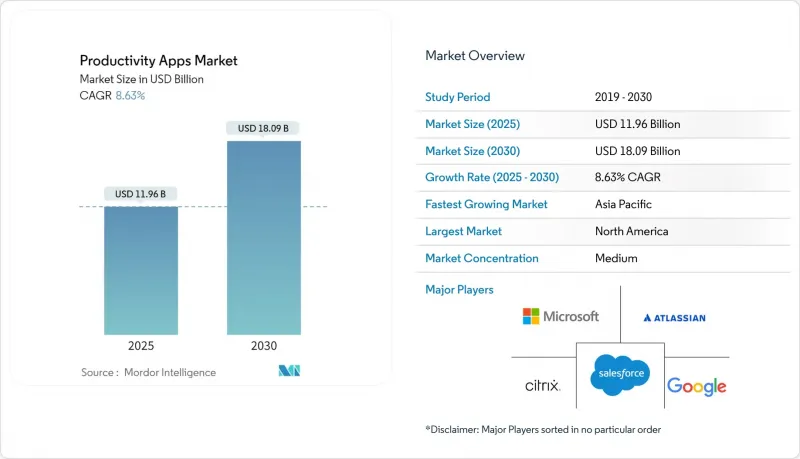
本報告按類型(專案管理軟體、團隊合作軟體等)、平台(網頁/桌面、行動等)、組織規模(大型企業、中小企業)、最終用戶行業(IT和電信、銀行、金融服務和保險、醫療保健和生命科學等)以及地區進行細分。市場預測以價值(美元)表示。
全球生產力提升應用市場趨勢及洞察
遠距辦公和混合辦公模式的擴展
自疫情爆發以來,跨境線上工作量成長了30%,顯示協作需求正在長期轉變。即使仍需履行辦公室工作義務,高階主管也越來越傾向將分散式辦公室視為永久性解決方案,這促使企業持續採用能夠連接實體和虛擬工作空間的安全雲端套件。如今,技術藍圖已納入非同步通訊、共用畫布和工作流程引擎等功能,從而消除時區差異帶來的摩擦。這種需求在印度和其他新興人才中心尤為突出,這些地區依靠全球自由工作者來保持競爭力。因此,企業正圍繞著「整合優先」的架構不斷重塑其數位化工作場所,以實現對話、文件和分析的統一管理。
整合人工智慧和自動化技術以簡化工作流程
到2028年,預計超過20%的職場應用將整合人工智慧驅動的個人化功能,使預測性任務自動化成為軟體選擇的核心要素。企業在ChatGPT許可證上的支出較去年同期成長了600%,顯示主流買家正超越試點階段,全面測試生成式人工智慧。在製造業,最初的困境已轉化為生產力的J型曲線成長,隨後產量和正常運作時間也運轉率。雅虎日本決定強制所有11,000名員工使用生成式人工智慧,凸顯了大型企業如何將從試點計畫中獲得的洞察轉化為全面營運模式。政策研究人員也指出,只要企業同時投資於技能發展和資料管道安全,就能對勞動生產力產生正面影響。
雲端應用中的資料安全和隱私問題
與人工智慧工具相關的安全事件比例預計將從2023年的27%飆升至2025年的40%,凸顯了創新發展速度遠超過管治。由於敏感資料如今會流經文本生成、摘要和搜尋轉錄模組,企業必須在所有生產工作流程中應用零信任原則和多層內容過濾。在受監管行業,人工智慧功能運作到生產環境之前,必須簽訂諸如HIPAA業務夥伴協議之類的合約條款。過度授權的存取和產生錯誤訊息的內容會增加風險,需要額外的審查週期並延遲部署。因此,買家越來越傾向於選擇那些發布透明安全藍圖和第三方審計認證的供應商。
細分市場分析
專案管理應用在2024年仍將佔據生產力應用市場22.5%的佔有率,反映出其在統籌複雜、跨職能專案中的重要角色。隨著企業擴展敏捷方法論,並尋求甘特圖、看板和風險追蹤功能來完善經營團隊儀錶板,市場需求仍然強勁。然而,隨著企業從手動任務記錄轉向事件驅動的工作流程協調,自動化和整合平台正在推動市場成長,預計到2030年將以9.2%的複合年成長率成長。這種轉變體現在API呼叫次數的增加以及基於觸發規則的採用,這些規則將重複性任務卸載到機器人,使管理者能夠專注於更高層次的規劃。融合聊天、白板和專案時間表的協作套件也越來越受歡迎,彌合了執行和溝通之間的鴻溝。筆記工具正在演變為人工智慧驅動的知識庫,可以總結會議成果並提取可重複使用的資訊片段,從而減少搜尋的麻煩。像 Miro 這樣的數位白板目前擁有 20 萬用戶,是視覺化畫佈如何彌合虛擬會議造成的創造力差距的絕佳例證。在提升員工福祉和緩解數位過載的政策壓力推動下,專注力管理應用程式不斷湧現。這些趨勢共同促成了一個雙軌市場:結構化的專案管治與能夠即時調整工作流程的輕量級自動化層並存。
即使到了2024年,Web/桌面部署仍將佔據生產力應用市場價值的66.5%。這是因為企業歷來都將以瀏覽器為中心的套件標準化,並將其與自身的身分管理系統整合。然而,隨著員工每天拿起智慧型手機約150次,行動應用的普及率正以每年10.0%的複合年成長率加速成長,直至2030年。行動性已從單純的便利轉變為必不可少的功能,因為第一線員工和管理人員現在都期望在不同設備上獲得一致的功能。低程式碼的快速行動開發解決了人才短缺的問題,使領域專家無需精通Objective-C或Kotlin即可建立微應用。瀏覽器擴充功能和漸進式網路應用程式進一步模糊了界限,使知識工作者能夠在筆記型電腦、平板電腦和智慧型手機之間無縫切換工作內容,而不會遺失上下文。儘管行動領域持續成長,但也面臨許多挑戰,例如持續視訊通話導致的電池消耗,以及需要在個人裝置上使用符合企業安全標準的容器化資料模型。提供自適應佈局、離線編輯和生物識別等功能的供應商最能掌握這波成長浪潮。同時,跨平台SDK能夠從單一程式碼庫支援多種外形規格,從而縮短發布週期並減少碎片化。
區域分析
北美地區在2024年佔全球整體支出的38.1%,這主要得益於其成熟的雲端基礎設施、持續的創新投資以及較高的人均許可證數量。美國跨國公司引領人工智慧輔助駕駛和低程式碼自動化技術的應用,並利用這些技術簡化其龐大的應用組合。加拿大也透過聯邦專案支持中小企業的數位轉型,緊隨其後;而墨西哥則受益於近岸外包趨勢,這需要協調跨境專案。隨著大型企業核心通訊模組接近飽和,並更加重視整合品質和安全態勢,成長速度略有放緩。此外,監管機構對人工智慧生成內容的審查也是影響其應用的因素,尤其是在醫療保健和公共部門客戶中,這種謹慎態度尤其明顯。
亞太地區預計將成為成長最快的地區,2025年至2030年間的複合年成長率將達到9.6%,這主要得益於其龐大的人口規模、智慧型手機的快速普及以及政府積極的數位化政策。印度和印尼正在展示雲端協作如何賦能提供IT服務和後勤部門外包的公司。中國製造商正透過將生產力儀錶板與MES和ERP系統整合,加速實現智慧工廠的目標。同時,日本服務公司正在正式製定生成式人工智慧的使用指南,例如雅虎日本強制要求所有員工使用人工智慧。因此,一個多層次的市場正在興起,本土SaaS供應商和全球公司並存,各自根據當地語言、合規性和支付偏好客製化服務。投資人正將資金投入垂直領域的專業新創公司,進一步拓展了企業用戶的軟體選擇。
歐洲蘊藏著巨大的商業機遇,但數位轉型 (DX) 的進展緩慢,僅有 15% 的專案實現了其目標功能的全面實施。企業預計,一旦數位轉型成熟,生產力將提高 38%,但技能匱乏和管理體制不一致是主要障礙。儘管如此,自 2019 年以來,歐盟的數位消費者增加了 1 億,顯示下游需求正在成長。北歐和比荷盧經濟聯盟國家在人工智慧驅動的自動化應用方面領先其他地區,而南歐國家由於平均企業規模較小和 IT 預算有限而落後。除了主要地區之外,南美和中東/非洲等新興市場也備受關注,隨著光纖連接的改善和雲端資料中心的建立,這些地區的數位轉型障礙正在逐步減少。這將為能夠提供本地化定價和支援的供應商帶來長期的利好。
其他好處:
- Excel格式的市場預測(ME)表
- 3個月的分析師支持
目錄
第1章:引言
- 研究假設和市場定義
- 調查範圍
第2章:調查方法
第3章執行摘要
第4章 市場狀況
- 市場概覽
- 市場促進因素
- 遠距辦公和混合辦公模式的普及
- 雲端運算和SaaS服務的普及
- 整合人工智慧和自動化技術以簡化工作流程
- 對跨平台協作套件的需求
- 無程式碼/低程式碼擴充市場
- 「數位健康」指數正在推動那些能夠提高注意力的應用程式的發展。
- 市場限制因素
- 對雲端應用中資料安全和隱私的擔憂
- 中小企業的訂閱疲勞和成本敏感性
- API速率限制和互通性挑戰
- 數位疲勞會導致終端用戶採用率下降。
- 產業價值鏈分析
- 技術展望
- 波特五力分析
第5章 市場規模與成長預測
- 按類型
- 專案管理軟體
- 團隊合作軟體
- 筆記和文檔
- 時間管理和日程管理
- 專注力和注意力管理工具
- 自動化和整合平台
- 數位白板
- 其他類型
- 按平台
- 網頁/桌面
- 行動端(iOS 和 Android)
- 跨平台/瀏覽器擴展
- 按組織規模
- 大公司
- 中小企業
- 按最終用戶行業分類
- 資訊科技/通訊
- BFSI
- 醫療保健和生命科學
- 教育
- 製造業
- 零售與電子商務
- 媒體與娛樂
- 政府/公共部門
- 其他終端用戶產業
- 按地區
- 北美洲
- 美國
- 加拿大
- 墨西哥
- 歐洲
- 德國
- 英國
- 法國
- 義大利
- 西班牙
- 其他歐洲國家
- 亞太地區
- 中國
- 日本
- 印度
- 韓國
- 澳洲
- 其他亞太國家
- 南美洲
- 巴西
- 阿根廷
- 其他南美國家
- 中東和非洲
- 沙烏地阿拉伯
- 阿拉伯聯合大公國
- 南非
- 埃及
- 其他中東和非洲國家
- 北美洲
第6章 競爭情勢
- 市場集中度
- 策略趨勢
- 市佔率分析
- 公司簡介
- Microsoft Corporation
- Google LLC
- Atlassian Corporation PLC
- Salesforce Inc.(Slack)
- Zoom Video Communications Inc.
- Asana Inc.
- Monday.com Ltd.
- Smartsheet Inc.
- Trello, Inc.
- Notion Labs Inc.
- Evernote Corporation
- Doist Ltd.(Todoist)
- Mango Technologies, Inc.(ClickUp)
- Zoho Corporation
- Basecamp LLC
- Dropbox Inc.
- Formagrid, Inc.(Airtable)
- TeamViewer AG
- Citrix Systems Inc.(GoTo)
- ProofHub LLC
第7章 市場機會與未來展望
According to Mordor Intelligence, the productivity apps market size stands at USD 11.96 billion in 2025 and is forecast to reach USD 18.09 billion by 2030, translating into an 8.63% CAGR during 2025-2030.
This report is Segmented by Type (Project Management Software, Team Collaboration Software, and More), Platform (Web/Desktop, Mobile, and More), Organization Size (Large Enterprises, and SMEs), End-User Industry (IT and Telecom, BFSI, Healthcare and Life Sciences, and More), and Geography. The Market Forecasts are Provided in Terms of Value (USD).
Global Productivity Apps Market Trends and Insights
Rising Remote and Hybrid Work Models
Cross-border online work volumes have climbed 30% since the pandemic, signalling a long-term step-change in collaboration needs. Executives increasingly accept that distributed work is permanent even while office mandates persist, which sustains procurement of secure cloud suites that bridge physical and virtual workspaces. Technology roadmaps now include asynchronous messaging, shared canvases and workflow engines that remove time-zone friction. Demand is particularly pronounced across India and other emerging talent hubs that rely on global freelancing to remain competitive. Enterprises therefore continue to rebuild digital workplaces around integration-first architectures that can orchestrate conversations, files and analytics.
Integration of AI and Automation for Workflow Efficiency
More than 20% of workplace applications are expected to embed AI-driven personalisation by 2028, putting predictive task automation at the heart of software selection. Enterprise spending on ChatGPT licences ballooned 600% year-on-year, confirming that mainstream buyers now test generative AI beyond pilots. Manufacturers illustrate the payoff, where early rollout pain gives way to a productivity J-curve that later accelerates throughput and uptime. Yahoo Japan's decision to mandate generative AI for all 11,000 employees underscores how large organisations convert pilot learnings into full-scale operating models. Policy researchers also observe positive labour-productivity effects provided firms invest simultaneously in upskilling and secure data pipelines.
Data Security and Privacy Concerns in Cloud Apps
The share of security incidents linked to AI tools jumped to 40% in 2025 from 27% in 2023, underscoring how fast innovation outpaces governance. Firms must layer zero-trust principles and content-filtering over every productivity workflow because sensitive data now travels through text generation, summarisation and searchable transcript modules. For regulated industries, contractual addenda such as HIPAA Business Associate Agreements become mandatory before AI features can go live. Over-permissioned access and hallucinated content heighten risk, forcing additional review cycles that slow roll-outs. Consequently, buyers increasingly favour vendors that publish transparent security roadmaps and third-party audit attestations.
Other drivers and restraints analyzed in the detailed report include:
- No-code/Low-code Extensibility Marketplaces
- Proliferation of Cloud Computing and SaaS Delivery
- Digital Burnout Reducing End-User Adoption
For complete list of drivers and restraints, kindly check the Table Of Contents.
Segment Analysis
Project management maintained a 22.5% productivity apps market share in 2024, reflecting its entrenched role in orchestrating complex, cross-functional initiatives. Demand remains buoyant as enterprises scale agile practices and require Gantt, Kanban and risk-tracking features that feed executive dashboards. Nonetheless, automation & integration platforms are setting the growth pace with a 9.2% CAGR to 2030 as organisations pivot from manual task capture to event-driven workflow orchestration. The shift is visible in rising API call volumes and adoption of trigger-based rules that hand off repetitive actions to bots, freeing managers for higher-order planning. Collaboration suites that blend chat, whiteboarding and project timelines also gain traction, eroding the legacy divide between work execution and communication. Note-taking tools evolve toward AI-powered knowledge bases that summarise meeting outcomes and surface reusable snippets, lowering search friction. Digital whiteboards such as Miro - now serving 200,000 customers - exemplify how visual canvases fill the creativity gap left by virtual meetings. Focus-management apps continue to emerge, driven by wellbeing initiatives and policy pressure to mitigate digital overload. Collectively, these dynamics reinforce a dual-track market in which structured project governance coexists with lightweight automation layers that adapt workflows in real time.
Web/desktop deployments still capture 66.5% of productivity apps market value in 2024 because enterprises historically standardised on browser-centric suites that integrate with corporate identity stacks. Yet mobile installations are accelerating at 10.0% CAGR through 2030, buoyed by the fact that employees pick up their phones roughly 150 times per day. Mobility has shifted from mere convenience to necessity as frontline staff and managers alike expect parity of features across devices. Low-code rapid-mobile development fills talent shortages by letting domain specialists assemble micro-apps without Objective-C or Kotlin expertise. Browser extensions and progressive web apps further blur boundaries, letting knowledge workers resume sessions across laptop, tablet and smartphone without losing context. Despite growth, mobile faces challenges such as battery drain from continuous video calls and the need for containerised data models that meet enterprise security standards on personal devices. Vendors that provide adaptive layouts, offline editing and biometric sign-on are best positioned to capture the upswing. Meanwhile, cross-platform SDKs ensure that a single codebase can target multiple form factors, shortening release cycles and reducing fragmentation.
Complete Report Scope:
- By Type
- Project Management Software
- Team Collaboration Software
- Note-Taking and Documentation
- Time Tracking and Scheduling
- Focus and Distraction Management Tools
- Automation and Integration Platforms
- Digital Whiteboarding
- Other Types
- By Platform
- Web / Desktop
- Mobile (iOS and Android)
- Cross-platform / Browser Extensions
- By Organization Size
- Large Enterprises
- Small and Medium Enterprises (SMEs)
- By End-User Industry
- IT and Telecom
- BFSI
- Healthcare and Life Sciences
- Education
- Manufacturing
- Retail and E-commerce
- Media and Entertainment
- Government and Public Sector
- Other End-User Industries
- By Geography
- North America
- United States
- Canada
- Mexico
- Europe
- Germany
- United Kingdom
- France
- Italy
- Spain
- Rest of Europe
- Asia-Pacific
- China
- Japan
- India
- South Korea
- Australia
- Rest of Asia-Pacific
- South America
- Brazil
- Argentina
- Rest of South America
- Middle East and Africa
- Saudi Arabia
- United Arab Emirates
- South Africa
- Egypt
- Rest of Middle East and Africa
- North America
Geography Analysis
North America preserved 38.1% of global spending in 2024 because of mature cloud infrastructure, continuous innovation funding and high per-capita licence counts. United States multinationals lead adoption of AI copilots and low-code automation, using them to rationalise sprawling application portfolios. Canada follows through federal programmes that subsidise SME digitisation, while Mexico benefits from near-shoring trends that require cross-border project orchestration. Growth moderates slightly as large enterprises approach saturation in core communication modules and turn their focus to integration quality and security posture. Regulatory scrutiny of AI content generation also drives cautious rollout of generative features, particularly in healthcare and public-sector accounts.
Asia-Pacific registers the fastest expansion at 9.6% CAGR for 2025-2030, fuelled by demographic scale, rapid smartphone penetration and aggressive government digital agendas. India and Indonesia illustrate how cloud collaboration empowers exporters of IT services and back-office process outsourcing. Chinese manufacturers integrate productivity dashboards with MES and ERP to accelerate smart-factory goals, while Japan's service companies formalise generative-AI playbooks like Yahoo Japan's all-employee mandate. The result is a layered market where home-grown SaaS providers co-exist with global entrants, each tailoring offerings to local language, compliance and payment preferences. Investors inject capital into vertical-specialist start-ups, further broadening software choice for enterprise buyers.
Europe contributes a sizeable opportunity base yet realises a slower trajectory because only 15% of digital-transformation projects have fully implemented target capabilities. Enterprises expect a 38% productivity lift once rollouts mature but cite skills shortages and fragmented regulatory regimes as chief obstacles. The bloc nevertheless reports 100 million additional digital consumers since 2019, signalling downstream demand. Nordic and Benelux countries outperform on uptake of AI-driven automation, whereas Southern Europe lags due to smaller average company size and constrained IT budgets. Beyond the core regions, South America and the Middle East & Africa constitute emerging frontiers where improved fibre connectivity and cloud data-centre launches gradually lower adoption barriers, creating long-run tailwinds for vendors able to localise pricing and support.
- Microsoft Corporation
- Google LLC
- Atlassian Corporation PLC
- Salesforce Inc. (Slack)
- Zoom Video Communications Inc.
- Asana Inc.
- Monday.com Ltd.
- Smartsheet Inc.
- Trello, Inc.
- Notion Labs Inc.
- Evernote Corporation
- Doist Ltd. (Todoist)
- Mango Technologies, Inc. (ClickUp)
- Zoho Corporation
- Basecamp LLC
- Dropbox Inc.
- Formagrid, Inc. (Airtable)
- TeamViewer AG
- Citrix Systems Inc. (GoTo)
- ProofHub LLC
Additional Benefits:
- The market estimate (ME) sheet in Excel format
- 3 months of analyst support
TABLE OF CONTENTS
1 INTRODUCTION
- 1.1 Study Assumptions and Market Definition
- 1.2 Scope of the Study
2 RESEARCH METHODOLOGY
3 EXECUTIVE SUMMARY
4 MARKET LANDSCAPE
- 4.1 Market Overview
- 4.2 Market Drivers
- 4.2.1 Rising remote and hybrid work models
- 4.2.2 Proliferation of cloud computing and SaaS delivery
- 4.2.3 Integration of AI and automation for workflow efficiency
- 4.2.4 Demand for cross-platform collaboration suites
- 4.2.5 No-code/low-code extensibility marketplaces
- 4.2.6 Digital well-being metrics boosting focus-oriented apps
- 4.3 Market Restraints
- 4.3.1 Data security and privacy concerns in cloud apps
- 4.3.2 Subscription fatigue and cost sensitivity among SMEs
- 4.3.3 API rate-limit and interoperability challenges
- 4.3.4 Digital burnout reducing end-user adoption
- 4.4 Industry Value Chain Analysis
- 4.5 Technological Outlook
- 4.6 Porter's Five Forces Analysis
- 4.6.1 Threat of New Entrants
- 4.6.2 Bargaining Power of Suppliers
- 4.6.3 Bargaining Power of Buyers
- 4.6.4 Threat of Substitutes
- 4.6.5 Competitive Rivalry
5 MARKET SIZE AND GROWTH FORECASTS (VALUE)
- 5.1 By Type
- 5.1.1 Project Management Software
- 5.1.2 Team Collaboration Software
- 5.1.3 Note-Taking and Documentation
- 5.1.4 Time Tracking and Scheduling
- 5.1.5 Focus and Distraction Management Tools
- 5.1.6 Automation and Integration Platforms
- 5.1.7 Digital Whiteboarding
- 5.1.8 Other Types
- 5.2 By Platform
- 5.2.1 Web / Desktop
- 5.2.2 Mobile (iOS and Android)
- 5.2.3 Cross-platform / Browser Extensions
- 5.3 By Organization Size
- 5.3.1 Large Enterprises
- 5.3.2 Small and Medium Enterprises (SMEs)
- 5.4 By End-User Industry
- 5.4.1 IT and Telecom
- 5.4.2 BFSI
- 5.4.3 Healthcare and Life Sciences
- 5.4.4 Education
- 5.4.5 Manufacturing
- 5.4.6 Retail and E-commerce
- 5.4.7 Media and Entertainment
- 5.4.8 Government and Public Sector
- 5.4.9 Other End-User Industries
- 5.5 By Geography
- 5.5.1 North America
- 5.5.1.1 United States
- 5.5.1.2 Canada
- 5.5.1.3 Mexico
- 5.5.2 Europe
- 5.5.2.1 Germany
- 5.5.2.2 United Kingdom
- 5.5.2.3 France
- 5.5.2.4 Italy
- 5.5.2.5 Spain
- 5.5.2.6 Rest of Europe
- 5.5.3 Asia-Pacific
- 5.5.3.1 China
- 5.5.3.2 Japan
- 5.5.3.3 India
- 5.5.3.4 South Korea
- 5.5.3.5 Australia
- 5.5.3.6 Rest of Asia-Pacific
- 5.5.4 South America
- 5.5.4.1 Brazil
- 5.5.4.2 Argentina
- 5.5.4.3 Rest of South America
- 5.5.5 Middle East and Africa
- 5.5.5.1 Saudi Arabia
- 5.5.5.2 United Arab Emirates
- 5.5.5.3 South Africa
- 5.5.5.4 Egypt
- 5.5.5.5 Rest of Middle East and Africa
- 5.5.1 North America
6 COMPETITIVE LANDSCAPE
- 6.1 Market Concentration
- 6.2 Strategic Moves
- 6.3 Market Share Analysis
- 6.4 Company Profiles (includes Global level Overview, Market level overview, Core Segments, Financials as available, Strategic Information, Market Rank/Share for key companies, Products and Services, and Recent Developments)
- 6.4.1 Microsoft Corporation
- 6.4.2 Google LLC
- 6.4.3 Atlassian Corporation PLC
- 6.4.4 Salesforce Inc. (Slack)
- 6.4.5 Zoom Video Communications Inc.
- 6.4.6 Asana Inc.
- 6.4.7 Monday.com Ltd.
- 6.4.8 Smartsheet Inc.
- 6.4.9 Trello, Inc.
- 6.4.10 Notion Labs Inc.
- 6.4.11 Evernote Corporation
- 6.4.12 Doist Ltd. (Todoist)
- 6.4.13 Mango Technologies, Inc. (ClickUp)
- 6.4.14 Zoho Corporation
- 6.4.15 Basecamp LLC
- 6.4.16 Dropbox Inc.
- 6.4.17 Formagrid, Inc. (Airtable)
- 6.4.18 TeamViewer AG
- 6.4.19 Citrix Systems Inc. (GoTo)
- 6.4.20 ProofHub LLC
7 MARKET OPPORTUNITIES AND FUTURE OUTLOOK
- 7.1 White Space and Unmet Need Assessment


