


 |
市場調查報告書
商品編碼
2097242
超自動化:市場佔有率分析、產業趨勢與統計、成長預測(2026-2031)Hyperautomation - Market Share Analysis, Industry Trends & Statistics, Growth Forecasts (2026 - 2031) |
||||||

※ 本網頁內容可能與最新版本有所差異。詳細情況請與我們聯繫。
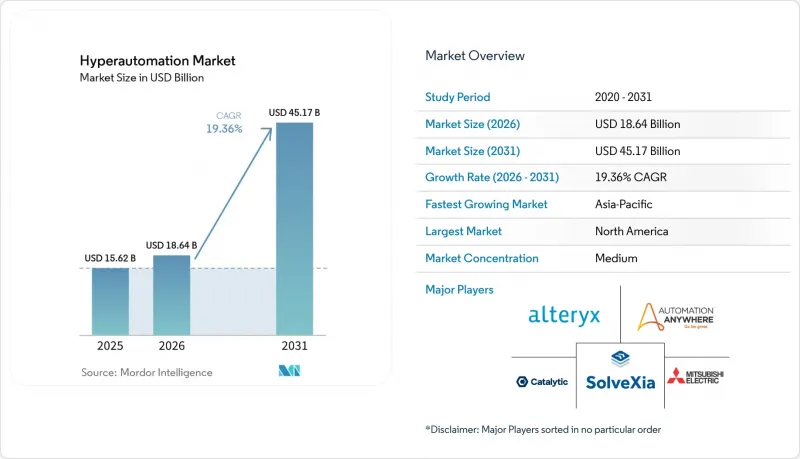
根據 Mordor Intelligence 估計,到 2026 年,超自動化市值將達到 186.4 億美元,高於 2025 年的 156.2 億美元,預計到 2031 年將達到 451.7 億美元。
預計 2026 年至 2031 年的複合年成長率為 19.36%。
本報告按組件(解決方案、服務)、技術類型(RPA、機器學習/深度學習、自然語言處理/聊天機器人、流程挖掘、電腦視覺)、部署模式(本地部署、雲端部署、混合部署)、企業規模(大型企業、中小企業)、最終用戶產業(銀行、金融服務和保險、零售、IT、製造業及其他)以及地區(北美、南美、歐洲)以及地區(北美、南美、歐洲)以及中東地區(北美、南美、歐洲)以及地區(北美、南美、歐洲)以及地區(北美地區及其他)。市場預測以美元計價。
全球超自動化市場趨勢與洞察
擴大工業自動化計劃
為了因應預計從2024年開始出現的供應鏈中斷和勞動力短缺問題,製造商正在其所有生產線上部署超自動化市場工具集。可口可樂位於新加坡的示範工廠透過整合預測性排程和基於電腦視覺的品管,將加工能力提高了28%,並提升了勞動生產力。紡織品製造商Delta Galil利用RFID分析技術對生產線效率進行基準測試,並促進團隊間的競爭,從而減少了停機時間並提高了產量。超自動化超越了機器人技術,它能夠記錄精細的資產數據,並為機器學習模型提供信息,以便在異常情況中斷生產之前檢測到它們。這種從「被動式」維護到「預測式」維護的轉變,減少了缺陷,延長了設備壽命,並提高了生產計劃的執行率,即使在成本敏感的環境中,也使這項投資更具吸引力。企業正日益標準化邊緣資料擷取,從而實現集中式分析,以近乎即時的方式迭代最佳化流程。
以「數位化優先」為核心的企業策略,實現成本最佳化
經營團隊對結構性成本削減的要求不再是零散的成本節約,而是核心工作流程的重塑。一些公司透過自動化取代了人工發票處理、保險理賠審核和客戶註冊流程,並在12個月內實現了三位數的投資回報率,這得益於更低的錯誤率和更短的周期。在Ring Container公司,實施人工智慧驅動的自動化每年可節省10.2萬美元的貨運相關單據處理成本,並將客戶諮詢回應速度提高了96%。這些舉措使他們能夠將人力資源重新分配到更高價值的分析和創新領域,並透過縮短產品上市時間來增強客戶忠誠度。超自動化正鞏固其作為成本降低和收入成長催化劑的地位,進一步支撐了動態定價和個人化優惠等數據驅動型收入策略。
需要大量的初始投資。
一套全面的超自動化方案需要大量的資金投入,用於軟體和基礎設施升級以及變更管理,遠遠超出典型的IT更新周期。 SAP已撥款20億歐元(約21.8億美元)用於重組,以實現人工智慧驅動的效率提升,這一規模清晰地展現了其他財富500強企業所面臨的挑戰。儘管投資回報率模型極具吸引力,但中型企業往往資金籌措,迫使它們採取分階段實施或依賴託管服務。此外,諸如培訓現有員工、重新設計流程以及整合舊有系統等意外成本也隨之而來,因此,強力的經營團隊支援對於克服投資障礙至關重要。
細分市場分析
到了2025年,解決方案在超自動化市場中佔據60.58%的佔有率,因為企業越來越傾向於採用整合流程發現、編配和分析的套件。供應商藍圖強調模組化架構,使客戶無需大規模重新實施即可啟用新功能。同時,服務業以20.05%的複合年成長率快速成長,因為企業越來越依賴外部專家來管理部署客製化和迭代最佳化。諮詢合作夥伴設計了管治框架、卓越中心 (CoE) 模型和投資報酬率 (ROI) 儀表板,確保業務成果優先於功能清單。當內部團隊無法提供全天候服務時,託管服務獲得了廣泛認可,成本從資本預算轉移到了可預測的營運支出。
專業服務正透過「加速價值實現」調查方法、特定產業範本和上運作後監控等方式降低全球部署風險,從而進一步拓展超自動化市場。服務提供者將變革管理輔導與技術服務打包,幫助員工適應新的人機協作模式。基於結果的定價模式調整了獎勵,服務公司透過設定與生產力基準掛鉤的薪酬,促進了持續改進和平台深度滲透的良性循環。
到2025年,機器人流程自動化(RPA)將佔總收入的38.92%,但流程和任務挖掘28.10%的複合年成長率表明,「分析優先」時代已經到來,在這個時代,數據驅動的洞察將決定投資優先級。挖掘工具會仔細審查事件日誌,以發現流程碎片化、延遲和違規,並將這些發現轉化為具有可量化成本節約潛力的自動化候選流程。機器學習和深度學習元件進一步增強了這些發現,並透過預測業務量峰值、異常情況和潛在故障來實現動態資源分配。自然語言介面允許業務分析師以對話的方式查詢流程圖,從而擴展了對最佳化洞察的存取範圍。
電腦視覺模組正在拓展超自動化市場,使其應用從後勤部門螢幕擴展到現實世界的檢測、身份驗證和庫存盤點。基於大規模語言模型的聊天機器人將同理心對話與交易執行結合,從而提升客戶體驗。這些技術的整合促使供應商提供即插即用的編配層,以支援異質引擎,確保客戶能夠在不受鎖定的情況下擴展其技術堆疊。
區域分析
預計到2025年,北美將佔據超自動化市場36.27%的佔有率,這得益於其雄厚的企業預算、完善的創業投資生態系統以及經驗豐富的自動化人才儲備。美國醫療保健服務供應商Dexcom透過在其財務和供應鏈團隊中應用人工智慧機器人,每年節省了20萬工時,並將週期時間縮短了80%。金融監理機構對營運韌性的重視進一步加速了銀行和保險業對人工智慧的採用。在加拿大,汽車零件和食品加工產業的製造業應用案例也印證了這一點;而在墨西哥,邊境地區智慧工廠的推進則展現了跨區域供應鏈的協調性。
亞太地區正處於最快的成長軌道上,預計到2031年將以19.10%的複合年成長率成長,這主要得益於政府主導的「工業4.0」基金、大規模電子產業中心以及具有競爭力的薪資水平。在中國,省級津貼正在支持紡織和物流行業採用超自動化技術;在日本,認知品管正在應用於汽車噴漆車間;在印度,機器人正被用於提高業務流程外包(BPO)的準確性,並縮短全球客戶的平均處理時間。澳洲尤其突出,96%的公司表示已製定財務、人力資源和客戶服務方面的自動化計劃,這表明幾乎所有公司都打算引進意願。東協製造商正在採用邊緣分析技術來降低能源成本並滿足出口品質標準。
在歐洲,一項「人工智慧法」正在平衡創新與管治,該法根據風險對超自動化應用進行分類,並制定了透明度、減少偏見和「人機協同」實踐的相關規定。德國正主導產業轉型,將流程挖掘儀錶板引進離散製造工廠。英國將超自動化視為脫歐後貿易便利化的競爭優勢來源,並致力於實現海關程序的自動化。法國正在試點醫院工作流程機器人,以減輕行政負擔,而義大利則透過與數位化里程碑掛鉤的稅收抵免來促進中小企業採用超自動化稅額扣抵。
其他好處:
- Excel格式的市場預測(ME)表
- 3個月的分析師支持
目錄
第1章:引言
- 研究假設和市場定義
- 調查範圍
第2章:調查方法
第3章執行摘要
第4章 市場狀況
- 市場概覽
- 市場促進因素
- 加大工業自動化力度
- 以數位化為先導的企業策略,實現成本最佳化
- RPA和AI整合平台的快速普及
- 技能缺口導致對低程式碼公民開發人員工具的需求增加。
- 流程挖掘主導的自最佳化工作流程
- 互聯工廠中基於邊緣運算的超自動化
- 市場限制因素
- 需要大量的初始投資。
- 綜合人員短缺
- 雲端採用中資料主權面臨的障礙
- 演算法透明度合規方面的延誤
- 產業價值鏈分析
- 監理情勢
- 技術展望
- 波特五力分析
第5章 市場規模與成長預測
- 按組件
- 解決方案
- 服務
- 依技術類型
- 機器人流程自動化 (RPA)
- 機器學習和深度學習
- 自然語言處理與聊天機器人
- 流程和任務挖掘
- 電腦視覺和生物識別
- 部署模式
- 現場
- 雲
- 混合
- 按最終用戶公司規模分類
- 大公司
- 中小企業
- 按最終用戶行業分類
- BFSI
- 零售與電子商務
- 資訊科技/通訊
- 製造業/汽車
- 醫療保健和生命科學
- 教育
- 其他終端用戶產業
- 按地區
- 北美洲
- 美國
- 加拿大
- 墨西哥
- 南美洲
- 巴西
- 阿根廷
- 其他南美國家
- 歐洲
- 德國
- 英國
- 法國
- 義大利
- 西班牙
- 俄羅斯
- 其他歐洲國家
- 亞太地區
- 中國
- 日本
- 印度
- 韓國
- ASEAN-5
- 澳洲和紐西蘭
- 其他亞太國家
- 中東和非洲
- 中東
- 阿拉伯聯合大公國
- 沙烏地阿拉伯
- 其他中東國家
- 非洲
- 南非
- 奈及利亞
- 其他非洲國家
- 中東
- 北美洲
第6章 競爭情勢
- 市場集中度
- 策略趨勢
- 市佔率分析
- 公司簡介
- ABBYY Solutions Ltd.
- akaBot(FPT Software)
- Alteryx Inc.
- Appian Corporation
- Automation Anywhere Inc.
- Blue Prism Ltd.
- Catalytic Inc.
- Celonis SE
- IBM Corporation
- Microsoft Corporation
- Mitsubishi Electric Corporation
- NICE Ltd.
- OneGlobe LLC
- Pegasystems Inc.
- Rocketbot SpA
- Salesforce Inc.
- Simple Fractal LLC
- SolveXia Pty Ltd.
- UiPath Inc.
- WorkFusion Inc.
第7章 市場機會與未來展望
According to Mordor Intelligence, the hyper automation market size in 2026 is estimated at USD 18.64 billion, growing from 2025 value of USD 15.62 billion with 2031 projections showing USD 45.17 billion, growing at 19.36% CAGR over 2026-2031.
This report is Segmented by Component (Solutions, Services), Technology Type (RPA, ML/DL, NLP/Chatbots, Process Mining, Computer Vision), Deployment Mode (On-Premise, Cloud, Hybrid), Enterprise Size (Large, Smes), End-User Industry (BFSI, Retail, IT, Manufacturing, and More), and Geography (North America, South America, Europe, Asia Pacific, MEA). Market Forecasts are Provided in Value (USD).
Global Hyperautomation Market Trends and Insights
Rising Industrial Automation Initiatives
Manufacturers now embed the hyper automation market's toolset across production lines to remedy supply-chain shocks and worker scarcity observed after 2024. Coca-Cola's Singapore lighthouse plant lifted throughput 28% and labor productivity 70% by merging predictive scheduling with computer-vision quality control. Textile producer Delta Galil harnessed RFID insights to benchmark line-level efficiency and spark inter-team competition, shrinking downtime and boosting yields. Hyper automation reaches beyond robotics by logging granular asset data, feeding machine-learning models that flag anomalies before they disrupt production. That shift from reactive to predictive maintenance reduces scrap, lengthens equipment life, and improves schedule adherence, making investment cases compelling even in cost-sensitive environments. Enterprises increasingly standardize data capture at the edge, enabling centralized analytics that iterate process tweaks in near real time.
Digital-First Enterprise Strategies for Cost Optimization
Board mandates for structural cost take-out now demand redesign of core workflows rather than piecemeal savings. Companies replacing manual invoice handling, claims adjudication, and customer onboarding report triple-digit ROI inside 12 months, driven by lower error rates and faster cycle times. Ring Container's deployment of AI-infused automation shaved USD 102,000 annually from freight paperwork processing and accelerated customer inquiry resolution by 96%. These initiatives redirect labor toward higher-value analysis and innovation, fortifying customer loyalty through shorter time-to-market. Hyper automation further underpins data-driven revenue plays such as dynamic pricing and personalized offers, reinforcing its position as a catalyst for both cost and top-line gains.
High Upfront Investment Requirements
Comprehensive hyper automation programs require sizable capital software, infrastructure upgrades, and change-management spending that can dwarf ordinary IT refresh cycles. SAP budgeted EUR 2 billion (USD 2.18 billion) restructuring outlays to unlock AI-driven efficiencies, illustrating the scale facing Fortune 500 peers. Mid-market firms often struggle to finance similar journeys despite compelling payback models, forcing phased rollouts or managed-service engagements. The sticker shock also includes training existing staff, re-engineering processes, and integrating legacy systems, making clear executive sponsorship essential to cross the investment hurdle.
Other drivers and restraints analyzed in the detailed report include:
- Rapid Adoption of RPA-AI Convergence Platforms
- Skill-Gap Driven Demand for Low-Code Citizen-Developer Tools
- Shortage of Integration Talent
For complete list of drivers and restraints, kindly check the Table Of Contents.
Segment Analysis
Solutions retained 60.58% of the hyper automation market share in 2025 as enterprises gravitated toward unified suites that bundle process discovery, orchestration, and analytics. Vendor roadmaps emphasize modular architectures so customers can activate new capabilities without large-scale re-implementations. Services, however, are growing faster at 20.05% CAGR because organizations increasingly rely on external experts to customize deployments and manage iterative optimization. Advisory partners design governance frameworks, center-of-excellence models, and ROI dashboards, ensuring business outcomes outweigh feature checklists. Managed services gain traction where internal teams lack round-the-clock talent, shifting cost from capital budgets to predictable operating expense.
Professional services further expand the hyper automation market size by de-risking global rollouts through accelerate-to-value methodologies, industry-specific templates, and post-go-live monitoring. Providers bundle change-management coaching with technical delivery, helping staff adapt to new human-bot collaboration patterns. The move toward outcome-based pricing aligns incentives, with service firms staking fees on productivity benchmarks, fueling a virtuous cycle of continuous improvement and deeper platform penetration.
Robotic process automation held 38.92% revenue in 2025, yet process and task mining's 28.10% CAGR signals an analytic-first era where data-derived insights guide investment order. Mining tools scrutinize event logs to surface fragmentation, latency, and compliance deviations, translating findings into automation candidate pipelines with quantified savings potential. Machine-learning and deep-learning components amplify this discovery by predicting volume spikes, exception scenarios, and failure likelihood, informing dynamic resource allocation. Natural-language interfaces allow business analysts to query process maps conversationally, widening access to optimization insights.
Computer-vision modules extend the hyper automation market beyond back-office screens to physical-world inspection, identity verification, and inventory checks. Chatbots, powered by large language models, blend empathetic dialogue with transactional execution, elevating customer experience. Collectively, these converging technologies push vendors to offer plug-and-play orchestration layers that support heterogeneous engines, ensuring clients can evolve stacks without lock-in.
Complete Report Scope:
- By Component
- Solutions
- Services
- By Technology Type
- Robotic Process Automation (RPA)
- Machine Learning and Deep Learning
- Natural Language Processing and Chatbots
- Process and Task Mining
- Computer Vision and Biometrics
- By Deployment Mode
- On-premise
- Cloud
- Hybrid
- By End-User Enterprise Size
- Large Enterprises
- Small and Mid-Sized Enterprises (SMEs)
- By End-User Industry
- BFSI
- Retail and e-Commerce
- IT and Telecom
- Manufacturing and Automotive
- Healthcare and Life Sciences
- Education
- Others End-user Industry
- By Geography
- North America
- United States
- Canada
- Mexico
- South America
- Brazil
- Argentina
- Rest of South America
- Europe
- Germany
- United Kingdom
- France
- Italy
- Spain
- Russia
- Rest of Europe
- Asia Pacific
- China
- Japan
- India
- South Korea
- ASEAN-5
- Australia and New Zealand
- Rest of Asia Pacific
- Middle East and Africa
- Middle East
- United Arab Emirates
- Saudi Arabia
- Rest of Middle East
- Africa
- South Africa
- Nigeria
- Rest of Africa
- Middle East
- North America
Geography Analysis
North America held 36.27% hyper automation market share in 2025, anchored by deep enterprise budgets, venture capital ecosystems, and seasoned automation talent pools. U.S. healthcare provider Dexcom saved 200,000 hours annually and cut cycle times 80% by harnessing AI-enabled bots inside finance and supply-chain teams. Financial regulators' emphasis on operational resilience further accelerates uptake across banking and insurance. Canada complements with manufacturing use cases in automotive parts and food processing, while Mexico advances border-zone smart factories, showcasing cross-regional supply-chain orchestration.
Asia Pacific posts the fastest trajectory at 19.10% CAGR to 2031, invigorated by state-sponsored Industry 4.0 funds, large-scale electronics hubs, and competitive wage pressures. China's provincial grants subsidize hyper automation adoption in textiles and logistics, while Japan embeds cognitive quality control in automotive paint shops. India leverages bots to enhance BPO accuracy and reduce average handling time for global clients. Australia stands out: 96% of enterprises reported automation plans spanning finance, HR, and customer service, indicating near-universal intent. ASEAN manufacturers deploy edge analytics to cut energy costs and meet export quality mandates.
Europe balances innovation with governance, guided by the AI Act that classifies hyper automation applications by risk category and stipulates transparency, bias mitigation, and human-in-the-loop provisions. Germany leads industrial transformation, embedding process-mining dashboards in discrete manufacturing plants. The United Kingdom positions hyper automation as a lever for competitive post-Brexit trade facilitation, emphasizing customs clearance automation. France pilots hospital workflow bots to relieve administrative overload, while Italy incentivizes SME adoption through tax credits linked to digitalization milestones.
- ABBYY Solutions Ltd.
- akaBot (FPT Software)
- Alteryx Inc.
- Appian Corporation
- Automation Anywhere Inc.
- Blue Prism Ltd.
- Catalytic Inc.
- Celonis SE
- IBM Corporation
- Microsoft Corporation
- Mitsubishi Electric Corporation
- NICE Ltd.
- OneGlobe LLC
- Pegasystems Inc.
- Rocketbot SpA
- Salesforce Inc.
- Simple Fractal LLC
- SolveXia Pty Ltd.
- UiPath Inc.
- WorkFusion Inc.
Additional Benefits:
- The market estimate (ME) sheet in Excel format
- 3 months of analyst support
TABLE OF CONTENTS
1 INTRODUCTION
- 1.1 Study Assumptions and Market Definition
- 1.2 Scope of the Study
2 RESEARCH METHODOLOGY
3 EXECUTIVE SUMMARY
4 MARKET LANDSCAPE
- 4.1 Market Overview
- 4.2 Market Drivers
- 4.2.1 Rising industrial automation initiatives
- 4.2.2 Digital-first enterprise strategies for cost optimisation
- 4.2.3 Rapid adoption of RPA-AI convergence platforms
- 4.2.4 Skill-gap driven demand for low-code citizen-developer tools
- 4.2.5 Process-mining-led self-optimising workflows
- 4.2.6 Edge-enabled hyperautomation in connected factories
- 4.3 Market Restraints
- 4.3.1 High upfront investment requirements
- 4.3.2 Shortage of integration talent
- 4.3.3 Data-sovereignty barriers to cloud deployment
- 4.3.4 Algorithmic-transparency compliance delays
- 4.4 Industry Value-Chain Analysis
- 4.5 Regulatory Landscape
- 4.6 Technological Outlook
- 4.7 Porter's Five Forces Analysis
- 4.7.1 Bargaining Power of Suppliers
- 4.7.2 Bargaining Power of Buyers
- 4.7.3 Threat of New Entrants
- 4.7.4 Threat of Substitutes
- 4.7.5 Intensity of Competitive Rivalry
5 MARKET SIZE AND GROWTH FORECASTS (VALUE)
- 5.1 By Component
- 5.1.1 Solutions
- 5.1.2 Services
- 5.2 By Technology Type
- 5.2.1 Robotic Process Automation (RPA)
- 5.2.2 Machine Learning and Deep Learning
- 5.2.3 Natural Language Processing and Chatbots
- 5.2.4 Process and Task Mining
- 5.2.5 Computer Vision and Biometrics
- 5.3 By Deployment Mode
- 5.3.1 On-premise
- 5.3.2 Cloud
- 5.3.3 Hybrid
- 5.4 By End-User Enterprise Size
- 5.4.1 Large Enterprises
- 5.4.2 Small and Mid-Sized Enterprises (SMEs)
- 5.5 By End-User Industry
- 5.5.1 BFSI
- 5.5.2 Retail and e-Commerce
- 5.5.3 IT and Telecom
- 5.5.4 Manufacturing and Automotive
- 5.5.5 Healthcare and Life Sciences
- 5.5.6 Education
- 5.5.7 Others End-user Industry
- 5.6 By Geography
- 5.6.1 North America
- 5.6.1.1 United States
- 5.6.1.2 Canada
- 5.6.1.3 Mexico
- 5.6.2 South America
- 5.6.2.1 Brazil
- 5.6.2.2 Argentina
- 5.6.2.3 Rest of South America
- 5.6.3 Europe
- 5.6.3.1 Germany
- 5.6.3.2 United Kingdom
- 5.6.3.3 France
- 5.6.3.4 Italy
- 5.6.3.5 Spain
- 5.6.3.6 Russia
- 5.6.3.7 Rest of Europe
- 5.6.4 Asia Pacific
- 5.6.4.1 China
- 5.6.4.2 Japan
- 5.6.4.3 India
- 5.6.4.4 South Korea
- 5.6.4.5 ASEAN-5
- 5.6.4.6 Australia and New Zealand
- 5.6.4.7 Rest of Asia Pacific
- 5.6.5 Middle East and Africa
- 5.6.5.1 Middle East
- 5.6.5.1.1 United Arab Emirates
- 5.6.5.1.2 Saudi Arabia
- 5.6.5.1.3 Rest of Middle East
- 5.6.5.2 Africa
- 5.6.5.2.1 South Africa
- 5.6.5.2.2 Nigeria
- 5.6.5.2.3 Rest of Africa
- 5.6.5.1 Middle East
- 5.6.1 North America
6 COMPETITIVE LANDSCAPE
- 6.1 Market Concentration
- 6.2 Strategic Moves
- 6.3 Market Share Analysis
- 6.4 Company Profiles (includes Global level Overview, Market level overview, Core Segments, Financials as available, Strategic Information, Market Rank/Share for key companies, Products and Services, Recent Developments)
- 6.4.1 ABBYY Solutions Ltd.
- 6.4.2 akaBot (FPT Software)
- 6.4.3 Alteryx Inc.
- 6.4.4 Appian Corporation
- 6.4.5 Automation Anywhere Inc.
- 6.4.6 Blue Prism Ltd.
- 6.4.7 Catalytic Inc.
- 6.4.8 Celonis SE
- 6.4.9 IBM Corporation
- 6.4.10 Microsoft Corporation
- 6.4.11 Mitsubishi Electric Corporation
- 6.4.12 NICE Ltd.
- 6.4.13 OneGlobe LLC
- 6.4.14 Pegasystems Inc.
- 6.4.15 Rocketbot SpA
- 6.4.16 Salesforce Inc.
- 6.4.17 Simple Fractal LLC
- 6.4.18 SolveXia Pty Ltd.
- 6.4.19 UiPath Inc.
- 6.4.20 WorkFusion Inc.
7 MARKET OPPORTUNITIES AND FUTURE OUTLOOK
- 7.1 White-space and Unmet-Need Assessment

 超自動化市場:全球預測,2026-2032年
 超自動化市場:按技術、終端用戶產業和地區分類
 RPA和超自動化市場預測至2034年-按組件、部署模式、技術、企業規模、應用、最終用戶和地區分類的全球分析超自動化市場預測至2034年—按工具類型、組件、技術、應用、最終用戶和地區分類的全球分析
 2026年全球機器人流程自動化與超自動化市場報告勞動力自動化工具市場預測:至 2034 年—按組件、部署類型、組織規模、最終用戶和地區分類的全球分析企業自動化市場按組件、部署模式、公司規模和垂直行業分類 - 全球預測,2026-2032 年
 全球超自動化市場規模、佔有率、趨勢和成長分析報告(2026-2034)
 超自動化市場 - 全球產業規模、佔有率、趨勢、機會及預測(按技術類型、部署類型、最終用戶、地區和競爭格局分類,2021-2031 年)全球超自動化市場-2025年至2030年預測