


 |
市場調查報告書
商品編碼
2097133
汽車綠色輪胎:市場佔有率分析、產業趨勢與統計及成長預測(2026-2031)Automotive Green Tires - Market Share Analysis, Industry Trends & Statistics, Growth Forecasts (2026 - 2031) |
||||||

※ 本網頁內容可能與最新版本有所差異。詳細情況請與我們聯繫。
根據 Mordor Intelligence 預測,汽車綠色輪胎市場規模預計將從 2025 年的 1,337.3 億美元成長到 2026 年的 1,482.2 億美元,並將從 2026 年到 2031 年以 10.84% 的複合年成長,到 2031 年達到 2479 億美元。
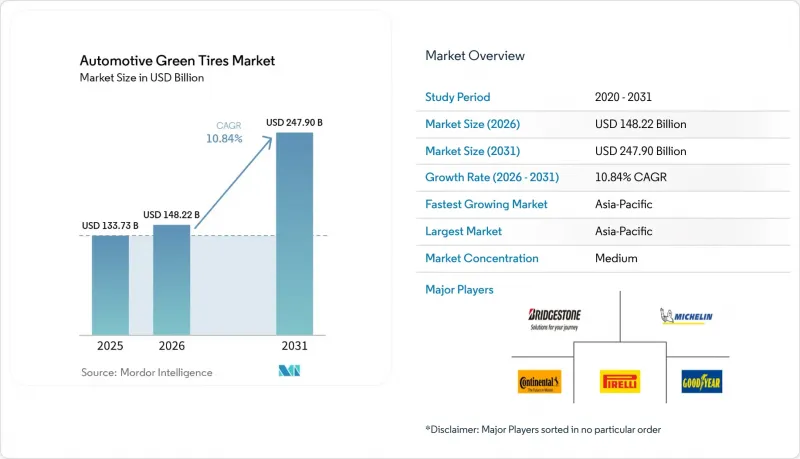
本報告按車輛類型(乘用車和商用車)、最終用戶(整車製造商和售後市場)、材料(天然橡膠輪胎、合成橡膠輪胎、二氧化矽複合輪胎、生物基聚合物輪胎等)、銷售管道(線下和線上)以及地區進行細分。市場預測以價值(美元)和銷售量(單位)表示。
全球汽車綠色輪胎市場趨勢及洞察
電動車產量快速成長
全球電動車組裝需要能夠承受瞬時扭力、靜音且滾動阻力最小的輪胎。將於2025年12月生效的全新FMVSS 305a法規,對輪胎安全性能提出了與電池驅動系統相符的要求。通用汽車(GM)計劃在2025年將其在北美的電動車年產能提升至100萬輛,這將進一步增加對特種輪胎的需求。美國環保署(EPA)的多污染物排放標準(2027年至2032年環境標準)旨在將輕型車輛的溫室氣體排放量減少50%,正是推動這項轉型的重要因素。這些法規將把以電動車為中心的性能要求納入所有新型乘用車和商用車平台。隨著汽車製造商競相延長續航里程,最佳化電池效率的輪胎已成為採購的重中之重。
更嚴格的全球二氧化碳排放法規和輪胎標籤法規正在重塑產品開發。
歐洲7號排放標準將於2028年7月起首次對輪胎磨損顆粒物排放設定上限。永續產品生態設計規則將於2025年4月前推出輪胎數位化產品護照,提供完整的生命週期概覽。中國2024年碳足跡標準要求輪胎製造商量化整個生產過程中的排放量。美國輪胎製造商協會已確定五種物質可作為6PPD的潛在替代品,以滿足加州更安全消費品規則的要求。如今,遵守法規已成為一項實實在在的品牌優勢,那些將環境指標融入核心設計而非僅僅添加標籤檢視的公司更受青睞。
高昂的初始成本是市場滲透的一大挑戰。
美國環保署關於有害空氣污染物的法規每年為美國輪胎工廠增加1,330萬美元的遵循成本。中國2024-2025年節能行動計畫收緊了工業排放法規,並推高了當地的生產成本。美國美國能源局8,800萬美元的「車輛技術」津貼承認,更環保的出行方式仍需要補貼來彌補成本缺口。高價策略正在加重車隊預算的負擔,企業更注重縮短投資回收期而非輪胎壽命。新興市場融資困難進一步阻礙了環保輪胎的普及。
細分市場分析
預計到2025年,乘用車仍將維持最大的市場佔有率,達到62.76%,而商用車則以12.05%的複合年成長率穩定成長。智慧感測器組件和降低滾動阻力有助於營運商降低燃油成本,從而抵消價格溢價。美國環保署(EPA)提高燃油經濟性標準(CAFE標準)以及強制車隊電氣化進一步推動了這些數據的成長。相較之下,消費者的接受度將取決於品牌訊息和經銷商的影響力。隨著商用車實地測試驗證了輪胎的耐用性,永續輪胎市場持續多元化發展,推動銷售量成長,這將惠及所有車型類別。未來,貨運領域已建立的成本曲線也可能推動乘用車領域對永續輪胎的採用。
在商用車平台領域,電動動力系統的高扭力正在加速輪胎複合材料的創新。車隊管理人員正在利用遠端資訊處理技術分析輪胎磨損模式,從而推動對數據驅動型低碳車型的需求。加州和歐盟的政策將商用車隊的排放量與採購額度掛鉤,進一步加速了向永續技術的轉型。雖然乘用車市場穩定成長,但由於收入彈性較大的購買行為的影響,在補貼地區之外,其普及速度正在放緩。
售後市場業務正以9.55%的複合年成長率快速擴張,逐步蠶食原廠配套(OEM)67.85%的市佔率。汽車製造商正將輪胎碳排放數據納入供應商評估標準,以達到其範圍3排放目標。通用汽車承諾在2040年實現碳中和,這清晰地表明了這一發展方向。大量合約為輪胎製造商提供了清晰的需求預測,有助於提升長期研發投資的回報。另一方面,售後市場管道依賴消費者認知和安裝商推薦,而這些因素對於快速滲透市場而言可靠性較低。
隨著OEM市場的成長,供應商的議價能力正在發生變化,製造商必須與車輛開發週期和數位化通行證要求保持一致。符合汽車製造商標準的供應商可以確保所有新車型的穩定訂單量和品牌曝光。售後市場需求仍然強勁,尤其是在老舊車輛的更換方面,但隨著OEM原廠配套在首次銷售時就確立了永續的選擇,其成長速度正在放緩。
區域分析
預計到2025年,亞太地區將佔據永續輪胎市場49.10%的佔有率,並在2031年之前以9.37%的複合年成長率成長。中國的「十四五」規劃旨在將資源生產力提高20%,並將輪胎和橡膠回收列為優先事項。印度正在加強對濕地抓地力、滾動阻力和噪音的監管,使國內生產與出口預期保持一致。日本正在資助一條纖維素奈米纖維試點生產線,該生產線可以減少輪胎化合物的全生命週期排放。這些協調一致的政策正在建立以本地為中心的供應鏈,降低進口風險,並確保亞太地區繼續保持永續輪胎創新中心的地位。
在歐洲,將環境標準直接納入立法,為經濟成長奠定了基礎,從而為製造商提供了對低環境影響化合物的可預測需求。隨著歐盟7排放標準對粒狀物排放的限制以及生態設計數位護照的實施,輪胎磨損和碳足跡的檢驗數據很快將成為必要。投資回收炭黑和熱解叢集有助於企業完成材料循環並獲得合規積分。隨著許多新興市場採用歐盟標準,符合這些標準的企業可以獲得出口優勢。
在北美,聯邦政府的研究津貼和各州的回收激勵措施共同推動永續輪胎市場轉型為循環經濟模式。美國能源局對生物丁二烯的資助以及加州的輪胎激勵計劃,體現了上游創新與下游需求驅動力的融合。車隊營運商正著重推廣數據豐富的輪胎,以簡化重型車輛遵守更嚴格的溫室氣體排放標準的流程,從而促進長途運輸路線的普及。雖然南美、中東和非洲的擴張速度相對較慢,但各公司正在採用歐盟標籤標準以確保出口准入。跨國原始設備製造商的採購指南正在推動這些價格敏感地區採用永續技術,而永續輪胎市場也正逐步擴展到傳統主要市場之外。
其他好處:
- Excel格式的市場預測(ME)表
- 3個月的分析師支持
目錄
第1章:引言
- 研究假設和市場定義
- 調查範圍
第2章:調查方法
第3章執行摘要
第4章 市場狀況
- 市場概覽
- 市場促進因素
- 電動車產量快速成長
- 加強全球二氧化碳排放法規與輪胎標示法規
- 從2024年起,替換輪胎的需求將激增。
- 將感測器整合到智慧輪胎中可以降低生命週期成本。
- OEM Scope 3 計算鼓勵採用更環保的材料。
- 東協稻殼灰衍生二氧化矽的商業化
- 市場限制因素
- 與傳統輪胎相比,初始成本較高
- 大型商用車輛車隊的裝載限制
- 醫用手套與生物橡膠原料之間的競爭
- 歐盟對粒狀物排放的限制正在減緩新化合物的研發。
- 價值/供應鏈分析
- 監理情勢
- 技術展望
- 波特五力模型
第5章 市場規模與成長預測
- 車輛類型
- 搭乘用車
- 商用車輛
- 最終用戶
- OEM
- 售後市場
- 材料類型
- 含有大量天然橡膠的輪胎
- 含有大量合成橡膠的輪胎
- 二氧化矽基複合輪胎
- 生物基聚合物輪胎
- 再生材料輪胎
- 透過分銷管道
- 線下(經銷商和零售連鎖店)
- 線上(電子商務平台)
- 按地區
- 北美洲
- 美國
- 加拿大
- 其他北美國家
- 南美洲
- 巴西
- 阿根廷
- 其他南美國家
- 歐洲
- 德國
- 英國
- 法國
- 義大利
- 西班牙
- 俄羅斯
- 其他歐洲國家
- 亞太地區
- 中國
- 印度
- 日本
- 韓國
- 其他亞太國家
- 中東和非洲
- 沙烏地阿拉伯
- 阿拉伯聯合大公國
- 南非
- 埃及
- 其他中東和非洲國家
- 北美洲
第6章 競爭情勢
- 市場集中度
- 策略趨勢
- 市佔率分析
- 公司簡介
- Michelin Group
- Bridgestone Corporation
- Continental AG
- Goodyear Tire & Rubber Company
- Pirelli & C. SpA
- Yokohama Rubber Co. Ltd.
- Apollo Tyres Ltd.
- Hankook Tire & Technology
- Sumitomo Rubber Industries Ltd.
- Nokian Tyres plc
- Toyo Tire Corporation
- Kumho Tire Co. Inc.
- Giti Tire
- Linglong Tire
- CEAT Ltd.
第7章 市場機會與未來展望
According to Mordor Intelligence, the automotive green tires market size is expected to grow from USD 133.73 billion in 2025 to USD 148.22 billion in 2026 and is forecast to reach USD 247.9 billion by 2031 at 10.84% CAGR over 2026-2031.
This report is Segmented by Vehicle Type (Passenger Vehicles and Commercial Vehicles), End-User Type (OEM and Aftermarket), Material Type (Natural Rubber-Rich Tires, Synthetic Rubber-Rich Tires, Silica-Based Composite Tires, Bio-Based Polymer Tires, and More), and Distribution Channel (Offline and Online) Geography. The Market Forecasts are Provided in Terms of Value (USD) and Volume (Units).
Global Automotive Green Tires Market Trends and Insights
Surging Electric-Vehicle (EV) Production
Global EV assembly lines require tires that handle instant torque, low noise, and minimal rolling resistance. New FMVSS 305a rules, effective December 2025, align tire safety with battery-electric drivetrains . General Motors plans 1 million EV units of annual North American capacity by 2025, magnifying demand for specialized compounds. Environmental standards for 2027-2032, EPA multi-pollutant standards target a 50% GHG cut in light-duty vehicles, reinforcing the shift. These regulations embed EV-centric performance in every new passenger and commercial platform. As automakers race to extend driving range, tires optimized for battery efficiency become a procurement priority
Stricter global CO2 & Tire-Labelling Regulations Reshape Product Development
Euro 7 introduces the world's first mandatory tire-wear particulate caps beginning July 2028 . The Ecodesign for Sustainable Products Regulation will add digital product passports for tires by April 2025, capturing the end-to-end lifecycle. China's 2024 carbon footprint standard obliges tire producers to quantify emissions across manufacturing stages. The U.S. Tire Manufacturers Association has identified five potential 6PPD alternatives to meet California's Safer Consumer Products rule. Compliance now confers a tangible branding advantage, rewarding firms that embed environmental metrics into core design rather than bolt-on labeling.
High Upfront Cost Premium Challenges Market Penetration
EPA hazardous-air-pollutant rules add USD 13.3 million in annual compliance expense to U.S. tire plants . China's 2024-2025 Energy Conservation action plan tightens industrial emissions, raising local production costs. DOE's USD 88 million Vehicle Technologies grants acknowledge that greener mobility still needs subsidies to close cost gaps. Premium pricing strains fleet budgets that prioritize payback horizons shorter than tire life. Credit access in emerging economies further slows uptake.
Other drivers and restraints analyzed in the detailed report include:
- Booming Replacement-Tire Demand Creates Aftermarket Opportunities
- Smart-Tire Sensor integration Transforms Lifecycle Economics
- Load-Bearing Limits in Heavy Commercial Fleets Constrain Adoption
For complete list of drivers and restraints, kindly check the Table Of Contents.
Segment Analysis
Commercial vehicles added a 12.05% CAGR growth lane, even though passenger cars retained the largest share with 62.76% in 2025. Smart-sensor packages and lower rolling resistance allow operators to cut fuel bills, offsetting the price premium. EPA CAFE increments and fleet electrification mandates amplify this calculus. In contrast, consumer uptake depends on brand messaging and dealership influence. As commercial trials validate durability, the sustainable tire market continues diversifying, encouraging volume scaling that benefits all categories. Over time, passenger-vehicle adoption will gain from cost curves established in freight.
Commercial platforms also expose tires to higher torque from electric drivetrains, accelerating compound innovation. Fleet managers use telematics to analyze wear, reinforcing demand for data-ready, low-carbon models. California and the EU policies link commercial-fleet emissions to procurement credits, further tipping decisions toward sustainable technologies. Passenger market growth remains steady but faces income-elastic buying behavior, slowing conversion outside subsidized jurisdictions.
Aftermarket programs are growing at a 9.55% CAGR, slowly eroding the OEM's 67.85% hold. Automakers embed tire carbon data in supplier scorecards to hit Scope-3 targets. GM's carbon-neutral pledge by 2040 exemplifies the direction. Large volume contracts give tire firms forecast clarity, supporting long R&D paybacks. Meanwhile, aftermarket channels rely on consumer awareness and installer recommendations, factors less reliable for rapid penetration.
OEM growth shifts bargaining power, requiring manufacturers to align with vehicle development cycles and digital passport requirements. Suppliers that meet automaker thresholds gain repeat volume and brand exposure on every new model. Aftermarket demand remains sizeable, especially for replacement in aging vehicle parks, but growth moderates as OEM fitments lock in sustainable options at first sale.
Complete Report Scope:
- By Vehicle Type
- Passenger Vehicles
- Commercial Vehicles
- By End-User
- OEM
- Aftermarket
- By Material Type
- Natural-Rubber-Rich Tires
- Synthetic-Rubber-Rich Tires
- Silica-Based Composite Tires
- Bio-Based Polymer Tires
- Recycled-Material Tires
- By Distribution Channel
- Offline (Dealers & Retail Chains)
- Online (E-commerce Platforms)
- By Geography
- North America
- United States
- Canada
- Rest of North America
- South America
- Brazil
- Argentina
- Rest of South America
- Europe
- Germany
- United Kingdom
- France
- Italy
- Spain
- Russia
- Rest of Europe
- Asia-Pacific
- China
- India
- Japan
- South Korea
- Rest of Asia-Pacific
- Middle East and Africa
- Saudi Arabia
- United Arab Emirates
- South Africa
- Egypt
- Rest of Middle East and Africa
- North America
Geography Analysis
Asia-Pacific held 49.10% of the sustainable tire market share in 2025 and is projected to grow at a 9.37% CAGR through 2031. China's 14th Five-Year Plan seeks a 20% rise in resource productivity and identifies tire-rubber recycling as a priority. India enforces wet-grip, rolling-resistance, and noise limits that align domestic production with export expectations. Japan funds cellulose-nanofiber pilot lines that can cut lifecycle emissions in tire compounds. These coordinated policies build localized supply chains, buffer import risks, and keep Asia-Pacific at the center of sustainable tire innovation.
Europe anchors growth by writing environmental criteria directly into law, giving manufacturers predictable demand for low-impact compounds. Euro 7 particulate caps and the Ecodesign digital passport will soon require verifiable data on tire wear and carbon footprints. Investments in recovered carbon black and pyrolysis clusters help companies close material loops and secure compliance credits. Firms that meet these benchmarks gain export leverage because many emerging markets adopt EU norms.
North America blends federal research grants with state recycling incentives, steering the sustainable tire market toward circular models. DOE funding for bio-butadiene and California's Tire Incentive Program illustrate the mix of upstream innovation and downstream demand pulls. Fleet operators value data-rich tires that simplify compliance with tighter heavy-duty greenhouse-gas standards, lifting uptake on long-haul routes. South America, the Middle East, and Africa expand more slowly yet adopt EU labeling to safeguard export access. Multinational OEM procurement guidelines diffuse sustainable technologies into these price-sensitive regions, gradually lifting the sustainable tire market size beyond its traditional strongholds.
- Michelin Group
- Bridgestone Corporation
- Continental AG
- Goodyear Tire & Rubber Company
- Pirelli & C. SpA
- Yokohama Rubber Co. Ltd.
- Apollo Tyres Ltd.
- Hankook Tire & Technology
- Sumitomo Rubber Industries Ltd.
- Nokian Tyres plc
- Toyo Tire Corporation
- Kumho Tire Co. Inc.
- Giti Tire
- Linglong Tire
- CEAT Ltd.
Additional Benefits:
- The market estimate (ME) sheet in Excel format
- 3 months of analyst support
TABLE OF CONTENTS
1 Introduction
- 1.1 Study Assumptions & Market Definition
- 1.2 Scope of the Study
2 Research Methodology
3 Executive Summary
4 Market Landscape
- 4.1 Market Overview
- 4.2 Market Drivers
- 4.2.1 Surging electric-vehicle (EV) production
- 4.2.2 Stricter global CO2 and tire-labelling regulations
- 4.2.3 Booming replacement-tire demand post-2024
- 4.2.4 Smart-tire sensor integration lowers lifecycle cost
- 4.2.5 OEM Scope-3 accounting pushes greener materials
- 4.2.6 ASEAN rice-husk-ash silica commercialisation
- 4.3 Market Restraints
- 4.3.1 High upfront cost premium vs. conventional tires
- 4.3.2 Load-bearing limits in heavy commercial fleets
- 4.3.3 Bio-rubber feedstock competition with medical gloves
- 4.3.4 EU particulate-emission caps delaying new compounds
- 4.4 Value/Supply-Chain Analysis
- 4.5 Regulatory Landscape
- 4.6 Technological Outlook
- 4.7 Porter's Five Forces
- 4.7.1 Threat of New Entrants
- 4.7.2 Bargaining Power of Buyers/Consumers
- 4.7.3 Bargaining Power of Suppliers
- 4.7.4 Threat of Substitute Products
- 4.7.5 Intensity of Competitive Rivalry
5 Market Size & Growth Forecasts (Value (USD) and Volume (Units))
- 5.1 By Vehicle Type
- 5.1.1 Passenger Vehicles
- 5.1.2 Commercial Vehicles
- 5.2 By End-User
- 5.2.1 OEM
- 5.2.2 Aftermarket
- 5.3 By Material Type
- 5.3.1 Natural-Rubber-Rich Tires
- 5.3.2 Synthetic-Rubber-Rich Tires
- 5.3.3 Silica-Based Composite Tires
- 5.3.4 Bio-Based Polymer Tires
- 5.3.5 Recycled-Material Tires
- 5.4 By Distribution Channel
- 5.4.1 Offline (Dealers & Retail Chains)
- 5.4.2 Online (E-commerce Platforms)
- 5.5 By Geography
- 5.5.1 North America
- 5.5.1.1 United States
- 5.5.1.2 Canada
- 5.5.1.3 Rest of North America
- 5.5.2 South America
- 5.5.2.1 Brazil
- 5.5.2.2 Argentina
- 5.5.2.3 Rest of South America
- 5.5.3 Europe
- 5.5.3.1 Germany
- 5.5.3.2 United Kingdom
- 5.5.3.3 France
- 5.5.3.4 Italy
- 5.5.3.5 Spain
- 5.5.3.6 Russia
- 5.5.3.7 Rest of Europe
- 5.5.4 Asia-Pacific
- 5.5.4.1 China
- 5.5.4.2 India
- 5.5.4.3 Japan
- 5.5.4.4 South Korea
- 5.5.4.5 Rest of Asia-Pacific
- 5.5.5 Middle East and Africa
- 5.5.5.1 Saudi Arabia
- 5.5.5.2 United Arab Emirates
- 5.5.5.3 South Africa
- 5.5.5.4 Egypt
- 5.5.5.5 Rest of Middle East and Africa
- 5.5.1 North America
6 Competitive Landscape
- 6.1 Market Concentration
- 6.2 Strategic Moves
- 6.3 Market Share Analysis
- 6.4 Company Profiles (Includes Global Level Overview, Market Level Overview, Core Segments, Financials as Available, Strategic Information, Market Rank/Share, Products & Services, Recent Developments)
- 6.4.1 Michelin Group
- 6.4.2 Bridgestone Corporation
- 6.4.3 Continental AG
- 6.4.4 Goodyear Tire & Rubber Company
- 6.4.5 Pirelli & C. SpA
- 6.4.6 Yokohama Rubber Co. Ltd.
- 6.4.7 Apollo Tyres Ltd.
- 6.4.8 Hankook Tire & Technology
- 6.4.9 Sumitomo Rubber Industries Ltd.
- 6.4.10 Nokian Tyres plc
- 6.4.11 Toyo Tire Corporation
- 6.4.12 Kumho Tire Co. Inc.
- 6.4.13 Giti Tire
- 6.4.14 Linglong Tire
- 6.4.15 CEAT Ltd.
7 Market Opportunities & Future Outlook

 汽車綠色輪胎市場:全球市場預測,2026-2032年
 低滾動阻力輪胎市場分析及預測(至2035年):按類型、產品、技術、應用、材料類型、最終用戶、功能、安裝類型和解決方案分類
 汽車綠色輪胎市場-全球產業規模、佔有率、趨勢、機會與預測:按車輛類型、需求類別、輪胎結構類型、地區和競爭格局分類,2021-2031年
 2026年全球汽車綠色輪胎市場報告綠色輪胎市場分析及預測(至2035年):依類型、產品類型、技術、材質、應用、最終用戶、功能、製程、安裝類型及解決方案分類
 全球綠色輪胎市場規模、佔有率、趨勢和成長分析報告(2026-2034年)2026年全球綠色輪胎市場報告乘用車綠色輪胎市場-全球產業規模、佔有率、趨勢、機會、預測:按車輛類型、應用、需求類別、地區和競爭格局分類,2021-2031年汽車和三輪車綠色輪胎市場-全球產業規模、佔有率、趨勢、機會及預測(按輪胎類型、需求類別、地區和競爭格局分類,2021-2031年)中重型商用車綠色輪胎市場-全球產業規模、佔有率、趨勢、機會及預測,依輪胎類型(子午線輪胎、斜交輪胎)、需求類別(OEM、替換)、區域及競爭格局分類,2021-2031年預測