


 |
市場調查報告書
商品編碼
2073636
動力設備:市場佔有率分析、產業趨勢與統計、成長預測(2026-2031)Power Equipment - Market Share Analysis, Industry Trends & Statistics, Growth Forecasts (2026 - 2031) |
||||||

※ 本網頁內容可能與最新版本有所差異。詳細情況請與我們聯繫。
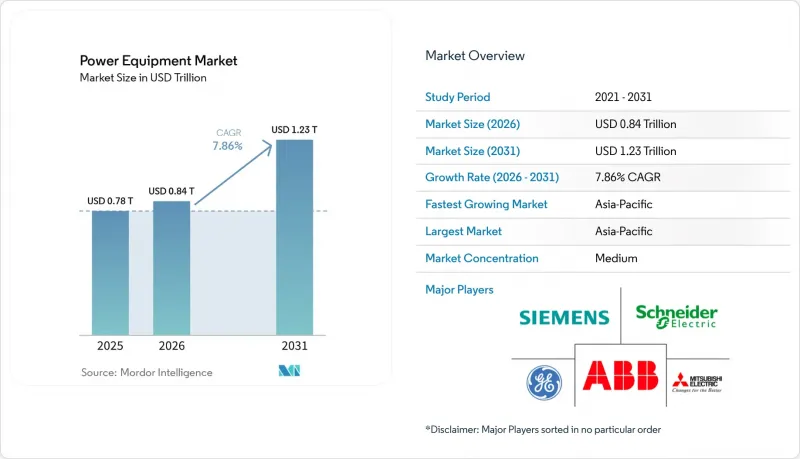
據 Mordor Intelligence 稱,2025 年電力設備市場價值為 7,800 億美元,預計到 2031 年將達到 1.23 兆美元,而 2026 年為 8,400 億美元,預測期(2026-2031 年)的複合年成長率為 7.86%。
本報告按設備類型(渦輪機、變壓器、開關設備、電力電纜等)、電源(火力、核能、可再生能源)、電壓等級(1 kV 以下、1-36 kV、36 kV 以上)、應用(發電、輸電、配電)、最終用戶(住宅、工業、商業、公共產業)和地區(北美、歐洲、亞太地區等)分類。
全球電力設備市場趨勢與洞察
可再生能源主導的電網快速現代化
全球電力公司正在維修電網,以應對太陽能和風能逆變器引起的電壓波動和反向故障電流。國際能源總署(IEA)的數據顯示,2024年將有507吉瓦的可再生能源發電裝置容量投入運作,到2030年,電網加固投資將達到6,000億美元。變壓器製造商目前正在採用分接頭轉換器開關,而開關設備供應商則正在引入電弧抑制模組來處理雙向電流。西門子能源公司報告稱,受北海離岸風力發電電場擴張以及澳洲太陽能和儲能設施建設的推動,2025年電網穩定訂單將比上一年成長34%。 IEEE 1547-2018穿越能力標準已成為北美地區的採購標準,迫使供應商對其防孤島能力進行認證。這些要求正促使研發預算從單純的效率提升轉向互通性。
新興經濟體的都市化推動了基礎設施擴張
根據聯合國預測,2024年至2035年間,印度、印尼和奈及利亞的都市區預計將增加4.2億,需要新增280吉瓦的發電容量。印度電網公司已於2025年簽訂了一份價值42億美元的契約,採購765千伏級變壓器;而印尼國家電力公司(PLN)則計劃在2030年前每年採購1.5萬台配電變壓器。為了滿足在地採購需求,ABB於2025年6月在班加羅爾開設了一家佔地5萬平方公尺的變壓器製造廠。供應商們正在開發成本最佳化、前置作業時間更短的產品,優先考慮提高產量而非僅僅提升效率。
銅和稀土元素的供應鏈極不穩定。
2024年至2026年中期,銅價在每噸9100美元至10850美元之間波動,導致變壓器元件成本波動15%至18%。 2025年初,受中國出口配額收緊的影響,氧化釹價格飆升至每噸94,000美元。通用電氣(GE)重新設計了發電機轉子,降低了稀土元素含量,以抵消其2025年證券報告中揭露的220個基點的利潤率壓力。西方國家政府在2025年撥款28億美元用於國內提煉津貼,但預計商業化生產要到2028年或更晚才能開始。供應商正在試行銅鋁混合材料和鐵氧體磁體,犧牲部分效率以確保成本可預測性。
細分市場分析
到2025年,渦輪機將佔銷售額的27.1%,佔據電力設備市場最大佔有率,預計到2031年將以9.2%的複合年成長率成長。 2025年2月,三菱電力公司獲得訂單,訂購六台M701JAC機組,以應對德克薩斯州太陽能發電的不穩定性。發電機,特別是氫燃料電池相容的往復式發電機,在離網礦山和資料中心園區的應用日益廣泛。同時,變壓器預計將呈現兩種發展趨勢:36千伏以下的配電變壓器將為都市區電網供電,而100兆伏安及以上的功率變壓器將為超高壓輸電線路供電。開關設備正向固態中斷技術轉型,ABB於2024年收購了軟體定義保護裝置製造商,便是例證。高壓直流海底電纜市場正快速成長,普睿司曼公司高達80億歐元的累積訂單便是明證。
這些產品中整合的數位化感測器能夠產生預測性維護訊息,從而縮短停電時間並降低運維預算。邊緣分析使電力公司能夠推遲昂貴的設備更換,而製造商則可以透過訂閱式儀錶板將數據貨幣化,從而強化支撐整個電力設備市場的經常性收入結構。
預計到2025年,可再生能源將佔總需求的61.2%,年複合成長率達12.4%,這將促使設計目標從容量轉向可控制性。變壓器需要更寬的電壓調節範圍,斷路器必須能夠處理雙向故障。火力發電廠正在轉型為高度柔軟性的峰值響應型電廠,西門子能源的HL系列產品能夠在10分鐘內將輸出功率從0%調整到100%。在核能領域,到2028年,小型模組化反應器將需要抗輻射加固的開關設備。
太陽能發電廠採用分散式中壓設備,而離岸風力發電依賴海底電纜和浮體式變電站。二氧化碳捕集與儲存(CCS)維修增加了輔助負載,需要更高的發電機輸出功率。核能發電廠運作許可證的續期推動了數位控制系統的升級,以符合美國美國核能管理委員會(NRC)的網路安全法規。因此,設備架構正變得越來越獨立於燃料,整合化比特定型號更為重要。
區域分析
預計到2025年,亞太地區將佔全球銷售額的50.4%,維持9.0%的複合年成長率,主要得益於中國±800千伏輸電走廊、印度可再生能源競標以及東南亞國協的煤改氣轉型。國家電網在2024年投資580億美元,專注於建造沿海負載中心的長距離高壓直流輸電線路。印度在2024年進行了50吉瓦可再生能源競標,最終獲得一份價值120億美元的輸電合約。日本千葉1.2吉瓦離岸風力發電電場已獲得2025年的訂單,該項目將需要浮體式變電站和66千伏電纜。韓國的「綠色新政」已累計73.4兆韓元用於2030年建造數位化變電站。東南亞國協已從亞洲開發銀行(亞銀)獲得42億美元的資金籌措,用於2025年發展電網。
在北美和歐洲,電網韌性是重中之重。美國《通貨膨脹控制法案》提供的稅額扣抵正在推動諸如3吉瓦的TransWest Express輸電線路等項目。德國已批准一項240億歐元的擴建計劃,其中包括Zoolink輸電線路,計劃於2025年實施。英國已製定藍圖,計劃興建一條總投資180億英鎊、全長4000公里的海上輸電線路。北歐國家正在擴大跨國輸電線路,包括耗資13億歐元的Nordlink輸電線路。
南美和中東的商業機會正在不斷擴大。巴西於2024年拍賣了15吉瓦的輸電權,西門子能源和WEG參與了競標。智利的阿塔卡馬太陽能走廊正在使用500千伏輸電線路,這些線路已於2025年投入運作。沙烏地阿拉伯於2024年透過公共投資基金(PIF)累計75億美元用於可再生能源輸電。杜拜水電局(DEWA)於2025年授予了一份價值18億美元的契約,用於建設一條400千伏輸電網,以便將穆罕默德·本·拉希德太陽能園區併入電網。世界銀行資助的非洲離網微電網計畫也進一步擴大了電力需求的多元化。
其他好處:
- Excel格式的市場預測(ME)表
- 3個月的分析師支持
目錄
第1章:引言
- 研究假設和市場定義
- 調查範圍
第2章:調查方法
第3章執行摘要
第4章 市場狀況
- 市場概覽
- 市場促進因素
- 可再生能源主導的電網快速現代化
- 新興國家都市化推動基礎建設擴張
- 為超大規模資料中心擴建備用電源設施
- 非洲和亞洲的農村電氣化和微電網
- 點對點微電網的興起需要雙向開關設備。
- 透過「設備即服務」訂閱模式降低資本支出 (Capex)。
- 市場限制因素
- 老舊飛機的運作和維護成本很高。
- 銅和稀土元素的供應鏈極不穩定。
- 智慧開關設備的網路安全認證出現延誤
- 由於逆變器型電源的普及,對變壓器的需求減少。
- 供應鏈分析
- 監理情勢
- 技術展望
- 波特五力模型
第5章 市場規模與成長預測
- 依設備類型
- 渦輪
- 發電機
- 變壓器
- 切換裝置
- 斷路器
- 電源線
- 其他設備(輸電塔、電壓調節器、絕緣子、電容器、並聯電抗器、繼電器、變電站構築物等)
- 透過電源
- 火力發電
- 核能
- 可再生能源
- 電壓等級
- 1千伏或更低
- 1~36 kV
- 36千伏或以上
- 透過使用
- 發電
- 動力傳輸
- 配電
- 最終用戶
- 住宅
- 商業
- 產業
- 公用事業
- 按地區
- 北美洲
- 美國
- 加拿大
- 墨西哥
- 歐洲
- 德國
- 法國
- 英國
- 義大利
- 北歐國家
- 俄羅斯
- 其他歐洲國家
- 亞太地區
- 中國
- 印度
- 日本
- 韓國
- 東南亞國協
- 澳洲和紐西蘭
- 其他亞太國家
- 南美洲
- 巴西
- 阿根廷
- 智利
- 其他南美國家
- 中東和非洲
- 沙烏地阿拉伯
- 阿拉伯聯合大公國
- 南非
- 埃及
- 其他中東和非洲國家
- 北美洲
第6章 競爭情勢
- 市場集中度
- 策略趨勢(併購、聯盟、購電協議)
- 市場佔有率分析(主要公司的市場排名和佔有率)
- 公司簡介
- General Electric
- Siemens AG
- Schneider Electric
- Mitsubishi Electric
- Eaton
- ABB
- Toshiba
- Honeywell
- Bharat Heavy Electricals
- Crompton Greaves
- Larsen & Toubro
- Fuji Electric
- Rockwell Automation
- Cummins
- Caterpillar
- Kohler
- Generac Holdings
- Hitachi Energy
- WEG SA
- Siemens Energy
第7章 市場機會與未來展望
According to Mordor Intelligence, the power equipment market size was valued at USD 0.78 trillion in 2025 and is estimated to grow from USD 0.84 trillion in 2026 to reach USD 1.23 trillion by 2031, at a CAGR of 7.86% during the forecast period (2026-2031).
This report is Segmented by Equipment Type (Turbines, Transformers, Switchgears, Power Cables, and More), Power Generation Source (Thermal, Nuclear, and Renewables), Voltage Class (Up To 1 KV, 1 To 36 KV, and Above 36 KV), Application (Power Generation, Transmission, and Distribution), End-User (Residential, Industrial, Commercial, and Utility), and Geography (North America, Europe, Asia-Pacific, and More).
Global Power Equipment Market Trends and Insights
Rapid Renewable-Led Grid Modernization
Global operators are refitting networks to manage voltage fluctuations and reverse fault currents introduced by solar and wind inverters. IEA data show 507 gigawatts of renewable capacity came online in 2024, with USD 600 billion in grid reinforcements needed by 2030. Transformer suppliers now integrate sub-second tap-changers, while switchgear vendors deploy arc-suppression modules that address bidirectional currents. Siemens Energy reported a 34% year-on-year rise in grid-stabilization orders in 2025, driven by North Sea offshore wind and Australia's solar-plus-storage build-outs. IEEE 1547-2018 ride-through compliance has become the baseline for North American procurement, forcing vendors to certify anti-islanding features. These requirements are pushing R&D budgets toward interoperability rather than raw efficiency.
Urbanization-Fuelled Infrastructure Expansion in Emerging Economies
The United Nations projects India, Indonesia, and Nigeria will add 420 million urban residents between 2024 and 2035, demanding 280 gigawatts of new capacity. India's Power Grid Corporation awarded USD 4.2 billion of 765-kilovolt contracts in 2025, while Indonesia's PLN is procuring 15,000 distribution transformers annually through 2030. ABB opened a 50,000-square-meter transformer facility in Bengaluru in June 2025 to satisfy local-content rules. Suppliers are engineering cost-optimized products with shorter lead times, emphasizing volume over incremental efficiency.
Volatile Copper & Rare-Earth Supply Chains
Copper prices swung between USD 9,100 and USD 10,850 per ton from 2024 to mid-2026, creating 15%-18% bill-of-materials variance for transformers. Neodymium oxide spiked to USD 94,000 per ton in early 2025 as Chinese export quotas tightened. GE redesigned generator rotors with lower rare-earth content to offset a 220-basis-point margin squeeze reported in 2025 filings. Western governments issued USD 2.8 billion of grants in 2025 for domestic refining, but commercial output will not arrive before 2028. Vendors are trialing copper-aluminum hybrids and ferrite magnets, trading some efficiency for cost predictability.
Other drivers and restraints analyzed in the detailed report include:
- Hyperscale Data-Center Back-Up Power Build-Out
- Rural Electrification & Mini-Grids
- Cyber-Security Certification Delays for Smart Switchgear
For complete list of drivers and restraints, kindly check the Table Of Contents.
Segment Analysis
Turbines captured 27.1% of 2025 revenue, underpinning the largest slice of the power equipment market share, and they are set to expand at a 9.2% CAGR through 2031. Mitsubishi Power won a USD 1.1 billion order in February 2025 for six M701JAC units supporting Texas solar variability. Generators, particularly hydrogen-ready reciprocating sets, are scaling in off-grid mines and data-center campuses. Meanwhile, transformers face a two-track future: sub-36-kilovolt distribution models supply urban networks, whereas 100 MVA-plus power units feed ultra-high-voltage corridors. Switchgear is transitioning to solid-state interruption, evidenced by ABB's 2024 acquisition of a software-defined protection firm. HVDC subsea cables are booming, as Prysmian's EUR 8 billion backlog indicates.
Digitally enabled sensors embedded across these products generate predictive insights that shorten outage durations and cut O&M budgets. Edge analytics allow utilities to defer costly replacements, while manufacturers monetize data via subscription dashboards, reinforcing recurring-revenue profiles that underpin the broader power equipment market.
Renewables claimed 61.2% of 2025 demand and are forecast for a 12.4% CAGR, shifting design targets from capacity to controllability. Transformers now require broader voltage-regulation bands, and circuit breakers must clear bidirectional faults. Thermal plants are pivoting to flexible peakers; Siemens Energy's HL-class ramps from 0% to 100% in under 10 minutes. Nuclear's small modular reactors will necessitate radiation-tolerant switchgear by 2028.
Solar farms deploy distributed medium-voltage gear, while offshore wind hinges on subsea cables and floating substations. Carbon-capture retrofits add auxiliary loads, compelling uprated generators. Nuclear relicensing cycles drive digital control upgrades compliant with NRC cyber rules. Consequently, equipment architecture has become fuel-agnostic, emphasizing integration over type.
Complete Report Scope:
- By Equipment Type
- Turbines
- Generators
- Transformers
- Switchgear
- Circuit Breakers
- Power Cables
- Other Equipment (Transmission Towers, Voltage Regulators, Insulators, Capacitors, Shunt Reactor, Relays, Substation Structures, etc.)
- By Power Generation Source
- Thermal
- Nuclear
- Renewables
- By Voltage Class
- Up to 1 kV
- 1 to 36 kV
- Above 36 kV
- By Application
- Power Generation
- Transmission
- Distribution
- By End-User
- Residential
- Commercial
- Industrial
- Utility
- By Geography
- North America
- United States
- Canada
- Mexico
- Europe
- Germany
- France
- United Kingdom
- Italy
- NORDIC Countries
- Russia
- Rest of Europe
- Asia-Pacific
- China
- India
- Japan
- South Korea
- ASEAN Countries
- Australia and New Zealand
- Rest of Asia-Pacific
- South America
- Brazil
- Argentina
- Chile
- Rest of South America
- Middle East and Africa
- Saudi Arabia
- United Arab Emirates
- South Africa
- Egypt
- Rest of Middle East and Africa
- North America
Geography Analysis
Asia-Pacific held 50.4% of global revenue in 2025 and will sustain a 9.0% CAGR, propelled by China's +-800 kV corridors, India's renewables auctions, and ASEAN coal-to-gas conversions. State Grid invested USD 58 billion in 2024, emphasizing long-haul HVDC to coastal load centers. India auctioned 50 gigawatts of renewables in 2024, triggering USD 12 billion of evacuation contracts. Japan's 1.2 gigawatt Chiba offshore wind farm, awarded in 2025, requires floating substations and 66 kV cables. South Korea's Green New Deal budgets KRW 73.4 trillion through 2030 for digital substations. ASEAN nations secured USD 4.2 billion in ADB transmission funding in 2025.
North America and Europe prioritize grid resilience. The U.S. Inflation Reduction Act's tax credits catalyze projects like the 3 GW TransWest Express line. Germany approved EUR 24 billion of expansion in 2025, including SuedLink. The UK road-mapped 4,000 km of offshore circuits costing GBP 18 billion. Nordic states expand cross-border connectors such as the EUR 1.3 billion NordLink.
South America and the Middle East show rising opportunity. Brazil auctioned 15 GW of concessions in 2024, drawing Siemens Energy and WEG bids. Chile's Atacama solar corridor employs 500 kV lines commissioned in 2025. Saudi Arabia earmarked USD 7.5 billion in 2024 for renewable transmission under PIF. DEWA let a USD 1.8 billion 400 kV contract in 2025 for the MBR Solar Park integration. Off-grid African mini-grids financed by the World Bank round out demand diversity.
- General Electric
- Siemens AG
- Schneider Electric
- Mitsubishi Electric
- Eaton
- ABB
- Toshiba
- Honeywell
- Bharat Heavy Electricals
- Crompton Greaves
- Larsen & Toubro
- Fuji Electric
- Rockwell Automation
- Cummins
- Caterpillar
- Kohler
- Generac Holdings
- Hitachi Energy
- WEG SA
- Siemens Energy
Additional Benefits:
- The market estimate (ME) sheet in Excel format
- 3 months of analyst support
TABLE OF CONTENTS
1 Introduction
- 1.1 Study Assumptions & Market Definition
- 1.2 Scope of the Study
2 Research Methodology
3 Executive Summary
4 Market Landscape
- 4.1 Market Overview
- 4.2 Market Drivers
- 4.2.1 Rapid renewable-led grid modernization
- 4.2.2 Urbanization-fuelled infrastructure expansion in emerging economies
- 4.2.3 Hyperscale data-centre back-up power build-out
- 4.2.4 Rural electrification & mini-grids in Africa-Asia
- 4.2.5 Rise of peer-to-peer micro-grids needing bi-directional switchgear
- 4.2.6 "Equipment-as-a-Service" subscription models lowering capex
- 4.3 Market Restraints
- 4.3.1 High O&M cost of legacy fleets
- 4.3.2 Volatile copper & rare-earth supply chains
- 4.3.3 Cyber-security certification delays for smart switchgear
- 4.3.4 Inverter-based resources reducing transformer demand
- 4.4 Supply-Chain Analysis
- 4.5 Regulatory Landscape
- 4.6 Technological Outlook
- 4.7 Porter's Five Forces
- 4.7.1 Bargaining Power of Suppliers
- 4.7.2 Bargaining Power of Buyers
- 4.7.3 Threat of New Entrants
- 4.7.4 Threat of Substitutes
- 4.7.5 Competitive Rivalry
5 Market Size & Growth Forecasts
- 5.1 By Equipment Type
- 5.1.1 Turbines
- 5.1.2 Generators
- 5.1.3 Transformers
- 5.1.4 Switchgear
- 5.1.5 Circuit Breakers
- 5.1.6 Power Cables
- 5.1.7 Other Equipment (Transmission Towers, Voltage Regulators, Insulators, Capacitors, Shunt Reactor, Relays, Substation Structures, etc.)
- 5.2 By Power Generation Source
- 5.2.1 Thermal
- 5.2.2 Nuclear
- 5.2.3 Renewables
- 5.3 By Voltage Class
- 5.3.1 Up to 1 kV
- 5.3.2 1 to 36 kV
- 5.3.3 Above 36 kV
- 5.4 By Application
- 5.4.1 Power Generation
- 5.4.2 Transmission
- 5.4.3 Distribution
- 5.5 By End-User
- 5.5.1 Residential
- 5.5.2 Commercial
- 5.5.3 Industrial
- 5.5.4 Utility
- 5.6 By Geography
- 5.6.1 North America
- 5.6.1.1 United States
- 5.6.1.2 Canada
- 5.6.1.3 Mexico
- 5.6.2 Europe
- 5.6.2.1 Germany
- 5.6.2.2 France
- 5.6.2.3 United Kingdom
- 5.6.2.4 Italy
- 5.6.2.5 NORDIC Countries
- 5.6.2.6 Russia
- 5.6.2.7 Rest of Europe
- 5.6.3 Asia-Pacific
- 5.6.3.1 China
- 5.6.3.2 India
- 5.6.3.3 Japan
- 5.6.3.4 South Korea
- 5.6.3.5 ASEAN Countries
- 5.6.3.6 Australia and New Zealand
- 5.6.3.7 Rest of Asia-Pacific
- 5.6.4 South America
- 5.6.4.1 Brazil
- 5.6.4.2 Argentina
- 5.6.4.3 Chile
- 5.6.4.4 Rest of South America
- 5.6.5 Middle East and Africa
- 5.6.5.1 Saudi Arabia
- 5.6.5.2 United Arab Emirates
- 5.6.5.3 South Africa
- 5.6.5.4 Egypt
- 5.6.5.5 Rest of Middle East and Africa
- 5.6.1 North America
6 Competitive Landscape
- 6.1 Market Concentration
- 6.2 Strategic Moves (M&A, Partnerships, PPAs)
- 6.3 Market Share Analysis (Market Rank/Share for key companies)
- 6.4 Company Profiles (includes Global level Overview, Market level overview, Core Segments, Financials as available, Strategic Information, Products & Services, and Recent Developments)
- 6.4.1 General Electric
- 6.4.2 Siemens AG
- 6.4.3 Schneider Electric
- 6.4.4 Mitsubishi Electric
- 6.4.5 Eaton
- 6.4.6 ABB
- 6.4.7 Toshiba
- 6.4.8 Honeywell
- 6.4.9 Bharat Heavy Electricals
- 6.4.10 Crompton Greaves
- 6.4.11 Larsen & Toubro
- 6.4.12 Fuji Electric
- 6.4.13 Rockwell Automation
- 6.4.14 Cummins
- 6.4.15 Caterpillar
- 6.4.16 Kohler
- 6.4.17 Generac Holdings
- 6.4.18 Hitachi Energy
- 6.4.19 WEG SA
- 6.4.20 Siemens Energy
7 Market Opportunities & Future Outlook
- 7.1 White-space & Unmet-need Assessment

 無線工具市場:依工具類型、動力來源、銷售管道、最終用途及通路分類-2026-2032年全球市場預測
 電力設備市場分析及預測(至2035年):依類型、產品、服務、技術、組件、應用、最終用戶、功能、安裝類型及解決方案分類
 全球電氣裝置數位雙胞胎市場:預測(至2034年)-按孿生類型、組件、安裝類型、部署方法、技術、應用、最終用戶和地區進行分析
 全球動力設備電池市場:市場規模分析(按類型、應用和地區分類)及未來預測(2025-2035年)
 全球動力設備用電池市場
 電力設備的全球市場,市場規模和佔有率的分析 - 成長趨勢與預測(2025年~2033年)