


 |
市場調查報告書
商品編碼
2073626
印度電動巴士:市場佔有率分析、產業趨勢與統計及成長預測(2026-2031 年)India Electric Bus - Market Share Analysis, Industry Trends & Statistics, Growth Forecasts (2026 - 2031) |
||||||

※ 本網頁內容可能與最新版本有所差異。詳細情況請與我們聯繫。
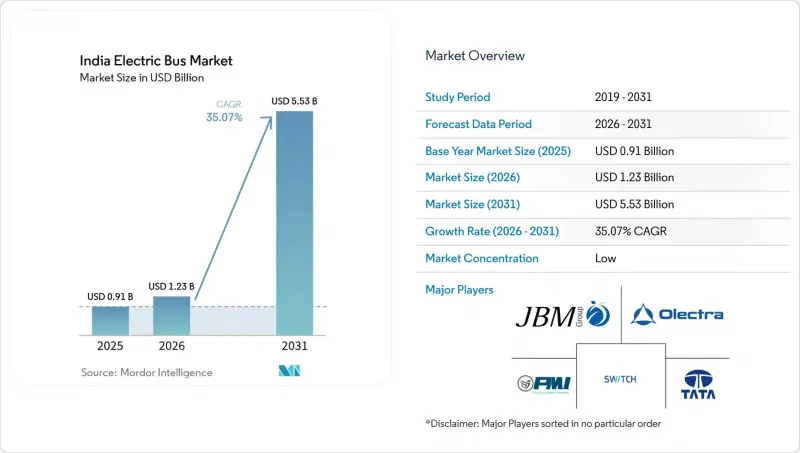
據 Mordor Intelligence 稱,2025 年印度電動巴士市場價值 9.1 億美元,預計將從 2026 年的 12.3 億美元成長到 2031 年的 55.3 億美元。
預測期(2026-2031 年)的複合年成長率預計為 4.17%。
本報告按推進系統(例如,電池驅動電動巴士)、應用領域(例如,城市和公共交通)、電池化學成分(例如,磷酸鐵鋰電池)、總長度(例如,小於9米)、電機架構(例如,永磁同步馬達)、電機輸出功率(例如,小於100千瓦、100-150千瓦)、分類航里程(例如,小於100公里)。市場預測以貨幣價值(美元)及銷售量(台)兩種單位呈現。
印度電動巴士市場趨勢與洞察
磷酸鐵鋰電池價格跌破 100 美元/千瓦時的閾值。
亞洲主要市場供應過剩和外匯的匯率共同推動了國內電池組價格的下降。這一趨勢正在縮小電動公車和柴油公車全生命週期成本之間的差距,尤其是在高利用率線上。隨著本地新增產能和政府獎勵政策的訂定,預計價格將進一步下降。這種轉變正在加速印度多個邦的車輛電氣化進程,進而促進印度電動公車市場的成長。先前為電動公車轉型設定成本基準的車輛管理委員會,正根據這些價格趨勢加快更新換代計畫。然而,近期原物料價格的波動凸顯了供應鏈中持續存在的風險,並強調了簽訂長期採購合約的必要性。
加快為FAME II和PM-eBus計劃提供資金
由於託管式支付擔保機制,製造商的信心正在恢復。該系統不僅保證及時付款,還能清除長期拖欠的款項,並有效重啟先前停滯的採購週期。諸如PM-eBus Sewa等國家級計畫已批准在多個城市進行大規模部署,但由於資金支付進度落後於最初的承諾,實施速度至關重要。獎勵機制旨在扶持中型公車車型,同時平衡補貼和成本。此外,該專案的延期也讓目的地設備製造商(OEM)對規劃週期有了更清晰的了解。然而,目前時間表之後缺乏明確的藍圖令人擔憂,這預示著未來訂單可能會下降。總之,持續不斷的補貼正在增強採購信心,並為印度快速成長的電動公車市場奠定堅實的基礎。
一線城市以外地區的鐵路車輛段電氣化改造工程延誤
在像拉爾科特這樣的城市以及類似的都市區,許多二級車輛停車點缺乏足夠的快速充電基礎設施,這阻礙了車輛的運轉率,尤其與大都會圈相比更是如此。在一些州,併網核准所需時間遠長於數位基礎設施較發達的地區,導致專案進度延誤,營運不確定性增加。每個充電樁的建造成本佔專案總預算的很大一部分,給小規模專案帶來財務壓力,並阻礙了分階段的擴展。另一方面,儘管國家能源服務署的「車輛停放點即服務」(DaaS)舉措正在取得進展,但由於複雜的收益分成談判,該計劃在城市層面的推廣應用受到阻礙,進展有限。
細分市場分析
到2025年,純電動公車將佔據印度電動公車市場89.87%的佔有率,這主要得益於大都會圈完善的充電站網路以及「FAME II」政策帶來的強勁經濟效益。同時,單次加氫續航里程達450公里的燃料電池電動公車,非常適合德里-昌迪加爾和孟買-普納等路線。隨著氫氣成本的下降,燃料電池電動公車的年複合成長率預計將達到36.58%。由於補貼不足,以及由此導致的公共機構(這些機構優先考慮零排放)對其品牌價值的下降,插電式混合動力汽車的市場佔有率仍將非常小。
高能量密度和快速加氫是燃料電池技術的主要優勢,但高昂的初始投資成本和有限的加氫網路阻礙了其廣泛應用。目前,在充電基礎設施完善的都市區,純電動公車佔據主導地位。然而,長途城際線路的續航里程限制為動力來源解決方案提供了發展機會。從長遠來看,兩種動力系統的驅動策略預計將會分化,純電動公車將更適用於都市區運營,而燃料電池汽車則更適用於長途旅行。這兩種技術都面臨著基礎設施的挑戰,這些挑戰將在未來幾年對印度電動公車市場的發展產生至關重要的影響。
預計到2025年,都市區和公共交通部門將佔據65.32%的主導佔有率。這反映出德里、班加羅爾和孟買迫切需要改善空氣質量,以及發展夜間充電基礎設施。目前規模較小的城際和區域服務預計將以每年37.31%的速度成長,這主要得益於營運商引入14-18米鉸接式公車並試行高階快線服務。機場巴士和校車雖然屬於小眾市場,但其固定的線路和較高的資產運轉率顯示其具有明顯的商業價值。
印度的電動巴士市場能夠滿足各種不同的營運需求。城市公車每天行駛180-220公里,返回車庫的路線固定;而城際公車的行駛里程為350-450公里,需要150-350千瓦的高速公路充電樁。儘管營運商對此表現出濃厚的興趣,但基礎設施短缺仍然是最大的障礙,尤其是在「黃金四邊形」沿線。在超快充電樁普及之前,車主可能必須加裝更大容量的電池組,或是推遲長途線路的電動化計畫。
2025年,磷酸鋰鐵電池(LFP)的市佔率維持在68.37%。這主要歸功於其防火安全性高、使用壽命長,以及在2025年初價格降至每度電100美元以下。隨著長途客車努力在不超重的情況下實現450公里的續航里程,NMC的複合年成長率達到了36.42%。
鈦酸鋰電池廣泛應用於機場擺渡車等高流量交通場景,而鈉離子電池作為一種經濟高效的城市公車解決方案,正日益受到關注,尤其是在國內生產線投入運作之後。電池化學成分的選擇也越來越注重最佳化,以適應特定的運行週期。磷酸鐵鋰電池(LFP)適用於都市區線路,鎳鈷錳酸鋰電池(NMC)適用於長途城際交通,鈉離子電池適用於寒冷氣候,而鈦酸鋰電池則適用於快速充電迴路。這種多樣化的選擇有助於應對原料價格的波動,並適應不斷變化的補貼政策,從而在印度電動公車市場中保持不同電池化學成分之間的動態競爭。
其他好處:
- Excel格式的市場預測(ME)表
- 3個月的分析師支持
目錄
第1章:引言
- 研究假設和市場定義
- 調查範圍
第2章:調查方法
第3章執行摘要
第4章 市場狀況
- 都市化、人口和公共交通需求
- 公共運輸使用率與交通方式轉變
- 柴油和電動/氫燃料之間的價格差異
- 車輛和基礎設施的資本支出/營運支出
- 資金籌措模式
- 公車規格和車輛標準
- 充電站及拓樸結構
- 公車氫氣加註站
- 補貼和獎勵的價值
- OEM產品陣容和車型管線
- 法律規範
- 車輛類型認證和安全性
- 採購和合約相關規定
- 財政與產業政策(獎勵、關稅、在地採購、生產者責任延伸制度)
- 市場促進因素
- 加速FAME II和PM-eBus計畫下的資金撥付。
- 州級總成本合約正在興起。
- 磷酸鐵鋰電池價格跌破每千瓦時 100 美元的門檻。
- 強制性要求:到 2027 年,城市公車中 25% 必須是零排放車輛。
- 長途航線綠色氫氣混合試點項目
- 印度製造的採用鈉離子電池的電池組將於 2026 年上市。
- 市場限制因素
- 州際通行費和稅收豁免方面的不平衡
- 一流城市以外地區的火車站電氣化改造工程延誤
- 高速公路缺少150-350千瓦的公共充電站。
- SiC逆變器本地二級供應商供應鏈短缺
- 價值供應鏈分析
- 波特五力模型
第5章 市場規模與成長預測
- 透過推進方法
- 電池驅動電動巴士(BEB)
- 插電式混合動力電動巴士(PHEB)
- 燃料電池電動巴士(FCEB)
- 透過使用
- 城市/公共交通
- 城際/區域內
- 長途巴士/旅遊巴士
- 校車
- 飛機場
- 其他
- 電池化學成分
- 磷酸鋰鐵(LFP)
- 鎳錳鈷合金(NMC)/鎳鈷鋁合金(NCA)
- 鈦酸鋰(LTO)
- 其他(鈉離子,新興/概念驗證)
- 按總長度
- 小於9米
- 9~14 m
- 14~18 m
- 18米或以上
- 依馬達架構
- 永磁同步馬達(PMSM)
- 感應電動機/異步交流電機
- 開關式磁阻電動機(SRM)
- 其他
- 馬達輸出
- 小於100千瓦
- 100~150 kW
- 151~200 kW
- 201~250 kW
- 251~320 kW
- 超過320千瓦
- 透過練習場
- 不到100公里
- 101~200 km
- 201~300 km
- 301~450 km
- 超過450公里
- 按最終用途
- 民眾
- 私人的
- 按地區/州
- 印度北部
- 新德里
- 北方邦
- 印度北部其他地區
- 西印度群島
- 馬哈拉斯特拉邦
- 古吉拉突邦
- 西印度群島其他地區
- 南印度
- 卡納塔克邦
- 泰米爾納德邦
- 特倫甘納邦
- 南印度其他地區
- 東部和東北部
- 西孟加拉邦
- 阿薩姆邦
- 東部和東北部的其他地區
- 印度北部
第6章 競爭情勢
- 市場集中度
- 策略趨勢
- 市佔率分析
- 公司簡介
- Tata Motors Limited
- Switch Mobility(Ashok Leyland Limited)
- Olectra Greentech Ltd.
- JBM Auto Limited
- PMI Electro Mobility
- Volvo AB
- Eicher Motors Limited
- BYD India Pvt. Ltd.
- EKA Mobility
- KPIT Technologies(e-Powertrain)
- Erisha Mobility
第7章 市場機會與未來展望
第8章:執行長應考慮的關鍵策略問題
According to Mordor Intelligence, the indian electric bus market size is valued at USD 0.91 billion in 2025 and estimated to grow from USD 1.23 billion in 2026 to reach USD 5.53 billion by 2031, at a CAGR of 4.17% during the forecast period (2026-2031).
This report is Segmented by Propulsion (Battery Electric Bus, and More), Application (City/Transit, and More), Battery Chemistry (LFP, and More), Length (Below 9 M, and More), Motor Architecture (PMSM, and More), Motor Power (Below 100kW, 100-150 KW, and More), Range (Below 100 Km, and More), End Use, and Region. The Market Forecasts are Provided in Terms of Value (USD) and Volume (Units).
India Electric Bus Market Trends and Insights
Falling LFP Battery Prices below USD 100/kWh Threshold
Oversupply in major Asian markets, coupled with favorable currency movements, has driven down domestic battery pack prices. This trend is closing the lifetime cost gap between electric and diesel vehicles, especially on high-utilization routes. With new local manufacturing capacities emerging and bolstered by government incentive programs, prices are poised to drop further. This shift is accelerating fleet conversion decisions across several Indian states, supporting India electric bus market growth. Internal fleet committees, which had previously established cost thresholds for transitioning to electric, are now responding to these price trends with quicker replacement timelines. Yet, the recent volatility in raw material prices highlights persistent supply-chain risks, emphasizing the need for long-term procurement agreements.
Faster FAME II and PM-eBus Scheme Disbursements
Manufacturers have regained confidence, thanks to an escrow-based payment security mechanism. This system not only ensures timely payments but also clears long-standing dues, effectively restarting previously stalled procurement cycles . While national programs, such as PM-eBus Sewa, have greenlit extensive deployments in various cities, the pace of execution is crucial, mainly as disbursal rates trail behind initial commitments . The incentive structures are designed to favor mid-sized bus models, striking a balance between subsidies and costs. Moreover, the program's extension offers Original Equipment Manufacturers (OEMs) a more apparent planning horizon. Yet, the lack of a definitive roadmap beyond the current timeline raises eyebrows, suggesting a possible decline in future orders. In summary, steady subsidy flows are bolstering procurement confidence, laying a solid foundation for the burgeoning electric bus market in India.
Slow Depot Electrification Outside Tier-1 Cities
In cities like Rajkot and other similar urban areas, fleet utilization is hampered by a lack of fast-charging infrastructure at many tier-2 depots, especially when compared to major metropolitan hubs. In several states, project timelines are delayed and operational uncertainty is heightened due to grid connection approvals taking significantly longer than in regions with more advanced digital infrastructure. Capital costs for each charger consume a substantial portion of typical project budgets, putting financial pressure on smaller projects and deterring them from making incremental expansions. On another front, while the national energy services agency's depot-as-a-service initiative is making progress, its city-level adoption is hindered by complex revenue-sharing negotiations, resulting in a limited rollout.
Other drivers and restraints analyzed in the detailed report include:
- State-level Gross-Cost Contracts Gaining Traction
- Green-Hydrogen Blending Pilots for Long-Haul Routes
- Inter-state Toll-/Tax-waiver Asymmetry
For complete list of drivers and restraints, kindly check the Table Of Contents.
Segment Analysis
Battery electric buses owned 89.87% of the Indian electric bus market in 2025 due to mature depot charging networks in metros and strong FAME II economics. Fuel cell electric buses, however, promise a single-tank range of 450 km, ideal for Delhi-Chandigarh or Mumbai-Pune services, and are forecast to register a 36.58% CAGR as hydrogen costs decline. Plug-in hybrids remain negligible, lacking subsidy support and carrying brand-equity penalties among zero-emission-focused public agencies.
Energy density and fast refueling are significant advantages of fuel-cell technology; however, high capital costs and a limited refueling network hinder its widespread adoption. Battery-electric buses currently dominate city fleets where charging infrastructure is well-developed. Nonetheless, range limitations on long intercity routes present an opportunity for hydrogen-based solutions. In the long term, propulsion strategies are expected to diverge, with battery-electric vehicles being preferred for urban operations and fuel cells for longer-distance travel. Both technologies face infrastructure-related challenges, which will play a critical role in shaping the evolution of the Indian electric bus market in the coming years.
City and transit uses dominated with a 65.32% share in 2025, reflecting the urgent air-quality goals and the availability of overnight-charging infrastructure in Delhi, Bangalore, and Mumbai. Intercity and regional services, although smaller today, are expected to grow at a 37.31% annual rate as operators pilot articulated buses measuring 14-18m, offering premium express amenities. Airport shuttles and school buses form niche segments that nonetheless demonstrate business-case clarity due to fixed routes and high asset utilization.
The Indian electric bus market responds to differing duty cycles: city buses run 180-220 km daily with predictable depot returns, while intercity coaches cover ranges of 350-450 km and require 150-350 kW highway chargers. Operator interest is high, yet infrastructure scarcity remains the gating element, particularly along the Golden Quadrilateral. Until ultra-fast chargers proliferate, fleet owners will either add larger battery packs or defer electrification of long-haul routes.
LFP maintained a 68.37% share in 2025, primarily due to its fire safety, long cycle life, and the achievement of a sub-USD 100 per kWh milestone in early 2025. NMC underpins 36.42% CAGR as intercity coaches chase 450 km ranges without overshooting weight ratings.
Lithium titanate is being utilized in high-throughput applications such as airport shuttles, while sodium-ion batteries are gaining traction as a cost-effective solution for city networks, particularly as domestic production lines become operational. Battery chemistry selection is increasingly tailored to specific duty cycles: LFP is preferred for urban routes, NMC for longer intercity travel, sodium-ion for colder climates, and lithium titanate for rapid-charge loops. This diversified approach helps address raw material volatility and adapts to changing subsidy structures, maintaining dynamic competition among battery chemistries in the Indian electric bus market.
Complete Report Scope:
- By Propulsion
- Battery Electric Bus (BEB)
- Plug-in Hybrid Electric Bus (PHEB)
- Fuel Cell Electric Bus (FCEB)
- By Application
- City / Transit
- Intercity / Regional
- Coach / Tourist
- School Bus
- Airport
- Others
- By Battery Chemistry
- Lithium Iron Phosphate (LFP)
- Nickel Manganese Cobalt (NMC) / Nickel Cobalt Aluminum (NCA)
- Lithium Titanate (LTO)
- Others (Sodium-ion, emerging/pilots)
- By Length
- Below 9 m
- 9-14 m
- 14-18 m
- Above 18 m
- By Motor Architecture
- Permanent Magnet Synchronous Motor (PMSM)
- Induction Motor / Asynchronous AC
- Switched Reluctance Motor (SRM)
- Others
- By Motor Power
- Below 100 kW
- 100-150 kW
- 151-200 kW
- 201-250 kW
- 251-320 kW
- Above 320 kW
- By Range
- Below 100 km
- 101-200 km
- 201-300 km
- 301-450 km
- Above 450 km
- By End Use
- Public
- Private
- By Region / State
- North India
- New Delhi
- Uttar Pradesh
- Rest of North India
- West India
- Maharashtra
- Gujarat
- Rest of West India
- South India
- Karnataka
- Tamil Nadu
- Telangana
- Rest of South India
- East and North-East
- West Bengal
- Assam
- Rest of East and North-East
- North India
List of Companies Covered in this Report:
- Tata Motors Limited
- Switch Mobility (Ashok Leyland Limited)
- Olectra Greentech Ltd.
- JBM Auto Limited
- PMI Electro Mobility
- Volvo AB
- Eicher Motors Limited
- BYD India Pvt. Ltd.
- EKA Mobility
- KPIT Technologies (e-Powertrain)
- Erisha Mobility
Additional Benefits:
- The market estimate (ME) sheet in Excel format
- 3 months of analyst support
TABLE OF CONTENTS
1 Introduction
- 1.1 Study Assumptions and Market Definition
- 1.2 Scope of the Study
2 Research Methodology
3 Executive Summary
4 Market Landscape
- 4.1 Urbanization, Population and Transit Demand
- 4.2 Public-Transport Share and Mode Shift
- 4.3 Diesel-vs-Electricity/H2 Price Spread
- 4.4 Vehicle and Infrastructure CAPEX / OPEX
- 4.5 Financing Models
- 4.6 Bus Specifications and Vehicle Standards
- 4.7 Charging Stations and Topology
- 4.8 Hydrogen Stations Serving Buses
- 4.9 Subsidy / Incentive Value
- 4.10 OEM Line-up and Model Pipeline
- 4.11 Regulatory Framework
- 4.12 Vehicle Homologation and Safety
- 4.13 Procurement and Contracting Rules
- 4.14 Fiscal and Industrial Policy (Incentives, Duties, Localisation, EPR)
- 4.15 Market Drivers
- 4.15.1 Faster FAME II and PM-eBus Scheme Disbursements
- 4.15.2 State-level Gross-Cost Contracts Gaining Traction
- 4.15.3 Falling LFP Battery Prices below USD 100 /kWh Threshold
- 4.15.4 Mandates for 25 % Zero-Emission City Bus Fleets by 2027
- 4.15.5 Green-Hydrogen Blending Pilots for Long-Haul Routes
- 4.15.6 Make-in-India Packs with Sodium-ion Cells from 2026
- 4.16 Market Restraints
- 4.16.1 Inter-state Toll-/Tax-waiver Asymmetry
- 4.16.2 Slow Depot Electrification outside Tier-1 Cities
- 4.16.3 Scarcity of 150-350 kW Public Chargers on Highways
- 4.16.4 Limited Local Tier-2 Supply-Chain for SiC Inverters
- 4.17 Value / Supply-Chain Analysis
- 4.18 Porter's Five Forces
- 4.18.1 Threat of New Entrants
- 4.18.2 Bargaining Power of Suppliers
- 4.18.3 Bargaining Power of Buyers
- 4.18.4 Threat of Substitutes
- 4.18.5 Competitive Rivalry
5 Market Size and Growth Forecasts (Value (USD), Volume (Units))
- 5.1 By Propulsion
- 5.1.1 Battery Electric Bus (BEB)
- 5.1.2 Plug-in Hybrid Electric Bus (PHEB)
- 5.1.3 Fuel Cell Electric Bus (FCEB)
- 5.2 By Application
- 5.2.1 City / Transit
- 5.2.2 Intercity / Regional
- 5.2.3 Coach / Tourist
- 5.2.4 School Bus
- 5.2.5 Airport
- 5.2.6 Others
- 5.3 By Battery Chemistry
- 5.3.1 Lithium Iron Phosphate (LFP)
- 5.3.2 Nickel Manganese Cobalt (NMC) / Nickel Cobalt Aluminum (NCA)
- 5.3.3 Lithium Titanate (LTO)
- 5.3.4 Others (Sodium-ion, emerging/pilots)
- 5.4 By Length
- 5.4.1 Below 9 m
- 5.4.2 9-14 m
- 5.4.3 14-18 m
- 5.4.4 Above 18 m
- 5.5 By Motor Architecture
- 5.5.1 Permanent Magnet Synchronous Motor (PMSM)
- 5.5.2 Induction Motor / Asynchronous AC
- 5.5.3 Switched Reluctance Motor (SRM)
- 5.5.4 Others
- 5.6 By Motor Power
- 5.6.1 Below 100 kW
- 5.6.2 100-150 kW
- 5.6.3 151-200 kW
- 5.6.4 201-250 kW
- 5.6.5 251-320 kW
- 5.6.6 Above 320 kW
- 5.7 By Range
- 5.7.1 Below 100 km
- 5.7.2 101-200 km
- 5.7.3 201-300 km
- 5.7.4 301-450 km
- 5.7.5 Above 450 km
- 5.8 By End Use
- 5.8.1 Public
- 5.8.2 Private
- 5.9 By Region / State
- 5.9.1 North India
- 5.9.1.1 New Delhi
- 5.9.1.2 Uttar Pradesh
- 5.9.1.3 Rest of North India
- 5.9.2 West India
- 5.9.2.1 Maharashtra
- 5.9.2.2 Gujarat
- 5.9.2.3 Rest of West India
- 5.9.3 South India
- 5.9.3.1 Karnataka
- 5.9.3.2 Tamil Nadu
- 5.9.3.3 Telangana
- 5.9.3.4 Rest of South India
- 5.9.4 East and North-East
- 5.9.4.1 West Bengal
- 5.9.4.2 Assam
- 5.9.4.3 Rest of East and North-East
- 5.9.1 North India
6 Competitive Landscape
- 6.1 Market Concentration
- 6.2 Strategic Moves
- 6.3 Market Share Analysis
- 6.4 Company Profiles (Includes Global level Overview, Market level overview, Core Segments, Financials as available, Strategic Information, Market Rank/Share, Products and Services, Recent Developments)
- 6.4.1 Tata Motors Limited
- 6.4.2 Switch Mobility (Ashok Leyland Limited)
- 6.4.3 Olectra Greentech Ltd.
- 6.4.4 JBM Auto Limited
- 6.4.5 PMI Electro Mobility
- 6.4.6 Volvo AB
- 6.4.7 Eicher Motors Limited
- 6.4.8 BYD India Pvt. Ltd.
- 6.4.9 EKA Mobility
- 6.4.10 KPIT Technologies (e-Powertrain)
- 6.4.11 Erisha Mobility
7 Market Opportunities and Future Outlook
- 7.1 White-space and Unmet-need Assessment
8 Key Strategic Questions for CEOs

 燃料電池電動巴士全球市場規模、佔有率、趨勢和成長分析報告(2026-2034)
 公共運輸電氣化市場:按組件、應用、電池類型、全球價值鏈 (GVC)、推進系統、國家和地區分類-全球產業分析、市場規模、市場佔有率及2026年至2033年預測
 電動微型巴士市場:2026-2032年全球市場預測(按驅動系統、座位數、續航里程、電池容量、應用和最終用戶分類)電動校車市場:按驅動系統、車身長度、電池容量、校車類型、充電方式和最終用戶分類-2026-2032年全球市場預測電動巴士市場:2026-2032年全球市場預測(按推進系統、電池類型、底盤類型、座位數、續航里程、應用和最終用戶分類)
 電動巴士市場分析及預測(至2035年):類型、產品、技術、組件、應用、部署模式、最終用戶、功能、安裝模式
 電動巴士:市場佔有率分析、行業趨勢和統計數據、成長預測(2026-2031 年)
 2034年電動巴士市場預測:全球動力類型、電池類型、巴士長度、充電方式、座位數、電池容量、組件、應用、最終用戶和地區分析美國電動巴士:市場佔有率分析、行業趨勢和統計數據以及成長預測(2026-2031 年)
 全球電動巴士市場:機會與策略展望(至2035年)