


 |
市場調查報告書
商品編碼
2073624
美國電動巴士:市場佔有率分析、行業趨勢和統計數據以及成長預測(2026-2031 年)United States Electric Bus - Market Share Analysis, Industry Trends & Statistics, Growth Forecasts (2026 - 2031) |
||||||

※ 本網頁內容可能與最新版本有所差異。詳細情況請與我們聯繫。
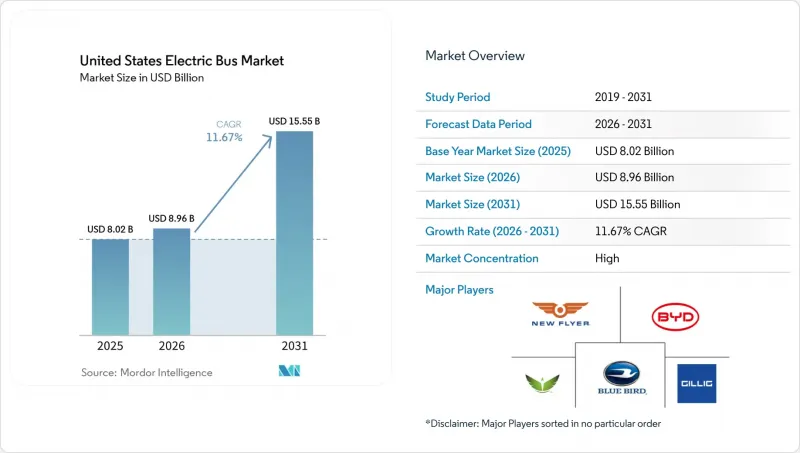
據 Mordor Intelligence 稱,2025 年美國電動巴士市場價值 80.2 億美元,預計到 2026 年將從 89.6 億美元成長到 2031 年的 155.5 億美元,同期複合年成長率為 11.67%。
本報告按推進系統(例如,電池驅動電動巴士)、應用領域(例如,城市/公共交通)、電池化學成分(例如,磷酸鐵鋰電池)、總長度(例如,小於9米)、電機結構(例如,永磁同步馬達)、電機輸出功率(例如,小於100千瓦)、續航里程(例如,小於100公里)、最終用途(/私人分類/私人分類)。市場預測以價值(單位)和數量(單位)為單位呈現。
美國電動巴士市場趨勢與洞察
聯邦和州政府的零排放強制性規定
加州的「創新清潔交通」法規要求大規模機構從2029年初開始必須採購零排放公車,這將縮短傳統的車輛更換週期,並為供應商提供更清晰的需求預測。為此,車隊管理人員正在加快基礎設施建設,確保電力設備升級、充電器選用和員工培訓與車輛競標同步進行。紐約州、華盛頓州和馬薩諸塞州也採用了類似的監管模式,這讓製造商更有信心規劃多年生產計畫,而不是一次性大量生產。由於大多數法規優先考慮使用國產零件,因此在本地生產電池組、馬達和線束的製造商更容易獲得「購買美國貨」認證。這些法規共同推動了全國的採購熱潮,鞏固了美國電動公車市場的成長動能。
聯邦公共交通電氣化基金
美國環保署的「清潔校車」補貼和聯邦交通管理局的「低零排放」津貼正在將政策意圖轉化為正式訂單,尤其對擔保能力有限的機構而言更是如此。津貼審核往往傾向於能夠立即投入使用的基礎設施,因此競標通常會將校車交付與充電樁運作同步進行,以避免資產閒置。供應商擴大將車輛、車庫設計和長期維護整合到單一合約中,這既簡化了機構的監管,也確保了零件的穩定供應。聯邦預算持續撥款的前景也讓貸款方感到安心,從而使剩餘資本支出能夠獲得具有競爭力的利率。這些金融工具共同降低了曾經阻礙早期採用的風險溢價。
倉庫電網連線延遲
都市區電力公司並網等待時間往往超過公車車庫本身的建設工期,迫使政府部門分階段交付公車或租賃臨時充電設施。專案經理必須精準地調整市政授權、電力公司設計方案和承包商進度安排,以防止設備閒置。公共工程部門人員短缺加劇了不不確定性,尤其是在同一區域多個公車車庫同時升級改造的情況下。一些市政當局透過安裝現場儲能電池來緩解高峰用電需求,從而降低延誤風險,但這會增加資本投入。在電力公司加快核准流程之前,併網仍然是許多部署計畫的瓶頸。
細分市場分析
預計到2025年,純電動公車將佔據美國市場72.16%的佔有率,但隨著加氫站向加州以外地區擴展,燃料電池公車的年複合成長率預計將達到24.24%。在南海岸空氣盆地地區的初步部署表明,燃料電池公車無需長時間充電即可完成300英里的運行週期,使其適用於山區和寒冷氣候。儘管各機構都承認純電動車輛能夠滿足大多數都市區需求,但燃料電池車輛的續航里程和10分鐘的加氫時間更接近柴油車輛的運行模式,使駕駛人更容易安排行程。製造商正在推進燃料電池堆的本地化組裝,以滿足「購買美國貨」的法規要求,但要實現綠色氫氣供應成本的進一步降低,仍需進一步降低成本,才能實現燃料電池公車的廣泛應用。
參與混合動力汽車試點計畫的交通管理部門發現,將純電池公車分配到可預測的城市線路,將燃料電池公車分配到快速線路和地形複雜的線路,可以提高營運效率。隨著全國氫能中心計畫投資80億美元用於生產和物流,氫能技術有望在競爭力上與柴油車匹敵,但基礎建設進度預計將需求成長推遲到預測期後期。通用儲能和安全標準的整合正在減少授權的阻力,使氫能成為拓展美國電動公車市場佔有率的可行選擇。
到2025年,城市和公共交通車輛將貢獻62.75%的收入,這得益於持續的津貼流入和明確的立法目標。另一方面,城際和區域線路的複合年成長率預計將達到16.02%,這主要歸功於電池能量密度的提升,目前單次營運里程可達300至450公里,以及電力公司共同出資建設路邊兆瓦級充電基礎設施。沙加緬度至裡諾以及達拉斯至休斯頓之間的早期走廊開發項目展現了運營時間的柔軟性,30分鐘的充電時間與駕駛人的休息時間完美契合。學區正在迅速利用美國環保署(EPA)的補貼,但所有權的分散化正在減緩全國範圍內的推廣速度,儘管其具有強大的公共衛生意義。
在機場和企業園區,零排放穿梭巴士正被投入使用,以履行範圍 1 的排放承諾,並成為支持市政政策目標的醒目示範。長途巴士業者在冬季續航里程和轉售價值穩定之前,仍保持謹慎態度,但使用高容量電池巴士的試驗計畫表明,在高階旅遊線路上實現經濟可行性是可行的。這種多樣化的應用場景訂單訂單積壓,並幫助原始設備製造商 (OEM) 在美國電動巴士市場各個規模範圍內攤銷其平台投資。
由於磷酸鋰鐵鋰電池將在美國電動巴士市場維持59.21%的佔有率。鈦酸鋰電池18.78%的複合年成長率主要得益於明尼蘇達州、伊利諾伊州和紐約州北部地區的交通機構的需求,這些機構優先考慮10分鐘快速充電功能以及即使在零下低溫環境下(例如夜間戶外停放)也能保持穩定性能。鎳錳鈷電池目前仍主要應用於長途客車,因為在這些車型中,能量密度比成本更為重要。
鈉離子電池和固態固態電池的試點計畫正在美國能源局(DOE) 的津貼下繼續進行,但預計要到 2028 年才能實現大規模生產。為實現價值鏈本地化,位於中西部地區的新型磷酸鋰鐵(LFP) 電池工廠已開始運作,這將降低關稅風險並增強獲得津貼的資格。同時,美國環保署 (EPA) 關於廢舊電池處理的政策正在推動將其用於固定式儲能系統,以實現電池的二次利用,從而降低先前阻礙預算敏感型市政當局採購的殘值風險。
其他好處:
- Excel格式的市場預測(ME)表
- 3個月的分析師支持
目錄
第1章:引言
- 研究假設和市場定義
- 調查範圍
- 關鍵術語表
第2章:調查方法
第3章執行摘要
第4章 市場背景與結構性因素
- 都市化、人口和公共交通需求
- 大眾運輸共享與交通方式轉型
- 柴油和電動/氫燃料之間的價格差異
- 車輛和基礎設施的資本支出/營運支出
- 資金籌措模式
- 公車規格和車輛標準
- 充電站和充電拓撲結構
- 公車氫氣加註站
- 補貼和獎勵的價值
- OEM產品陣容和車型管線
- 法律規範
- 車輛類型認證和安全性
- 採購和合約相關規定
- 財政與產業政策(獎勵、關稅、在地採購、生產者責任延伸制度)
第5章 市場狀況
- 市場概覽
- 市場促進因素
- 聯邦和州政府的零排放強制性規定
- 聯邦公共交通電氣化資金
- 電池組價格下降
- 到2026年,城市路線的總擁有成本(TCO)將保持持平
- 注重健康的校車引入
- 碳權額的收入來源
- 市場限制因素
- 倉庫電網連線延遲
- 稀疏的高功率充電網路
- FCEB的初始成本較高
- 有限的氫氣運輸路線
- 價值/供應鏈分析
- 技術展望
- 波特五力模型
第6章 市場規模與成長預測
- 透過推進力
- 電池驅動電動巴士(BEB)
- 插電式混合動力電動巴士(PHEB)
- 燃料電池電動巴士(FCEB)
- 透過使用
- 城市/公共交通
- 城市/地區之間
- 長途巴士/旅遊巴士
- 校車
- 飛機場
- 其他
- 電池化學成分
- 磷酸鋰鐵(LFP)
- NMC/NCA
- 鈦酸鋰(LTO)
- 其他(鈉離子,試點計畫)
- 按長度
- 小於9米
- 9~14 m
- 14~18 m
- 18米或以上
- 依馬達架構
- 永磁同步馬達(PMSM)
- 感性/異步交流
- 開關式磁阻電動機(SRM)
- 其他
- 馬達輸出
- 小於100千瓦
- 100~150 kW
- 151~200 kW
- 201~250 kW
- 251~320 kW
- 超過320千瓦
- 按範圍
- 不到100公里
- 100~200 km
- 201~300 km
- 300~450 km
- 超過450公里
- 按最終用途
- 民眾
- 私人的
- 按州
- 阿拉巴馬州
- 阿拉斯加州
- 亞利桑那
- 阿肯色州
- 加州
- 科羅拉多
- 康乃狄克州
- 德拉瓦
- 佛羅裡達
- 喬治亞
- 夏威夷
- 愛達荷州
- 伊利諾州
- 印第安納州
- 愛荷華州
- 堪薩斯州
- 肯塔基州
- 路易斯安那州
- 緬因州
- 馬裡蘭州
- 麻薩諸塞州
- 密西根州
- 明尼蘇達州
- 密西西比州
- 密蘇裡州
- 蒙大拿
- 內布拉斯加州
- 內華達州
- 新罕布夏州
- 紐澤西州
- 新墨西哥州
- 紐約
- 北卡羅來納州
- 北達科他州
- 俄亥俄州
- 奧克拉荷馬州
- 奧勒岡州
- 賓州
- 羅德島
- 南卡羅來納州
- 南達科他州
- 田納西州
- 德克薩斯州
- 猶他州
- 佛蒙特
- 維吉尼亞
- 華盛頓州
- 西維吉尼亞
- 威斯康辛州
- 懷俄明州
第7章 競爭情勢
- 市場集中度
- 策略趨勢
- 市佔率分析
- 公司簡介
- New Flyer of America
- BYD Auto Co. Ltd.
- GILLIG LLC
- Blue Bird Corporation
- Lion Electric Co.
- Daimler Truck Holding AG(Thomas Built)
- REV Group Inc.(ENC)
- Volvo Group(Nova Bus)
- GreenPower Motor Co. Inc.
- Phoenix Motorcars
- Vicinity Motor Corp.
- Cummins Inc.(Battery & Fuel-Cell)
- Van Hool NV
- TEMSA Skoda USA
- Alexander Dennis Ltd.
- Complete Coach Works(CCW)
第8章 市場機會與未來展望
- 評估閒置頻段和未滿足的需求
第9章:執行長面臨的關鍵策略挑戰
According to Mordor Intelligence, the united states electric bus market size was valued at USD 8.02 billion in 2025 and is projected to grow from USD 8.96 billion in 2026 to USD 15.55 billion by 2031, registering a CAGR of 11.67% over the same period.
This report is Segmented by Propulsion (Battery Electric and More), Application (City / Transit and More), Battery Chemistry (LFP and More), Length (Below 9 M and More), Motor Architecture (PMSM and More), Motor Power (Below 100 KW and More), Range (Below 100 Km and More), End Use (Public and Private), and State. The Market Forecasts are Provided in Terms of Value (Units) and Volume (Units).
United States Electric Bus Market Trends and Insights
Federal and State Zero-Emission Mandates
California's Innovative Clean Transit rule obliges large agencies to procure only zero-emission buses from the beginning of 2029, compressing traditional replacement cycles and raising demand visibility for suppliers. Fleet managers respond by accelerating infrastructure design so that utility upgrades, charger selection, and workforce training all proceed in parallel with vehicle tenders. New York, Washington, and Massachusetts mirror the regulatory template, giving manufacturers confidence to plan multiyear production slots instead of one-off batches. Because most rules favor domestic content, builders who localize battery packs, motors, and wiring harnesses enjoy clearer paths through Buy America certification. The cumulative effect of those mandates is a nationwide procurement wave that locks in the United States electric bus market's growth trajectory.
Federal Transit Electrification Funding
EPA Clean School Bus rebates and FTA Low-No grants convert policy intent into signed purchase orders, particularly for agencies that lack bonding capacity. Grant scoring tends to reward shovel-ready infrastructure, so bidders often align bus deliveries with charger commissioning to avoid stranded assets. Suppliers increasingly bundle vehicles, depot design, and long-term maintenance in a single contract, simplifying agency oversight while guaranteeing parts availability. The promise of continued federal appropriations also reassures lenders, enabling competitive interest rates on any remaining capital outlay. Together, those financial levers reduce the risk premium that once discouraged early movers.
Depot Grid-Connection Delays
Interconnection queues at urban utilities often exceed the construction timeline for the depot itself, forcing agencies to stage bus deliveries or lease temporary charging assets. Project managers must coordinate city permitting, utility engineering, and contractor schedules with near-surgical precision to avoid idle equipment. Staffing constraints at public-works departments add further uncertainty, especially when multiple depots in the same region pursue upgrades simultaneously. Some agencies mitigate delay risk by installing on-site battery storage that buffers peak demand, yet doing so raises capital intensity. Until utility processes speed up, grid access remains a gating item for many rollouts.
Other drivers and restraints analyzed in the detailed report include:
- Declining Battery-Pack Prices
- TCO Parity for City Routes by 2026
- Sparse High-Power Charging Network
For complete list of drivers and restraints, kindly check the Table Of Contents.
Segment Analysis
Battery-electric buses retained a 72.16% United States electric bus market share in 2025, yet fuel-cell variants are forecast to grow at a 24.24% CAGR as hydrogen stations extend beyond California. Early deployments in the South Coast Air Basin validate 300-mile duty cycles without lengthy charge dwell, appealing to mountainous or cold-weather operations. Agencies recognize that battery units cover most urban needs, but fuel-cell range and 10-minute refueling closely replicate diesel patterns, easing driver scheduling. Manufacturers localize stack assembly to meet Buy America rules, although green-hydrogen supply costs must still fall to unlock broad adoption.
Transit authorities experimenting with blended fleets see operational value in assigning battery buses to predictable urban loops and reserving fuel-cell units for express or terrain-intensive routes. As the national hydrogen-hub program channels USD 8 billion into production and logistics, the technology's path to parity improves, but infrastructure timelines push material volume to the latter half of the forecast period. Integration of common storage and safety codes reduces permitting friction, making hydrogen a realistic lever for segment expansion in the United States electric bus market.
City and transit fleets accounted for 62.75% of 2025 revenue, benefiting from continuous grant flows and clear legislative targets. Yet intercity and regional routes post a 16.02% CAGR because battery densities now support 300-450 km operations, and utilities co-fund roadside megawatt charging. Initial corridor build-outs between Sacramento-Reno and Dallas-Houston demonstrate timetable resilience when 30-minute top-ups align with driver breaks. School districts rapidly absorb EPA rebates, but fragmented ownership slows national scaling despite strong public health narratives.
Airports and corporate campuses deploy zero-emission shuttles to meet Scope 1 reduction pledges, serving as visible showcases that reinforce municipal policy ambitions. Coach operators remain cautious until winter-range performance and resale values stabilize, yet pilot programs with extended-pack buses suggest achievable economics on premium tourist routes. The diverse use-case mosaic sustains order backlogs, helping OEMs amortize platform investments across the United States electric bus market size spectrum.
Lithium-iron-phosphate batteries maintained a 59.21% United States electric bus market share in 2025, owing to thermal stability and cost advantages over nickel chemistries. Lithium-titanate's 18.78% CAGR comes from agencies in Minnesota, Illinois, and upstate New York that prize 10-minute charge capability and robust sub-zero performance for overnight outdoor parking. Nickel-manganese-cobalt remains constrained to long-range coaches where energy density outweighs cost.
Sodium-ion and solid-state pilots continue under DOE grants, but will not affect volume before 2028. Supply-chain localization efforts bring new LFP cell plants online in the Midwest, mitigating tariff exposure and strengthening grant eligibility. Meanwhile, battery-end-of-life policies under development by the EPA encourage second-life stationary storage, lowering residual-value risk that once stymied procurements in budget-sensitive municipalities.
Complete Report Scope:
- By Propulsion
- Battery Electric Bus (BEB)
- Plug-in Hybrid Electric Bus (PHEB)
- Fuel Cell Electric Bus (FCEB)
- By Application
- City/Transit
- Intercity/Regional
- Coach/Tourist
- School Bus
- Airport
- Others
- By Battery Chemistry
- Lithium Iron Phosphate (LFP)
- NMC/NCA
- Lithium Titanate (LTO)
- Others (Sodium-ion, pilots)
- By Length
- Below 9 m
- 9 to 14 m
- 14 to 18 m
- Above 18 m
- By Motor Architecture
- Permanent Magnet Synchronous Motor (PMSM)
- Induction/Asynchronous AC
- Switched Reluctance Motor (SRM)
- Others
- By Motor Power
- Below 100 kW
- 100 to 150 kW
- 151 to 200 kW
- 201 to 250 kW
- 251 to 320 kW
- Above 320 kW
- By Range
- Below 100 km
- 100 to 200 km
- 201 to 300 km
- 300 to 450 km
- Above 450 km
- By End Use
- Public
- Private
- By State
- Alabama
- Alaska
- Arizona
- Arkansas
- California
- Colorado
- Connecticut
- Delaware
- Florida
- Georgia
- Hawaii
- Idaho
- Illinois
- Indiana
- Iowa
- Kansas
- Kentucky
- Louisiana
- Maine
- Maryland
- Massachusetts
- Michigan
- Minnesota
- Mississippi
- Missouri
- Montana
- Nebraska
- Nevada
- New Hampshire
- New Jersey
- New Mexico
- New York
- North Carolina
- North Dakota
- Ohio
- Oklahoma
- Oregon
- Pennsylvania
- Rhode Island
- South Carolina
- South Dakota
- Tennessee
- Texas
- Utah
- Vermont
- Virginia
- Washington
- West Virginia
- Wisconsin
- Wyoming
List of Companies Covered in this Report:
- New Flyer of America
- BYD Auto Co. Ltd.
- GILLIG LLC
- Blue Bird Corporation
- Lion Electric Co.
- Daimler Truck Holding AG (Thomas Built)
- REV Group Inc. (ENC)
- Volvo Group (Nova Bus)
- GreenPower Motor Co. Inc.
- Phoenix Motorcars
- Vicinity Motor Corp.
- Cummins Inc. (Battery & Fuel-Cell)
- Van Hool NV
- TEMSA Skoda USA
- Alexander Dennis Ltd.
- Complete Coach Works (CCW)
Additional Benefits:
- The market estimate (ME) sheet in Excel format
- 3 months of analyst support
TABLE OF CONTENTS
1 Introduction
- 1.1 Study Assumptions and Market Definition
- 1.2 Scope of the Study
- 1.3 Glossary of Key Terms
2 Research Methodology
3 Executive Summary
4 Market Context and Structural Factors
- 4.1 Urbanization, Population and Transit Demand
- 4.2 Public Transport Share and Mode Shift
- 4.3 Diesel vs Electricity/Hydrogen Price Spread
- 4.4 Vehicle and Infrastructure CAPEX / OPEX
- 4.5 Financing Models
- 4.6 Bus Specs and Vehicle Standards
- 4.7 Charging Stations and Charging Topology
- 4.8 Hydrogen Stations Serving Buses
- 4.9 Subsidy/Incentive Value
- 4.10 OEM Line-up and Model Pipeline
- 4.11 Regulatory Framework
- 4.12 Vehicle Homologation and Safety
- 4.13 Procurement and Contracting Rules
- 4.14 Fiscal and Industrial Policy (Incentives, Duties, Localization, EPR)
5 Market Landscape
- 5.1 Market Overview
- 5.2 Market Drivers
- 5.2.1 Federal and State Zero-Emission Mandates
- 5.2.2 Federal Transit Electrification Funding
- 5.2.3 Declining Battery-Pack Prices
- 5.2.4 TCO Parity for City Routes by 2026
- 5.2.5 School-Fleet Health-Driven Adoption
- 5.2.6 Carbon-Credit Revenue Streams
- 5.3 Market Restraints
- 5.3.1 Depot Grid-Connection Delays
- 5.3.2 Sparse High-Power Charging Network
- 5.3.3 High Upfront FCEB Cost
- 5.3.4 Limited Hydrogen Corridors
- 5.4 Value/Supply-Chain Analysis
- 5.5 Technological Outlook
- 5.6 Porter's Five Forces
- 5.6.1 Threat of New Entrants
- 5.6.2 Bargaining Power of Suppliers
- 5.6.3 Bargaining Power of Buyers
- 5.6.4 Threat of Substitutes
- 5.6.5 Competitive Rivalry
6 Market Size and Growth Forecasts (Value (USD) and Volume (Units))
- 6.1 By Propulsion
- 6.1.1 Battery Electric Bus (BEB)
- 6.1.2 Plug-in Hybrid Electric Bus (PHEB)
- 6.1.3 Fuel Cell Electric Bus (FCEB)
- 6.2 By Application
- 6.2.1 City/Transit
- 6.2.2 Intercity/Regional
- 6.2.3 Coach/Tourist
- 6.2.4 School Bus
- 6.2.5 Airport
- 6.2.6 Others
- 6.3 By Battery Chemistry
- 6.3.1 Lithium Iron Phosphate (LFP)
- 6.3.2 NMC/NCA
- 6.3.3 Lithium Titanate (LTO)
- 6.3.4 Others (Sodium-ion, pilots)
- 6.4 By Length
- 6.4.1 Below 9 m
- 6.4.2 9 to 14 m
- 6.4.3 14 to 18 m
- 6.4.4 Above 18 m
- 6.5 By Motor Architecture
- 6.5.1 Permanent Magnet Synchronous Motor (PMSM)
- 6.5.2 Induction/Asynchronous AC
- 6.5.3 Switched Reluctance Motor (SRM)
- 6.5.4 Others
- 6.6 By Motor Power
- 6.6.1 Below 100 kW
- 6.6.2 100 to 150 kW
- 6.6.3 151 to 200 kW
- 6.6.4 201 to 250 kW
- 6.6.5 251 to 320 kW
- 6.6.6 Above 320 kW
- 6.7 By Range
- 6.7.1 Below 100 km
- 6.7.2 100 to 200 km
- 6.7.3 201 to 300 km
- 6.7.4 300 to 450 km
- 6.7.5 Above 450 km
- 6.8 By End Use
- 6.8.1 Public
- 6.8.2 Private
- 6.9 By State
- 6.9.1 Alabama
- 6.9.2 Alaska
- 6.9.3 Arizona
- 6.9.4 Arkansas
- 6.9.5 California
- 6.9.6 Colorado
- 6.9.7 Connecticut
- 6.9.8 Delaware
- 6.9.9 Florida
- 6.9.10 Georgia
- 6.9.11 Hawaii
- 6.9.12 Idaho
- 6.9.13 Illinois
- 6.9.14 Indiana
- 6.9.15 Iowa
- 6.9.16 Kansas
- 6.9.17 Kentucky
- 6.9.18 Louisiana
- 6.9.19 Maine
- 6.9.20 Maryland
- 6.9.21 Massachusetts
- 6.9.22 Michigan
- 6.9.23 Minnesota
- 6.9.24 Mississippi
- 6.9.25 Missouri
- 6.9.26 Montana
- 6.9.27 Nebraska
- 6.9.28 Nevada
- 6.9.29 New Hampshire
- 6.9.30 New Jersey
- 6.9.31 New Mexico
- 6.9.32 New York
- 6.9.33 North Carolina
- 6.9.34 North Dakota
- 6.9.35 Ohio
- 6.9.36 Oklahoma
- 6.9.37 Oregon
- 6.9.38 Pennsylvania
- 6.9.39 Rhode Island
- 6.9.40 South Carolina
- 6.9.41 South Dakota
- 6.9.42 Tennessee
- 6.9.43 Texas
- 6.9.44 Utah
- 6.9.45 Vermont
- 6.9.46 Virginia
- 6.9.47 Washington
- 6.9.48 West Virginia
- 6.9.49 Wisconsin
- 6.9.50 Wyoming
7 Competitive Landscape
- 7.1 Market Concentration
- 7.2 Strategic Moves
- 7.3 Market Share Analysis
- 7.4 Company Profiles (includes Global level Overview, Market level overview, Core Segments, Financials, Strategic Information, Market Rank/Share, Products and Services, Recent Developments)
- 7.4.1 New Flyer of America
- 7.4.2 BYD Auto Co. Ltd.
- 7.4.3 GILLIG LLC
- 7.4.4 Blue Bird Corporation
- 7.4.5 Lion Electric Co.
- 7.4.6 Daimler Truck Holding AG (Thomas Built)
- 7.4.7 REV Group Inc. (ENC)
- 7.4.8 Volvo Group (Nova Bus)
- 7.4.9 GreenPower Motor Co. Inc.
- 7.4.10 Phoenix Motorcars
- 7.4.11 Vicinity Motor Corp.
- 7.4.12 Cummins Inc. (Battery & Fuel-Cell)
- 7.4.13 Van Hool NV
- 7.4.14 TEMSA Skoda USA
- 7.4.15 Alexander Dennis Ltd.
- 7.4.16 Complete Coach Works (CCW)
8 Market Opportunities and Future Outlook
- 8.1 White-Space and Unmet-Need Assessment
9 Key Strategic Questions for CEOs

 燃料電池電動巴士全球市場規模、佔有率、趨勢和成長分析報告(2026-2034)
 公共運輸電氣化市場:按組件、應用、電池類型、全球價值鏈 (GVC)、推進系統、國家和地區分類-全球產業分析、市場規模、市場佔有率及2026年至2033年預測
 電動微型巴士市場:2026-2032年全球市場預測(按驅動系統、座位數、續航里程、電池容量、應用和最終用戶分類)電動校車市場:按驅動系統、車身長度、電池容量、校車類型、充電方式和最終用戶分類-2026-2032年全球市場預測電動巴士市場:2026-2032年全球市場預測(按推進系統、電池類型、底盤類型、座位數、續航里程、應用和最終用戶分類)
 電動巴士市場分析及預測(至2035年):類型、產品、技術、組件、應用、部署模式、最終用戶、功能、安裝模式
 電動巴士:市場佔有率分析、行業趨勢和統計數據、成長預測(2026-2031 年)
 2034年電動巴士市場預測:全球動力類型、電池類型、巴士長度、充電方式、座位數、電池容量、組件、應用、最終用戶和地區分析印度電動巴士:市場佔有率分析、產業趨勢與統計及成長預測(2026-2031 年)
 全球電動巴士市場:機會與策略展望(至2035年)