

 |
市場調查報告書
商品編碼
2073516
半導體產業:市場佔有率分析、產業趨勢與統計、成長預測(2026-2031)Semiconductor Industry - Market Share Analysis, Industry Trends & Statistics, Growth Forecasts (2026 - 2031) |
||||||
※ 本網頁內容可能與最新版本有所差異。詳細情況請與我們聯繫。
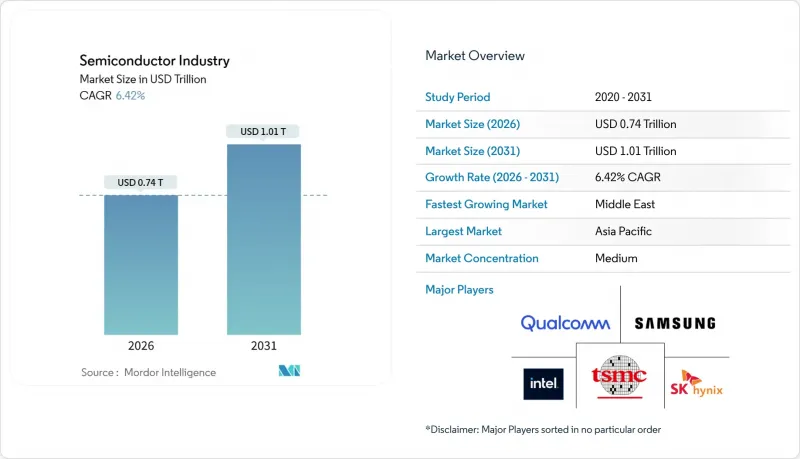
根據 Mordor Intelligence 預測,半導體產業市場規模預計在 2026 年達到 7,400 億美元,到 2031 年將達到 1.01 兆美元。
這代表著6.42%的複合年成長率,證實了穩定的結構性擴張。本報告按半導體裝置(離散半導體、光電子元件、感測器和微機電系統、積體電路、技術節點)、經營模式(整合元件製造商、設計/無晶圓廠供應商)、終端用戶產業(通訊(有線和無線)、消費性電子、工業、運算和無晶圓廠供應商)以及地區進行細分。市場預測以價值(美元)和數量(單位)呈現。
全球半導體產業趨勢與洞察
資料中心對人工智慧加速器的需求爆炸性成長
到2025年,超大規模營運商將部署超過150萬個圖形處理器(GPU)用於訓練生成式人工智慧,這將完全消耗台積電(TSMC)的4奈米和5奈米製程產能,並將基板前置作業時間延長至40週以上。英偉達(NVIDIA)資料中心部門在2025年第三季的營收達到308億美元,佔總營收的87%。同時,AMD憑藉MI300的首次出貨,佔據了加速器市場約15%的佔有率。從訓練到推理的轉變推動了對高吞吐量/瓦低精度計算核心的需求,這種特性非常適合專用積體電路(ASIC)。 2025年,高頻寬記憶體的出貨量年增60%,SK海力士(SK Hynix)推出的12層堆疊式HBM3E實現了Terabyte/s的頻寬。這是擁有1兆個參數的語言模型所需的頻寬閾值。隨著裝置更換週期從五年縮短至三年,即使裝置市場日益飽和,半導體市場仍保持著強勁的成長動能。
邊緣人工智慧在消費性物聯網設備中的普及
神經處理單元 (NPU) 價格的下降使得智慧型手機和穿戴式裝置製造商能夠整合裝置端推理功能,運行參數高達 100 億的大規模語言模型,從而消除雲端延遲和持續的頻寬費用。這種轉變正推動資料中心工作負載向終端遷移,提高智慧家庭、擴增實境(AR) 頭戴裝置和健康監測設備中感測器的整體搭載率,並促進低功耗微控制器的生產。邊緣運算也推動了先進封裝技術的應用,該技術將邏輯和記憶體堆疊在單一封裝中,使功耗低於 8 瓦——這是單晶片處理器尚未充分覆蓋的細分領域。亞太地區半導體需求正在迅速成長,因為該地區生產了大部分消費物聯網硬體,進一步鞏固了其在半導體市場的核心地位。預計這一因素將在 2026 年至 2028 年間產生最大影響,屆時組件價格預計將降至每台設備 10 美元以下,軟體生態系統也將趨於成熟。
波長小於 2 奈米的微影術瓶頸依然存在。
2025年,ASML僅計畫交付11台高數值孔徑極紫外線(EUV)掃描器。這遠低於英特爾、台積電和三星電子同時支援2奈米製程量產所需的20台設備。每台設備的成本約為3.5億歐元(3.85億美元),需要40個符合ISO標準的貨櫃,這限制了其在全球的部署範圍。光學元件的數值孔徑從0.33提升至0.55,縮小了景深裕度,需要更換光阻劑並進行多重圖形化。這導致每片晶圓的製程步驟超過2000道,成本增加了約25%。由於難以提高良率,初始晶片良率低於60%,限制了尖端智慧型手機和資料中心處理器的生產。由此造成的產能壓力減緩了莫耳定律的步伐,競爭優勢正從單純的電晶體密度轉向能夠透過晶片整合推動創新的公司。
細分市場分析
預計到2025年,積體電路將佔總銷售額的78.33%,凸顯其在運算、儲存和通訊領域的關鍵作用。同時,隨著智慧技術從雲端向邊緣設備轉移,感測器和微機電系統(MEMS)的出貨量預計將以8.49%的複合年成長率成長。這一趨勢使邊緣推理引擎成為半導體產業的主要成長動力。高頻寬記憶體作為關鍵細分市場,預計在2025年出貨量將成長60%,這主要得益於人工智慧加速器的需求,從而提升了半導體產業先進DRAM堆疊的絕對市場規模。相較之下,離散半導體受惠於碳化矽(SiC)在電動車逆變器領域45%的出貨量激增,顯示能源效率如今已成為一項策略差異化因素。
類比積體電路、微控制器和數位訊號處理器持續整合為網域控制器,元件數量減少,而單價卻增加了五倍。微機電系統(MEMS)裝置將加速計、陀螺儀和壓力感測器與嵌入式邏輯相結合,正在推動工業領域的預測性維護和穿戴式裝置的手勢姿態辨識,這種融合正在擴大目標市場。分立元件、光電子元件和電源相關元件繼續為可再生能源轉換和汽車LiDAR等高成長細分市場做出貢獻。因此,儘管矽的市佔率可能會有所調整,但在整個預測期內,積體電路仍將是半導體市場的基礎。
區域分析
預計到2025年,亞太地區將佔全球銷售額的59.69%。這主要得益於台積電在邏輯晶片領域的領先地位、三星電子在記憶體領域的統治地位以及中國成熟製程節點的快速擴張。然而,台灣長期面臨缺水問題,預計到2024年,台灣晶圓廠的日均用水量將達到15.6萬噸,這引發了人們對永續性的擔憂,並促使日本、新加坡和印度等國必須確保備用產能。印度為美光和塔塔集團提供的100億美元獎勵計畫旨在填補汽車和電信產業國內需求的缺口,這標誌著印度在區域多元化方面邁出了戰略性一步。澳洲雖然製造業產能不足,但正在擴大關鍵礦產的出口,並不斷提升其在上游產業的地位。
北美正經歷快速成長,這得益於《晶片產業創新法案》(CHIPS Act)提供的527億美元津貼。英特爾和台積電(TSMC)正在美國西南部和太平洋西北地區打造數十億美元的叢集。加拿大專注於擁有豐富智慧財產權的設計中心,而墨西哥則在訂單與近岸外包相關的組裝業務外包合約。歐洲正利用《晶片產業創新法案》提供的430億歐元(473億美元)資金,力爭2030年佔全球晶片產量的20%,並正在利用德國的汽車供應鏈和法國在功率半導體領域的專業技術。
中東和非洲是成長最快的地區,年成長率達8.51%,這主要得益於阿布達比投資30億美元的先進封裝工廠的建設以及沙烏地阿拉伯28奈米製程廠的建設計畫。主權財富基金的支持確保了長期資金籌措和豐富的石化原料供應。非洲的主要角色仍然是礦產資源,特別是鈷和鉭,但埃及和肯亞正在探索向下游組裝製程領域擴張的可能性。由於基礎建設匱乏和資本密集度高,南美洲在全球增加價值中所佔比例不到2%。
其他好處:
- Excel格式的市場預測(ME)表
- 3個月的分析師支持
目錄
第1章:引言
- 研究假設和市場定義
- 調查範圍
第2章:調查方法
第3章執行摘要
第4章 市場狀況
- 市場概覽
- 市場促進因素
- 資料中心對人工智慧加速器的需求爆炸性成長
- 消費性物聯網設備中的普遍邊緣人工智慧
- 汽車(電動車和高級駕駛輔助系統)向基於區域的架構過渡
- 對在美國、歐盟、印度和中東及北非地區進行本土化生產給予優惠待遇。
- 這是透過異質整合降低成本的轉捩點。
- Chiplet市場的商業化(UCIe,IP重複使用)
- 市場限制因素
- 波長小於2奈米的微影術仍存在瓶頸
- 地緣政治因素導致出口管制加強
- 鑄造廠叢集面臨水電短缺問題
- 5奈米以下製程的程式工程人員短缺
- 產業價值鏈分析
- 監理情勢
- 技術展望
- 宏觀經濟因素對市場的影響
- 波特五力分析
第5章 市場規模與成長預測
- 透過半導體裝置
- 離散半導體
- 二極體
- 電晶體
- 功率電晶體
- 整流器和閘流體
- 其他離散半導體
- 光電子學
- 發光二極體(LED)
- 雷射二極體
- 影像感測器
- 歐普託卡普拉
- 其他光電子裝置
- 感測器和微機電系統
- 壓力感測器
- 磁場感測器
- 執行器
- 加速度計和偏航率感測器
- 溫度感測器和其他感測器/MEMS
- 積體電路
- 類比積體電路
- 微積體電路
- 微處理器(MPU)
- 微控制器(MCU)
- 數位訊號處理器
- 邏輯積體電路
- 記憶體積體電路
- 技術節點
- 小於3奈米
- 3 nm
- 5 nm
- 7 nm
- 16 nm
- 28 nm
- 28奈米或更大
- 離散半導體
- 按經營模式
- IDM
- 設計/無晶圓廠供應商
- 按最終用戶行業分類
- 車
- 通訊(有線和無線)
- 消費者
- 產業
- 計算和數據存儲
- 政府(航太/國防)
- 按地區
- 北美洲
- 美國
- 加拿大
- 墨西哥
- 歐洲
- 德國
- 英國
- 法國
- 其他歐洲國家
- 亞太地區
- 中國
- 日本
- 印度
- 韓國
- 澳洲
- 其他亞太國家
- 中東和非洲
- 中東
- 非洲
- 其他中東和非洲國家
- 南美洲
- 巴西
- 阿根廷
- 其他南美國家
- 北美洲
第6章 競爭情勢
- 市場集中度
- 策略趨勢
- 市佔率分析
- 公司簡介
- Intel Corporation
- Samsung Electronics Co., Ltd.
- Taiwan Semiconductor Manufacturing Company Ltd.
- SK hynix Inc.
- Micron Technology Inc.
- Broadcom Inc.
- Qualcomm Inc.
- NVIDIA Corporation
- Advanced Micro Devices Inc.
- STMicroelectronics NV
- Infineon Technologies AG
- NXP Semiconductors NV
- Analog Devices Inc.
- ON Semiconductor Corp.
- Renesas Electronics Corp.
- Microchip Technology Inc.
- Rohm Co., Ltd.
- Marvell Technology Inc.
- MediaTek Inc.
- ASE Technology Holding Co., Ltd.
- Amkor Technology Inc.
- Jiangsu Changjiang Electronics Technology Co., Ltd.
- Powertech Technology Inc.
- Teradyne Inc.
- Advantest Corp.
- KLA Corp.
- Applied Materials Inc.
- ASML Holding NV
- Lam Research Corp.
- Tokyo Electron Ltd.
- SCREEN Holdings Co., Ltd.
- Nikon Corp.
- Hitachi High-Tech Corp.
- Lasertec Corp.
- GlobalFoundries Inc.
- United Microelectronics Corp.
- Semiconductor Manufacturing International Corp.
- Hua Hong Semiconductor Ltd.
- Powerchip Semiconductor Manufacturing Corp.
- Silicon Motion Technology Corp.
- Shin-Etsu Chemical Co., Ltd.
- GlobalWafers Co., Ltd.
- Indium Corp.
- DuPont de Nemours Inc.
- BASF SE
- Henkel AG and Co. KGaA
- Resonac Holdings Corp.
第7章 市場機會與未來展望
According to Mordor Intelligence, the semiconductor industry size stood at USD 0.74 trillion in 2026 and is projected to reach USD 1.01 trillion by 2031, implying a 6.42% CAGR and confirming steady structural expansion. This report is Segmented by Semiconductor Devices (Discrete Semiconductors, Optoelectronics, Sensors and MEMS, Integrated Circuits, Technology Node), Business Model (IDM, Design/Fabless Vendor), End-User Industry (Communication (Wired and Wireless), Consumer, Industrial, Computing and Data Storage, and More), and Geography. The Market Forecasts are Provided in Terms of Value (USD) and Volume (Units).
Global Semiconductor Industry Trends and Insights
Explosive Data-Center Demand for AI Accelerators
Hyperscale operators deployed more than 1.5 million graphics processing units for generative AI training in 2025, fully absorbing Taiwan Semiconductor Manufacturing Company's 4-nanometer and 5-nanometer capacity and stretching substrate lead-times beyond 40 weeks. NVIDIA's data-center revenue hit USD 30.8 billion in the third quarter of fiscal 2025, accounting for 87% of sales, while Advanced Micro Devices captured roughly 15% of the accelerator segment with initial MI300 shipments. The pivot from training to inference is boosting demand for low-precision arithmetic cores that deliver higher throughput per watt, a profile well suited to application-specific integrated circuits. High-bandwidth memory shipments climbed 60% year over year in 2025 as SK Hynix introduced 12-high HBM3E stacks capable of 1.2 terabytes per second, a bandwidth threshold needed for trillion-parameter language models. Shortening replacement cycles from five years to three years keeps the semiconductor market on a resilient growth trajectory despite mature device saturation.
Ubiquitous Edge-AI in Consumer IoT Devices
Pricing of neural processing units now enables smartphone and wearables makers to embed on-device inference that executes large language models with up to 10 billion parameters, eliminating cloud latency and recurring bandwidth fees. The shift moves data-center workloads to endpoints, raising total sensor attach rates and boosting low-power microcontroller volumes in home automation, augmented-reality headsets, and health-monitoring gadgets. Edge compute also spurs the adoption of advanced packaging techniques that stack logic and memory in a single package at sub-8-watt envelopes, a niche underserved by monolithic processors. Because Asia Pacific manufactures most consumer IoT hardware, silicon demand in that region grows rapidly, reinforcing its centrality to the semiconductors market. The driver is likely to exert its greatest impact between 2026 and 2028 as component pricing falls below USD 10 per device and software ecosystems mature.
Persistent Lithography Bottlenecks Below 2 nm
ASML shipped only 11 high-numerical-aperture extreme ultraviolet scanners in 2025, far short of the 20 units needed to support simultaneous 2-nanometer ramps at Intel, Taiwan Semiconductor Manufacturing Company, and Samsung Electronics. Each tool costs about EUR 350 million (USD 385 million) and requires 40 ISO-class shipping containers, limiting deployments to a handful of sites worldwide. The transition from 0.33 to 0.55 numerical aperture optics shrinks depth-of-focus margins, forcing photoresist changes and multi-patterning that raise process steps to more than 2,000 per wafer, inflating costs by roughly 25%. Yield ramp struggles pushed initial die yields below 60%, constraining volumes for leading-edge smartphones and data-center processors. The resulting capacity squeeze slows the cadence of Moore's Law and shifts competitive advantage toward companies that can innovate through chiplet integration rather than raw transistor density.
Other drivers and restraints analyzed in the detailed report include:
- Automotive Zonal-Architecture Migration
- On-shoring Incentives in the United States, the European Union, India, and Middle East, and Africa
- Geopolitical Export-Control Escalations
For complete list of drivers and restraints, kindly check the Table Of Contents.
Segment Analysis
Integrated circuits accounted for 78.33% of 2025 revenue, underscoring their outsized role in computing, storage, and communications, while sensor and MEMS volumes are projected to expand at an 8.49% CAGR as intelligence moves from the cloud to edge devices. This trend positions edge inference engines as a primary growth catalyst in the semiconductors industry. High-bandwidth memory, a critical segment, posted a 60% shipment jump in 2025 on the back of AI accelerator demand, lifting the semiconductor industry's market size for advanced DRAM stacks in absolute terms. In contrast, discrete semiconductors benefited from a 45% surge in silicon carbide shipments for electric-vehicle inverters, proving that power efficiency is now a strategic differentiator.
Analog integrated circuits, microcontrollers, and digital signal processors continue to aggregate into domain controllers, shrinking component counts yet raising per-unit value fivefold. MEMS devices that combine accelerometers, gyroscopes, and pressure sensors with embedded logic are enabling predictive maintenance in industry and gesture recognition in wearables, a convergence that expands the addressable market. Discrete, optoelectronic, and power categories still serve high-growth niches such as renewable-energy conversion and vehicle lidar. As a result, silicon share may rebalance modestly, but integrated circuits will remain the cornerstone of the semiconductor market through the forecast horizon.
Complete Report Scope:
- By Semiconductor Devices
- Discrete Semiconductors
- Diodes
- Transistors
- Power Transistors
- Rectifier and Thyristor
- Other Discrete Semiconductors
- Optoelectronics
- Light-Emitting Diodes (LEDs)
- Laser Diodes
- Image Sensors
- Optocouplers
- Other Optoelectronics
- Sensors and MEMS
- Pressure Sensors
- Magnetic-Field Sensors
- Actuators
- Acceleration and Yaw-Rate Sensors
- Temperature and Other Sensors and MEMS
- Integrated Circuits
- Analog Integrated Circuits
- Micro Integrated Circuits
- Microprocessors (MPU)
- Microcontrollers (MCU)
- Digital Signal Processors
- Logic Integrated Circuits
- Memory Integrated Circuits
- Technology Node
- Below 3 nm
- 3 nm
- 5 nm
- 7 nm
- 16 nm
- 28 nm
- Above 28 nm
- Discrete Semiconductors
- By Business Model
- IDM
- Design / Fabless Vendor
- By End-User Industry
- Automotive
- Communication (Wired and Wireless)
- Consumer
- Industrial
- Computing and Data Storage
- Government (Aerospace and Defense)
- By Geography
- North America
- United States
- Canada
- Mexico
- Europe
- Germany
- United Kingdom
- France
- Rest of Europe
- Asia-Pacific
- China
- Japan
- India
- South Korea
- Australia
- Rest of Asia-Pacific
- Middle East and Africa
- Middle East
- Africa
- Rest of Middle East and Africa
- South America
- Brazil
- Argentina
- Rest of South America
- North America
Geography Analysis
Asia Pacific accounted for 59.69% of revenue in 2025, supported by Taiwan Semiconductor Manufacturing Company's logic leadership, Samsung Electronics' memory dominance, and China's rapid mature-node expansion. Yet chronic water shortages in Taiwan, where fabs consumed 156,000 tons daily in 2024, raise sustainability questions and compel contingency capacity in Japan, Singapore, and India. India's USD 10 billion incentive plan for Micron and Tata aims to plug domestic demand gaps in the automotive and telecom sectors, marking a strategic step toward regional diversification. Australia scales up critical-mineral exports, solidifying its upstream importance despite lacking fabrication capacity.
North America surged on USD 52.7 billion in CHIPS Act grants, with Intel and Taiwan Semiconductor Manufacturing Company building multibillion-dollar clusters in the Southwest and Pacific Northwest. Canada emphasizes IP-rich design centers, while Mexico wins outsourced assembly mandates linked to nearshoring. Europe targets 20% global production by 2030 via EUR 43 billion (USD 47.3 billion) in Chips Act funding and leverages automotive supply chains in Germany and power-semiconductor expertise in France.
The Middle East and Africa are the fastest-growing regions, with 8.51% growth, buoyed by a USD 3 billion advanced-packaging buildout in Abu Dhabi and prospective 28-nanometer fabs in Saudi Arabia. Sovereign wealth backing ensures patient capital and access to abundant petrochemical feedstocks. Africa's main role remains as a mineral supplier, particularly of cobalt and tantalum, yet downstream moves into assembly in Egypt and Kenya are under evaluation. South America contributes less than 2% of global value, hindered by limited infrastructure and high capital intensity.
- Intel Corporation
- Samsung Electronics Co., Ltd.
- Taiwan Semiconductor Manufacturing Company Ltd.
- SK hynix Inc.
- Micron Technology Inc.
- Broadcom Inc.
- Qualcomm Inc.
- NVIDIA Corporation
- Advanced Micro Devices Inc.
- STMicroelectronics N.V.
- Infineon Technologies AG
- NXP Semiconductors N.V.
- Analog Devices Inc.
- ON Semiconductor Corp.
- Renesas Electronics Corp.
- Microchip Technology Inc.
- Rohm Co., Ltd.
- Marvell Technology Inc.
- MediaTek Inc.
- ASE Technology Holding Co., Ltd.
- Amkor Technology Inc.
- Jiangsu Changjiang Electronics Technology Co., Ltd.
- Powertech Technology Inc.
- Teradyne Inc.
- Advantest Corp.
- KLA Corp.
- Applied Materials Inc.
- ASML Holding N.V.
- Lam Research Corp.
- Tokyo Electron Ltd.
- SCREEN Holdings Co., Ltd.
- Nikon Corp.
- Hitachi High-Tech Corp.
- Lasertec Corp.
- GlobalFoundries Inc.
- United Microelectronics Corp.
- Semiconductor Manufacturing International Corp.
- Hua Hong Semiconductor Ltd.
- Powerchip Semiconductor Manufacturing Corp.
- Silicon Motion Technology Corp.
- Shin-Etsu Chemical Co., Ltd.
- GlobalWafers Co., Ltd.
- Indium Corp.
- DuPont de Nemours Inc.
- BASF SE
- Henkel AG and Co. KGaA
- Resonac Holdings Corp.
Additional Benefits:
- The market estimate (ME) sheet in Excel format
- 3 months of analyst support
TABLE OF CONTENTS
1 INTRODUCTION
- 1.1 Study Assumptions and Market Definition
- 1.2 Scope of the Study
2 RESEARCH METHODOLOGY
3 EXECUTIVE SUMMARY
4 MARKET LANDSCAPE
- 4.1 Market Overview
- 4.2 Market Drivers
- 4.2.1 Explosive Data-Center Demand for AI Accelerators
- 4.2.2 Ubiquitous Edge-AI in Consumer IoT Devices
- 4.2.3 Automotive Zonal-Architecture Migration (EV and ADAS)
- 4.2.4 On-shoring Incentives in US, EU, India, and MENA
- 4.2.5 Heterogeneous Integration's Cost-Down Inflection
- 4.2.6 Chiplet Marketplace Commercialization (UCIe, IP Re-use)
- 4.3 Market Restraints
- 4.3.1 Persistent Lithography Bottlenecks Below 2 nm
- 4.3.2 Geopolitical Export-Control Escalations
- 4.3.3 Water and Power Scarcity in Foundry Clusters
- 4.3.4 Talent Crunch in Sub-5 nm Process Engineering
- 4.4 Industry Value Chain Analysis
- 4.5 Regulatory Landscape
- 4.6 Technological Outlook
- 4.7 Impact of Macroeconomic Factors on the Market
- 4.8 Porter's Five Forces Analysis
- 4.8.1 Bargaining Power of Suppliers
- 4.8.2 Bargaining Power of Buyers
- 4.8.3 Threat of New Entrants
- 4.8.4 Threat of Substitutes
- 4.8.5 Intensity of Competitive Rivalry
5 MARKET SIZE AND GROWTH FORECASTS (VALUE AND VOLUME)
- 5.1 By Semiconductor Devices
- 5.1.1 Discrete Semiconductors
- 5.1.1.1 Diodes
- 5.1.1.2 Transistors
- 5.1.1.3 Power Transistors
- 5.1.1.4 Rectifier and Thyristor
- 5.1.1.5 Other Discrete Semiconductors
- 5.1.2 Optoelectronics
- 5.1.2.1 Light-Emitting Diodes (LEDs)
- 5.1.2.2 Laser Diodes
- 5.1.2.3 Image Sensors
- 5.1.2.4 Optocouplers
- 5.1.2.5 Other Optoelectronics
- 5.1.3 Sensors and MEMS
- 5.1.3.1 Pressure Sensors
- 5.1.3.2 Magnetic-Field Sensors
- 5.1.3.3 Actuators
- 5.1.3.4 Acceleration and Yaw-Rate Sensors
- 5.1.3.5 Temperature and Other Sensors and MEMS
- 5.1.4 Integrated Circuits
- 5.1.4.1 Analog Integrated Circuits
- 5.1.4.2 Micro Integrated Circuits
- 5.1.4.2.1 Microprocessors (MPU)
- 5.1.4.2.2 Microcontrollers (MCU)
- 5.1.4.2.3 Digital Signal Processors
- 5.1.4.3 Logic Integrated Circuits
- 5.1.4.4 Memory Integrated Circuits
- 5.1.5 Technology Node
- 5.1.5.1 Below 3 nm
- 5.1.5.2 3 nm
- 5.1.5.3 5 nm
- 5.1.5.4 7 nm
- 5.1.5.5 16 nm
- 5.1.5.6 28 nm
- 5.1.5.7 Above 28 nm
- 5.1.1 Discrete Semiconductors
- 5.2 By Business Model
- 5.2.1 IDM
- 5.2.2 Design / Fabless Vendor
- 5.3 By End-User Industry
- 5.3.1 Automotive
- 5.3.2 Communication (Wired and Wireless)
- 5.3.3 Consumer
- 5.3.4 Industrial
- 5.3.5 Computing and Data Storage
- 5.3.6 Government (Aerospace and Defense)
- 5.4 By Geography
- 5.4.1 North America
- 5.4.1.1 United States
- 5.4.1.2 Canada
- 5.4.1.3 Mexico
- 5.4.2 Europe
- 5.4.2.1 Germany
- 5.4.2.2 United Kingdom
- 5.4.2.3 France
- 5.4.2.4 Rest of Europe
- 5.4.3 Asia-Pacific
- 5.4.3.1 China
- 5.4.3.2 Japan
- 5.4.3.3 India
- 5.4.3.4 South Korea
- 5.4.3.5 Australia
- 5.4.3.6 Rest of Asia-Pacific
- 5.4.4 Middle East and Africa
- 5.4.4.1 Middle East
- 5.4.4.2 Africa
- 5.4.4.3 Rest of Middle East and Africa
- 5.4.5 South America
- 5.4.5.1 Brazil
- 5.4.5.2 Argentina
- 5.4.5.3 Rest of South America
- 5.4.1 North America
6 COMPETITIVE LANDSCAPE
- 6.1 Market Concentration
- 6.2 Strategic Moves
- 6.3 Market Share Analysis
- 6.4 Company Profiles (includes Global Level Overview, Market Level Overview, Core Segments, Financials, Strategic Information, Market Rank/Share, Products and Services, Recent Developments)
- 6.4.1 Intel Corporation
- 6.4.2 Samsung Electronics Co., Ltd.
- 6.4.3 Taiwan Semiconductor Manufacturing Company Ltd.
- 6.4.4 SK hynix Inc.
- 6.4.5 Micron Technology Inc.
- 6.4.6 Broadcom Inc.
- 6.4.7 Qualcomm Inc.
- 6.4.8 NVIDIA Corporation
- 6.4.9 Advanced Micro Devices Inc.
- 6.4.10 STMicroelectronics N.V.
- 6.4.11 Infineon Technologies AG
- 6.4.12 NXP Semiconductors N.V.
- 6.4.13 Analog Devices Inc.
- 6.4.14 ON Semiconductor Corp.
- 6.4.15 Renesas Electronics Corp.
- 6.4.16 Microchip Technology Inc.
- 6.4.17 Rohm Co., Ltd.
- 6.4.18 Marvell Technology Inc.
- 6.4.19 MediaTek Inc.
- 6.4.20 ASE Technology Holding Co., Ltd.
- 6.4.21 Amkor Technology Inc.
- 6.4.22 Jiangsu Changjiang Electronics Technology Co., Ltd.
- 6.4.23 Powertech Technology Inc.
- 6.4.24 Teradyne Inc.
- 6.4.25 Advantest Corp.
- 6.4.26 KLA Corp.
- 6.4.27 Applied Materials Inc.
- 6.4.28 ASML Holding N.V.
- 6.4.29 Lam Research Corp.
- 6.4.30 Tokyo Electron Ltd.
- 6.4.31 SCREEN Holdings Co., Ltd.
- 6.4.32 Nikon Corp.
- 6.4.33 Hitachi High-Tech Corp.
- 6.4.34 Lasertec Corp.
- 6.4.35 GlobalFoundries Inc.
- 6.4.36 United Microelectronics Corp.
- 6.4.37 Semiconductor Manufacturing International Corp.
- 6.4.38 Hua Hong Semiconductor Ltd.
- 6.4.39 Powerchip Semiconductor Manufacturing Corp.
- 6.4.40 Silicon Motion Technology Corp.
- 6.4.41 Shin-Etsu Chemical Co., Ltd.
- 6.4.42 GlobalWafers Co., Ltd.
- 6.4.43 Indium Corp.
- 6.4.44 DuPont de Nemours Inc.
- 6.4.45 BASF SE
- 6.4.46 Henkel AG and Co. KGaA
- 6.4.47 Resonac Holdings Corp.
7 MARKET OPPORTUNITIES AND FUTURE OUTLOOK
- 7.1 White-Space and Unmet-Need Assessment
 半導體元件清洗市場:依清潔劑、清洗設備、產業、清洗製程、材料類型、國家及地區分類-全球產業分析、市場規模、市場佔有率及2026年至2033年預測半導體及電路製造市場:依產品類型、應用、組件、晶圓尺寸、材料、國家及地區分類-全球產業分析、市場規模、市場佔有率及2026年至2033年預測
 全球半導體晶片生態系統市場:機會與策略展望(至2035年)
 2026 年至 2035 年電氣金屬管材的市場機會、成長要素、產業趨勢分析與預測。半導體及相關裝置市場:全球產業分析、市場規模、市場佔有率及預測(2026-2033 年),依半導體類型、裝置類型、材料類型、技術、應用、國家及地區分類半導體智慧電網市場:按組件、功能、應用、最終用戶、國家和地區分類-行業分析、市場規模、市場佔有率和預測(2026-2033 年)
 2026-2030年全球半導體市場
 用於替代能源技術的半導體:機會和市場
 有機半導體市場:全球產業規模、市場佔有率、趨勢、機會和預測(按材料類型、應用和地區分類)、競爭格局(2021-2031 年)
 智慧電網半導體元件市場預測至2034年:按元件、應用、最終用戶和地區分類的全球分析