


 |
市場調查報告書
商品編碼
2073477
壓縮機:市佔率分析、產業趨勢與統計、成長預測(2026-2031)Compressor - Market Share Analysis, Industry Trends & Statistics, Growth Forecasts (2026 - 2031) |
||||||

※ 本網頁內容可能與最新版本有所差異。詳細情況請與我們聯繫。
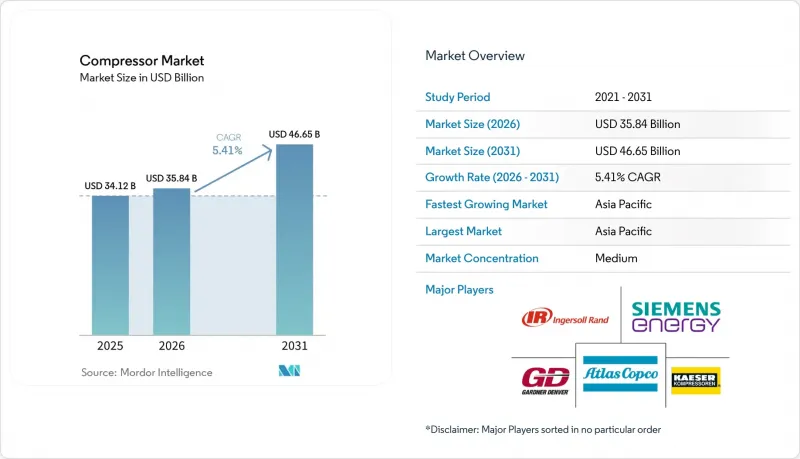
根據 Mordor Intelligence 預測,壓縮機市場規模預計將從 2025 年的 341.2 億美元成長到 2026 年的 358.4 億美元,到 2031 年達到 466.5 億美元,2026 年至 2031 年的複合年預計成長率為 5.41%。
本報告按類型(容積式和動壓式)、便攜性(固定式和可攜式)、壓力等級(低壓、中壓、高壓和超高壓)、最終用戶(石油和天然氣、發電、製造和工業、化工和石化、暖通空調製冷和建築服務、食品和飲料等)以及地區(北美、歐洲、亞太地區、南美和非洲)進行分類。
全球壓縮機市場趨勢及洞察
天然氣基礎設施和液化天然氣貿易的擴張
在卡達,預計到2029年,北田南、東兩期計畫每年將新增6,400萬噸液化天然氣(LNG)輸送量,這將需要每套裝置配備功率超過40兆瓦的離心式壓縮機。美國計劃在2025年將LNG出口量提高到116億立方英尺/日,並在金山口(Golden Pass)專案每套裝置上安裝六台Flame 7型壓縮機。在澳大利亞,斯卡伯勒(Scarborough)和布勞斯(Browse)浮式液化天然氣(FLNG)專案計劃在2027年前率先引入海底壓縮技術,以延長儲存的使用壽命。越南和孟加拉的再氣化終端正在安裝高運轉率撬裝設備,以確保在潮濕的熱帶地區98%的運轉率。中亞的管線正用變速離心式壓縮機維修蘇聯時代的往復式壓縮機組,從而減少20%的燃料氣消耗,這符合《巴黎協定》的承諾,並滿足了整個壓縮機產業的需求。
亞太地區製造業的快速工業自動化
在中國,大型工廠的機器人採用率預計2025年將達到68%,高於兩年前的52%。這將加速整個壓縮機產業的壓縮空氣更新換代。印度的生產連結獎勵計畫(PLI)預計到2025年初將吸引140億美元的投資,主要電子產品製造商正在訂購無油旋轉螺桿式壓縮機以防止焊膏缺陷。越南價值440億美元的服飾出口產業正從皮帶驅動活塞式壓縮機轉向直驅式永磁壓縮機,以滿足買家的能源審計要求。預計到2025年,泰國東部經濟走廊(EEC)的汽車零件供應商將為其噴漆室安裝符合ISO 8573-1一級標準的網路。印尼180萬噸的鎳處理能力依賴150巴的往復設備進行輸送和窯爐燃燒。
高昂的資本成本和營運成本
一台500kW的油浸式螺桿壓縮機,每年運作6000小時,電費0.12美元/千瓦時,其電費高達36萬美元,18個月內即可收回成本,與購置價格持平。預計到2025年第一季,歐洲電價將達到0.18歐元/kWh時,許多工廠將優先考慮洩漏維修而非新裝設備。壓力超過300巴的氫氣裝置的資本投資為每千瓦3000至5000美元,而7巴裝置的資本投資僅為每千瓦800至1200美元,這限制了此類裝置的推廣應用,使其僅限於獲得補貼的試點項目。印度和東協各國的中小企業貸款期限最長為3年,而改用變頻驅動(VSD)則需要5至7年的還款期。目前,在許多夾緊和頂出操作中,電動致動器的性能優於氣動致動器,降低了對低壓設備的需求。
細分市場分析
動態壓力式壓縮機(主要包括離心式和軸流式)預計到2025年僅佔總銷量的38.6%,但預計到2031年將以5.8%的複合年成長率成長,超過整體市場增速。容積式壓縮機仍佔據壓縮機市場61.4%的佔有率,應用範圍廣泛,從7巴的噴漆車間到900巴的加氫站均有涉及。對於超過300巴的應用,等熵效率超過85%的往復式壓縮機佔據主導地位。同時,由於與無油壓縮機相比,螺桿式壓縮機的資本支出(CAPEX)降低30-40%,因此仍是通用工業領域的主力產品。
在製藥和食品行業,旋轉螺桿壓縮機面臨日益嚴格的監管和污染壓力,市場需求正轉向注水式和乾式螺桿壓縮機等替代方案。離心式壓縮機在連續運轉流量超過10,000立方公尺/小時的情況下表現出色。軸流式壓縮機雖然仍屬於小眾市場,但在風洞試驗和碳捕集與封存(CCS)項目中,其應用日益廣泛,這些項目需要100,000立方米/小時或更高的流量以及適中的上壓。轉葉壓縮機的銷量佔比不到5%,但其在行動牙科和獸醫服務領域正逐漸站穩腳跟,因為這些領域對低於60分貝的低噪音要求至關重要。整體而言,產品多樣化正在維持壓縮機市場的競爭優勢。
到2025年,固定式壓縮機將佔據壓縮機市場佔有率的70.5%。這主要得益於大型工廠中兆瓦級壓縮機的整合,這些壓縮機透過固定管道為數百家用戶供氣。在新興地區基礎建設、移動性需求以及混合動力技術普及的推動下,可攜式機組市場正以每年6.5%的速度成長。一輛拖車式混合動力機組,將375千瓦柴油引擎與200千瓦時電池結合,可降低25%的油耗,並實現符合都市區法規的夜間靜音運行。
固定式壓縮機受益於能源回收,可將高達 90% 的輸入功率回收為製程熱或熱水,因此在食品業和區域供熱應用中,其 15-20% 的額外資本投資成本是合理的。另一方面,可攜式壓縮機則面臨歐盟第五階段排放標準引擎的成本,每台機組需增加 8,000 至 12,000 美元,促使壓縮機轉向電池供電的替代方案。租賃公司目前正利用遠端資訊處理技術來防止盜竊,將運轉率提高到 70% 以上,並在壓縮機市場中進一步提升其服務的差異化優勢。
區域分析
預計到2025年,亞太地區將佔據39.1%的市場佔有率,並在2031年以6.1%的複合年成長率成長,這主要得益於中國、印度和東協地區自動化、LNG接收站和綠色氫能項目的推進。預計到2025年,中國的機器人密度(每萬名工人)將飆升至392台,壓縮空氣網路正在沿海各省迅速擴張。在印度,一項價值140億美元的電子設備生產獎勵計畫(PLI)促進了富士康和和碩生產線採用無油壓縮機。在東南亞,為符合耐吉和阿迪達斯1200億美元服飾出口的審核標準,強制要求使用直驅式永磁壓縮機。在日本和韓國,半導體晶圓廠正在維修採用0級離心式鼓風機,使良率提高2-3個百分點。
預計到2025年,北美將佔全球壓縮機市場銷售額的約25%,並受益於液化天然氣(LNG)建設的擴張、氫氣試點項目以及《CHIPS法案》下工廠建設的增加,但頁岩盆地鑽井鑽機數量的波動也帶來了挑戰。預計到2025年,LNG出口量將達到116億立方英尺/日,屆時Golden Pass和Plakmins的Flame 7離心式鼓風機組運作。加州的車隊法規正在推動對900巴壓縮機站的需求,而加拿大則透過一項7.5億加元的津貼,資助油砂場將壓縮機改造為電動往復式壓縮機。在墨西哥,作為近岸外包專案的一部分,已在340家新建工廠中實施了符合底特律原始設備製造商(OEM)要求的集中式空氣供應網路。
歐洲約佔壓縮機市場22%的佔有率,反映出由於2025年能源效率標準修訂,油潤滑壓縮機組正被積極替換。 H2Global於2024年獲得一份價值9億歐元的契約,為漢堡和威廉港供應450巴的壓縮機組。東歐供應商推出的無油壓縮機正在滿足西歐原始設備製造商(OEM)的範圍3審核要求,而一個結合風能和空氣儲能的北歐原型系統計劃在2028年達到吉瓦時規模。
其他好處
- Excel格式的市場預測(ME)表
- 3個月的分析師支持
目錄
第1章:引言
- 研究假設和市場定義
- 調查範圍
第2章:調查方法
第3章執行摘要
第4章 市場狀況
- 市場概覽
- 市場促進因素
- 天然氣基礎設施和液化天然氣貿易的擴張
- 亞太地區製造業工業自動化快速發展。
- 加強全球能源效率和無油空氣法規
- 氫氣價值鏈中對高壓壓縮的需求
- 利用分散式可再生能源和微電網的現場空調系統
- 利用物聯網進行預測性維護,產生升級的連鎖反應。
- 市場限制因素
- 高昂的資本成本和營運(能源)成本
- 原料和稀土元素磁鐵價格波動
- 向分散式電動和氣動替代技術過渡
- 加強對傳統油潤滑車隊的監管
- 供應鏈分析
- 監理情勢
- 技術展望
- 波特五力模型
第5章 市場規模與成長預測
- 按類型
- 正位移
- 往復式
- 旋轉螺桿
- 轉葉
- 動態壓力型
- 離心式
- 軸類型
- 正位移
- 可移植性
- 固定式
- 可攜式的
- 按壓力等級
- 低壓(20 巴或以下)
- 中等壓力(20-100 巴)
- 高壓(100-300 巴)
- 超高壓(300巴或以上)
- 最終用戶
- 石油和天然氣
- 發電
- 製造業和工業
- 化工/石油化工
- 暖通空調冷氣及建築服務
- 汽車和運輸業
- 飲食
- 藥物
- 按地區
- 北美洲
- 美國
- 加拿大
- 墨西哥
- 歐洲
- 德國
- 法國
- 英國
- 義大利
- 西班牙
- 北歐國家
- 俄羅斯
- 土耳其
- 其他歐洲國家
- 亞太地區
- 中國
- 印度
- 日本
- 韓國
- ASEAN
- 澳洲和紐西蘭
- 其他亞太國家
- 南美洲
- 巴西
- 阿根廷
- 哥倫比亞
- 其他南美國家
- 中東和非洲
- 沙烏地阿拉伯
- 阿拉伯聯合大公國
- 卡達
- 南非
- 奈及利亞
- 埃及
- 其他中東和非洲國家
- 北美洲
第6章 競爭情勢
- 市場集中度
- 策略趨勢(併購、聯盟、購電協議)
- 市場佔有率分析(主要公司的市場排名和佔有率)
- 公司簡介
- Atlas Copco AB
- Ingersoll Rand plc
- Siemens Energy AG
- Gardner Denver Holdings Inc.
- Kaeser Kompressoren SE
- Hitachi Industrial Equipment Systems
- Baker Hughes Co.
- Sulzer Ltd
- Burckhardt Compression AG
- Ariel Corporation
- Bauer Compressors Inc.
- Aerzener Maschinenfabrik GmbH
- ELGi Equipments Ltd
- Doosan Portable Power
- Kobe Steel(Kobelco)
- Ebara Corporation
- FS-EllIoTt Co. LLC
- Mitsubishi Heavy Industries Compressor
- Howden Group
- Sullair LLC
第7章 市場機會與未來展望
According to Mordor Intelligence, the compressor market size is expected to increase from USD 34.12 billion in 2025 to USD 35.84 billion in 2026 and reach USD 46.65 billion by 2031, growing at a CAGR of 5.41% over 2026-2031.
This report is Segmented by Type (Positive Displacement and Dynamic), Portability (Stationary and Portable), Pressure Rating (Low, Medium, High, and Ultra-High), End-User (Oil and Gas, Power Generation, Manufacturing and Industrial, Chemicals and Petrochemicals, HVAC-R and Building Services, Food and Beverage, and More), and Geography (North America, Europe, Asia-Pacific, South America, and Middle East and Africa).
Global Compressor Market Trends and Insights
Expansion of Natural-Gas Infrastructure & LNG Trade
Qatar's North Field South and East phases will add 64 million tpa of LNG by 2029, each train requiring >40 MW centrifugal machines. The United States lifted LNG exports to 11.6 bcf/d in 2025, with Golden Pass deploying six frame-7 compressors per train. Australia's Scarborough and Browse FLNG ventures are pioneering subsea compression by 2027, extending reservoir life. Vietnam and Bangladesh regas terminals are installing high-uptime skids that guarantee 98% availability in humid tropics. Central Asian pipelines are retrofitting Soviet-era reciprocating units with variable-speed centrifugal designs, cutting fuel-gas consumption by 20% and aligning with Paris pledges, supporting demand across the compressor industry.
Rapid Industrial Automation in APAC Manufacturing
China recorded robotic penetration at 68% of large factories in 2025, up from 52% two years prior, amplifying compressed-air refresh cycles across the compressor industry. India's Production-Linked Incentive attracted USD 14 billion by early 2025, with EMS majors ordering oil-free rotary screws to avoid solder-paste defects. Vietnam's USD 44 billion garment exports swapped belt-driven pistons for direct-drive permanent-magnet units to satisfy buyers' energy audits. Thailand's Eastern Economic Corridor automotive suppliers installed ISO 8573-1 Class 1 networks for paint booths in 2025. Indonesia's 1.8 million-tonne nickel processing volume depends on 150-bar reciprocating fleets for conveying and kiln combustion.
High Capital & Operating Costs
A 500 kW oil-flooded screw running 6,000 h yearly at USD 0.12/kWh burns USD 360,000 in electricity, rivaling purchase price within 18 months. European tariffs at EUR 0.18/kWh in Q1 2025 caused many plants to favor leak repairs over new installs. Hydrogen units above 300 bar show a capex of USD 3,000-5,000/kW versus USD 800-1,200 for 7-bar machines, constraining uptake to subsidized pilots. SMEs across India and ASEAN face loan tenors capped at 3 years, while VSD conversions need 5-7 years to pay back. Electric actuators now outcompete pneumatics in many clamp-and-eject tasks, shrinking low-pressure demand.
Other drivers and restraints analyzed in the detailed report include:
- Stricter Global Energy-Efficiency & Oil-Free-Air Mandates
- Hydrogen Value-Chain Demand for High-Pressure Compression
- Volatile Raw-Material & Rare-Earth Magnet Pricing
For complete list of drivers and restraints, kindly check the Table Of Contents.
Segment Analysis
Dynamic units, chiefly centrifugal and axial, are projected to advance 5.8% CAGR through 2031, accelerating beyond the wider market even though they held only 38.6% revenue share in 2025. Positive displacement designs still delivered most of the compressor market size at 61.4%, serving applications from 7-bar paint shops to 900-bar hydrogen stations. Reciprocating machines dominate above-300-bar services, hitting isentropic efficiency above 85%, while rotary screws remain the workhorse for general industry because of 30-40% lower capex than oil-free peers.
Rotary screws face mounting regulatory and contamination pressure in pharma and food lines, pivoting demand toward water-injected or dry-screw alternatives. Centrifugals excel in continuous-duty flows exceeding 10,000 m3/h, whereas axial variants, though niche, are penetrating wind-tunnel testing and CCS projects needing >100,000 m3/h at modest pressure lift. Rotary vanes, under 5% of unit sales, sustain mobile dental and vet services where sub-60 dB noise is valued. Combined, product proliferation keeps competitive differentiation high across the compressor market.
Stationary installations commanded 70.5% of the 2025 compressor market share because large plants integrate multi-megawatt banks feeding hundreds of drops through fixed piping. Portable sets are accelerating 6.5% yearly as infrastructure builds in emerging regions, demand mobility, and hybrid power. Trailer hybrids pairing 375 kW diesels with 200 kWh batteries trim fuel 25% and allow silent night work under urban ordinances.
Stationary fleets capture energy-recovery benefits, reclaiming up to 90% input power as process heat or hot water, justifying a 15-20% capex premium in food and district-heating applications. Portable models contend with EU Stage V engine costs that add USD 8,000-12,000 per unit, nudging fleets toward battery-electric alternatives. Rental houses now link telematics to cut theft and lift utilization beyond 70%, reinforcing service differentiation in the compressor market.
Complete Report Scope:
- By Type
- Positive Displacement
- Reciprocating
- Rotary Screw
- Rotary Vane
- Dynamic
- Centrifugal
- Axial
- Positive Displacement
- By Portability
- Stationary
- Portable
- By Pressure Rating
- Low (Up to 20 bar)
- Medium (20 to 100 bar)
- High (100 to 300 bar)
- Ultra-High (Above 300 bar)
- By End-User
- Oil and Gas
- Power Generation
- Manufacturing and Industrial
- Chemicals and Petrochemicals
- HVAC-R and Building Services
- Automotive and Transportation
- Food and Beverage
- Healthcare and Pharmaceuticals
- By Geography
- North America
- United States
- Canada
- Mexico
- Europe
- Germany
- France
- United Kingdom
- Italy
- Spain
- NORDIC Countries
- Russia
- Turkey
- Rest of Europe
- Asia-Pacific
- China
- India
- Japan
- South Korea
- ASEAN Countries
- Australia and New Zealand
- Rest of Asia-Pacific
- South America
- Brazil
- Argentina
- Colombia
- Rest of South America
- Middle East and Africa
- Saudi Arabia
- United Arab Emirates
- Qatar
- South Africa
- Nigeria
- Egypt
- Rest of Middle East and Africa
- North America
Geography Analysis
Asia-Pacific's 39.1% 2025 share and 6.1% CAGR through 2031 arise from automation, LNG terminals, and green-hydrogen ambitions driving growth in the compressors market across China, India, and ASEAN. China's robot density soared to 392 units per 10,000 workers in 2025, expanding compressed-air grids across coastal provinces. India's USD 14 billion electronics PLI funnel stimulated oil-free installs at Foxconn and Pegatron lines. Southeast Asia's USD 120 billion garment exports now stipulate direct-drive PM machines to meet Nike and Adidas audits. Japan and South Korea retrofit semiconductor fabs with Class 0 centrifugal blowers, lifting yields 2-3 points.
North America, near 25% of 2025 sales in the compressors market, benefits from LNG build-outs, hydrogen pilots, and CHIPS Act fabs, yet faces rig-count volatility in shale basins. LNG exports hit 11.6 bcf/d in 2025, with frame-7 centrifugal banks at Golden Pass and Plaquemines. California's fleet rule drives 900-bar station demand, while Canada funds electric reciprocating retrofits in the oil sands via CAD 750 million grants. Mexico's 340 new plants under nearshoring added centralized air networks compliant with Detroit OEM expectations.
Europe's roughly 22% stake in the compressors market reflects aggressive replacement of oil-lubricated fleets compelled by the 2025 efficiency recast. H2Global's EUR 900 million contracts in 2024 secure 450-bar units for Hamburg and Wilhelmshaven. Eastern European suppliers installing oil-free fleets satisfy Western OEM Scope 3 audits, while Nordic wind-plus-pneumatic storage prototypes eye gigawatt-hour scale by 2028.
- Atlas Copco AB
- Ingersoll Rand plc
- Siemens Energy AG
- Gardner Denver Holdings Inc.
- Kaeser Kompressoren SE
- Hitachi Industrial Equipment Systems
- Baker Hughes Co.
- Sulzer Ltd
- Burckhardt Compression AG
- Ariel Corporation
- Bauer Compressors Inc.
- Aerzener Maschinenfabrik GmbH
- ELGi Equipments Ltd
- Doosan Portable Power
- Kobe Steel (Kobelco)
- Ebara Corporation
- FS-Elliott Co. LLC
- Mitsubishi Heavy Industries Compressor
- Howden Group
- Sullair LLC
Additional Benefits:
- The market estimate (ME) sheet in Excel format
- 3 months of analyst support
TABLE OF CONTENTS
1 Introduction
- 1.1 Study Assumptions & Market Definition
- 1.2 Scope of the Study
2 Research Methodology
3 Executive Summary
4 Market Landscape
- 4.1 Market Overview
- 4.2 Market Drivers
- 4.2.1 Expansion of natural-gas infrastructure & LNG trade
- 4.2.2 Rapid industrial automation in APAC manufacturing
- 4.2.3 Stricter global energy-efficiency & oil-free-air mandates
- 4.2.4 Hydrogen value-chain demand for high-pressure compression
- 4.2.5 Distributed renewables & micro-grid on-site air systems
- 4.2.6 IoT-enabled predictive-maintenance pull-through upgrades
- 4.3 Market Restraints
- 4.3.1 High capital & operating (energy) costs
- 4.3.2 Volatile raw-material & rare-earth magnet pricing
- 4.3.3 Shift to decentralized electric / pneumatic alternatives
- 4.3.4 Regulatory squeeze on legacy oil-lubricated fleets
- 4.4 Supply-Chain Analysis
- 4.5 Regulatory Landscape
- 4.6 Technological Outlook
- 4.7 Porter's Five Forces
- 4.7.1 Bargaining Power of Suppliers
- 4.7.2 Bargaining Power of Buyers
- 4.7.3 Threat of New Entrants
- 4.7.4 Threat of Substitutes
- 4.7.5 Intensity of Rivalry
5 Market Size & Growth Forecasts
- 5.1 By Type
- 5.1.1 Positive Displacement
- 5.1.1.1 Reciprocating
- 5.1.1.2 Rotary Screw
- 5.1.1.3 Rotary Vane
- 5.1.2 Dynamic
- 5.1.2.1 Centrifugal
- 5.1.2.2 Axial
- 5.1.1 Positive Displacement
- 5.2 By Portability
- 5.2.1 Stationary
- 5.2.2 Portable
- 5.3 By Pressure Rating
- 5.3.1 Low (Up to 20 bar)
- 5.3.2 Medium (20 to 100 bar)
- 5.3.3 High (100 to 300 bar)
- 5.3.4 Ultra-High (Above 300 bar)
- 5.4 By End-User
- 5.4.1 Oil and Gas
- 5.4.2 Power Generation
- 5.4.3 Manufacturing and Industrial
- 5.4.4 Chemicals and Petrochemicals
- 5.4.5 HVAC-R and Building Services
- 5.4.6 Automotive and Transportation
- 5.4.7 Food and Beverage
- 5.4.8 Healthcare and Pharmaceuticals
- 5.5 By Geography
- 5.5.1 North America
- 5.5.1.1 United States
- 5.5.1.2 Canada
- 5.5.1.3 Mexico
- 5.5.2 Europe
- 5.5.2.1 Germany
- 5.5.2.2 France
- 5.5.2.3 United Kingdom
- 5.5.2.4 Italy
- 5.5.2.5 Spain
- 5.5.2.6 NORDIC Countries
- 5.5.2.7 Russia
- 5.5.2.8 Turkey
- 5.5.2.9 Rest of Europe
- 5.5.3 Asia-Pacific
- 5.5.3.1 China
- 5.5.3.2 India
- 5.5.3.3 Japan
- 5.5.3.4 South Korea
- 5.5.3.5 ASEAN Countries
- 5.5.3.6 Australia and New Zealand
- 5.5.3.7 Rest of Asia-Pacific
- 5.5.4 South America
- 5.5.4.1 Brazil
- 5.5.4.2 Argentina
- 5.5.4.3 Colombia
- 5.5.4.4 Rest of South America
- 5.5.5 Middle East and Africa
- 5.5.5.1 Saudi Arabia
- 5.5.5.2 United Arab Emirates
- 5.5.5.3 Qatar
- 5.5.5.4 South Africa
- 5.5.5.5 Nigeria
- 5.5.5.6 Egypt
- 5.5.5.7 Rest of Middle East and Africa
- 5.5.1 North America
6 Competitive Landscape
- 6.1 Market Concentration
- 6.2 Strategic Moves (M&A, Partnerships, PPAs)
- 6.3 Market Share Analysis (Market Rank/Share for key companies)
- 6.4 Company Profiles (includes Global level Overview, Market level overview, Core Segments, Financials as available, Strategic Information, Products & Services, and Recent Developments)
- 6.4.1 Atlas Copco AB
- 6.4.2 Ingersoll Rand plc
- 6.4.3 Siemens Energy AG
- 6.4.4 Gardner Denver Holdings Inc.
- 6.4.5 Kaeser Kompressoren SE
- 6.4.6 Hitachi Industrial Equipment Systems
- 6.4.7 Baker Hughes Co.
- 6.4.8 Sulzer Ltd
- 6.4.9 Burckhardt Compression AG
- 6.4.10 Ariel Corporation
- 6.4.11 Bauer Compressors Inc.
- 6.4.12 Aerzener Maschinenfabrik GmbH
- 6.4.13 ELGi Equipments Ltd
- 6.4.14 Doosan Portable Power
- 6.4.15 Kobe Steel (Kobelco)
- 6.4.16 Ebara Corporation
- 6.4.17 FS-Elliott Co. LLC
- 6.4.18 Mitsubishi Heavy Industries Compressor
- 6.4.19 Howden Group
- 6.4.20 Sullair LLC
7 Market Opportunities & Future Outlook
- 7.1 White-Space & Unmet-Need Assessment

 V型壓縮機市場:依類型、應用、電源、最終用戶、國家及地區分類-全球產業分析、市場規模、市佔率及2026年至2033年預測
 2026年全球機械蒸氣再壓縮(MVR)壓縮機市場報告
 亞太地區壓縮機市場:市佔率分析、產業趨勢與統計及成長預測(2026-2031年)
 液封壓縮機市場-2026-2032年全球市場預測
 螺桿式壓縮機市場規模、佔有率和成長分析:按類型、壓力範圍、應用、最終用途、配銷通路和地區分類-2026-2033年產業預測壓縮機市場:2026-2032年全球市場預測(按類型、驅動系統、潤滑方式、壓力範圍、冷卻方式、級數、移動性、應用和分銷管道分類)
 汽車空調壓縮機市場規模、佔有率和成長分析:按類型、車輛類型、銷售管道和地區分類-2026-2033年產業預測
 2026-2030年全球壓縮機市場
 2026-2030年全球往復式壓縮機市場
 MVR壓縮機:2026-2032年全球市佔率及排名、總營收及需求預測