


 |
市場調查報告書
商品編碼
2073472
生物香草醛:市場佔有率分析、產業趨勢與統計、成長預測(2026-2031)Bio Vanillin - Market Share Analysis, Industry Trends & Statistics, Growth Forecasts (2026 - 2031) |
||||||

※ 本網頁內容可能與最新版本有所差異。詳細情況請與我們聯繫。
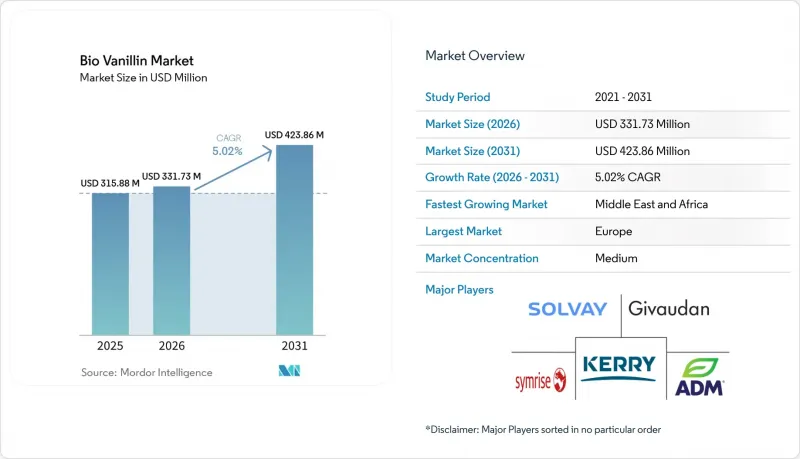
根據 Mordor Intelligence 預測,生物香草醛市場將從 2025 年的 3.1588 億美元成長到 2026 年的 3.3173 億美元,然後在 2031 年達到 4.2386 億美元,2026 年至 2031 年的複合年成長率為 5.02%。
本報告按產品形態(粉末、液體)、純度等級(食品級、醫藥級、香精級)、應用領域(食品飲料、醫藥、香精及個人護理)和地區(北美、歐洲、亞太、南美、中東和非洲)進行細分。市場預測以美元計價。
全球生物香草醛市場趨勢與洞察
食品飲料產業對永續性的需求日益成長。
食品飲料產業的永續性措施正在從根本上改變香草醛的籌資策略,各大生產商越來越重視那些能帶來可衡量環境效益的生物基替代品。博雷加德公司採用挪威雲杉木材生產的香草醛,與石油基香蘭素相比,二氧化碳排放減少了90%,樹立了引人注目的永續永續性標桿,與企業的環保承諾相契合。對永續發展的需求不僅限於碳足跡,還包括用水量、廢棄物產生量以及可再生資源的利用,這使得生物基香蘭素成為企業追求全面環境管理的重要策略成分。
關於「天然」標籤的監管支持
主要市場的法律規範透過嚴格定義「天然」一詞並排除石油衍生的合成替代品,為生物技術生產的香草醛提供了明顯的競爭優勢。美國酒精和菸草稅收貿易管理局 (TTB) 明確承認透過特定生物技術製程獲得的香草醛為天然香草醛,這使得像 Advanced Biotech 和 Apple Flavors 這樣的公司能夠以「天然」標籤銷售其產品,從而設定更高的價格。美國食品藥物管理局 (FDA) 根據《聯邦法規》第 21 篇第 172.510 條的規定,為包括生物香草醛在內的天然香料物質提供了明確的途徑,使其在使用經批准的食品藥物管理局方法生產時,能夠獲得「公認安全 (GRAS)」認證。法規環境正朝著更嚴格的透明度和可追溯性要求發展,這為能夠證明其成分天然且生產方法永續的生物技術香草醛提供了明顯的競爭優勢,同時也進一步阻礙了合成替代品的流通。
高昂的生產成本
生物技術生產的香草醛與合成替代品之間顯著的成本差異是市場擴張的最大障礙,需要對生產經濟性進行精心最佳化才能實現商業性可行性。目前的生物技術生產方法面臨著與發酵基礎設施、基材成本、下游製程和品管要求相關的固有成本挑戰,而合成生產則透過成熟的石油化學製程避免了這些挑戰。天然香草醛的價格為每公斤700美元,而合成香草醛的價格僅為每公斤15美元——價格相差46倍——這限制了其市場滲透,使其僅限於高階應用領域,在這些領域,「天然來源」的標籤能夠帶來可觀的價格溢價。此外,合成生產設施不需要專用設備、熟練人員和監管合規基礎設施,這進一步加劇了成本挑戰,並為新參與企業市場的企業設置了額外的進入門檻。
細分市場分析
截至2025年,粉末狀香草醛將佔據70.73%的市場。這反映了其優異的穩定性、較長的保存期限以及適用於各種食品加工應用,尤其適用於需要精確計量和穩定風味輸出的場合。粉狀產品之所以佔據市場主導地位,是因為與液體產品相比,它不易氧化和吸濕,因此成為那些需要在各種環境條件下保持較長保存期限和穩定產品性能的製造商的首選。
儘管液態生物香草醛的市佔率較小,但預計其成長率將最高,到2031年複合年成長率將達到8.58%。這主要得益於飲料生產商和流質食品應用領域對液態生物香草醛需求的不斷成長,在這些領域,即時溶解和均勻分散是關鍵的性能因素。液態配方在需要快速釋放風味和提高生物利用度的應用中備受關注,尤其是在製藥和營養補充劑領域,香草醛的抗氧化特性除了增添風味外,還能帶來其他功能性益處。
區域分析
由於嚴格的天然香料法規、完善的生物技術基礎設施以及消費者對優質天然成分的偏好,歐洲預計到2025年將保持其市場主導地位,市場佔有率將達到32.33%,從而為生物香草醛的推廣應用創造有利的市場環境。中東和非洲地區預計將實現最快成長,到2031年複合年成長率將達到7.51%,這主要得益於食品加工業的擴張、消費者對天然成分認知度的提高以及可支配收入的增加,從而促進了高級產品的消費。
北美市場受益於成熟的生物技術公司、完善的法規結構以及消費者對潔淨標示產品的需求,這些因素共同推動了生物香草醛在食品、製藥和個人護理領域的應用。該地區的市場發展也得到了博雷加德(Borregaard)等公司的支持,該公司已投資約1500萬美元擴大其香蘭素產能;此外,像Spero Renewables這樣的新興企業也在積極推動市場發展,該公司正在開發利用農業廢棄物進行成本競爭性生產的方法。
儘管亞太市場目前市場佔有率有限,但食品加工業的活性化、中產階級的壯大以及消費者對天然成分偏好的轉變,預計將改善長期市場動態,並帶來巨大的成長機會。區域差異反映了法規環境、消費者偏好和產業發展程度的不同,這些因素都會影響各地區生物香草醛市場的滲透率和成長策略。
其他好處:
- Excel格式的市場預測(ME)表
- 3個月的分析師支持
目錄
第1章:引言
- 研究假設和市場定義
- 調查範圍
第2章:調查方法
第3章執行摘要
第4章 市場狀況
- 市場概覽
- 市場促進因素
- 食品和飲料行業永續發展主導的需求
- 對「天然」標籤的監管支持
- 消費者對植物來源和純素產品的偏好日益成長
- 生物技術生產中的技術進步
- 提高合成香蘭素的進口關稅
- 高級產品潔淨標示趨勢日益成長
- 市場限制因素
- 高昂的生產成本
- 開發中國家缺乏意識
- 與法規和標籤相關的合規成本
- 與替代天然香料的競爭
- 供應鏈分析
- 監理展望
- 波特五力模型
第5章 市場規模與成長預測
- 按形式
- 粉末
- 液體
- 純度
- 食品級
- 醫藥級
- 香精等級
- 透過使用
- 食品/飲料
- 冰淇淋
- 燒製產品
- 飲料
- 巧克力和糖果甜點
- 其他食品和飲料用途
- 製藥
- 香水和個人護理
- 食品/飲料
- 按地區
- 北美洲
- 美國
- 加拿大
- 墨西哥
- 其他北美國家
- 南美洲
- 巴西
- 阿根廷
- 其他南美國家
- 歐洲
- 英國
- 德國
- 法國
- 義大利
- 俄羅斯
- 其他歐洲國家
- 亞太地區
- 中國
- 印度
- 日本
- 澳洲
- 其他亞太國家
- 中東和非洲
- 沙烏地阿拉伯
- 南非
- 其他中東和非洲國家
- 北美洲
第6章 競爭情勢
- 策略趨勢
- 市場排名分析
- 公司簡介
- Kerry Group plc
- Givaudan SA
- Solvay SA
- Symrise AG
- Archer-Daniels-Midland Company
- Borregaard AS
- Europabio
- Advanced Biotech
- BASF SE
- Camlin Fine Sciences Ltd
- International Flavors & Fragrances
- Biosynth Ltd
- Oamic Ingredients USA
- Takasago International Corporation
- Axxence Aromatic GmbH
- Evolva Holding SA
- Ennolys by Lesaffre
- Xi'an Healthful Biotechnology Co.,Ltd
- Jeneil Biotech
- Niranbio Chemical
第7章 市場機會與未來展望
According to Mordor Intelligence, the bio vanillin market size is expected to grow from USD 315.88 million in 2025 to USD 331.73 million in 2026 and is forecast to reach USD 423.86 million by 2031 at 5.02% CAGR over 2026-2031.
This report is Segmented by Form (Powder, and Liquid), Purity Grade (Food Grade, Pharma Grade, and Fragrance Grade), Application (Food and Beverage, Pharmaceutical, and Fragrance and Personal Care), and Geography (North America, Europe, Asia-Pacific, South America, and Middle East and Africa). The Market Forecasts are Provided in Terms of Value (USD).
Global Bio Vanillin Market Trends and Insights
Sustainability-Driven Demand from the Food and Beverage Sector
The food and beverage industry's commitment to sustainability is fundamentally reshaping vanillin procurement strategies, with major manufacturers increasingly prioritizing bio-based alternatives that demonstrate measurable environmental benefits. Borregaard's wood-based vanillin production from Norway Spruce achieves a 90% reduction in CO2 emissions compared to oil-based vanillin, establishing a compelling sustainability benchmark that resonates with corporate environmental commitments. The sustainability imperative extends beyond carbon footprint considerations to encompass water usage, waste generation, and renewable resource utilization, positioning bio vanillin as a strategic ingredient for companies pursuing comprehensive environmental stewardship.
Regulatory Support for "Natural" Label Claims
Regulatory frameworks across major markets are creating distinct competitive advantages for biotechnologically produced vanillin through precise definitions of "natural" that exclude petroleum-derived synthetic alternatives. The U.S. Alcohol and Tobacco Tax and Trade Bureau explicitly recognizes vanillin derived from specific biotechnological processes as natural vanillin, allowing companies like Advanced Biotech and Apple Flavors to market their products with natural labeling claims that command premium pricing. FDA (Food and Drug Administration) regulations under 21 CFR 172.510 provide clear pathways for natural flavoring substances, including bio vanillin, to achieve Generally Recognized as Safe (GRAS) status when produced through approved biotechnological methods. The regulatory environment is evolving toward greater transparency and traceability requirements, creating additional barriers for synthetic alternatives while providing clear competitive advantages for biotechnologically produced vanillin that can demonstrate natural sourcing and sustainable production methods.
High Production Cost
The substantial cost differential between biotechnologically produced vanillin and synthetic alternatives represents the most significant barrier to market expansion, with production economics requiring careful optimization to achieve commercial viability. Current biotechnological production methods face inherent cost challenges related to fermentation infrastructure, substrate costs, downstream processing, and quality control requirements that synthetic production avoids through established petrochemical pathways. The price gap between natural vanillin at USD 700 per kilogram and synthetic vanillin at USD 15 per kilogram creates a 46-fold cost differential that limits market penetration to premium applications where natural labeling commands sufficient price premiums. The cost challenge is compounded by the need for specialized equipment, skilled personnel, and regulatory compliance infrastructure that synthetic production facilities do not require, creating additional barriers to entry for new market participants.
Other drivers and restraints analyzed in the detailed report include:
- Growing Consumer Preference for Plant-Based and Vegan Products
- Technological Advancements in Biotechnological Production
- Lack of Awareness in Developing Countries
For complete list of drivers and restraints, kindly check the Table Of Contents.
Segment Analysis
Powder form bio vanillin commands 70.73% market share in 2025, reflecting its superior stability characteristics, extended shelf life, and compatibility with diverse food processing applications that require precise dosing and consistent flavor delivery. The powder segment's dominance stems from its reduced susceptibility to oxidation and moisture absorption compared to liquid alternatives, making it the preferred choice for manufacturers requiring long-term storage capabilities and consistent product performance across varying environmental conditions.
Liquid bio vanillin, despite representing a smaller market share, is projected to achieve the fastest growth at 8.58% CAGR through 2031, driven by increasing demand from beverage manufacturers and liquid food applications where immediate solubility and homogeneous distribution are critical performance factors. Liquid formulations are gaining traction in applications requiring rapid flavor release and enhanced bioavailability, particularly in pharmaceutical and nutraceutical products where vanillin's antioxidant properties provide functional benefits beyond flavoring.
Complete Report Scope:
- By Form
- Powder
- Liquid
- By Purity Grade
- Food Grade
- Pharma Grade
- Fragrance Grade
- By Application
- Food and Beverages
- Ice Cream
- Baked Goods
- Beverages
- Chocolate & Confectionery
- Other Food and Beverage Applications
- Pharmaceutical
- Fragrance and Personal Care
- Food and Beverages
- By Geography
- North America
- United States
- Canada
- Mexico
- Rest of North America
- South America
- Brazil
- Argentina
- Rest of South America
- Europe
- United Kingdom
- Germany
- France
- Italy
- Russia
- Rest of Europe
- Asia-Pacific
- China
- India
- Japan
- Australia
- Rest of Asia-Pacific
- Middle East and Africa
- Saudi Arabia
- South Africa
- Rest of Middle East and Africa
- North America
Geography Analysis
Europe maintains market leadership with 32.33% share in 2025, supported by stringent natural flavoring regulations, established biotechnology infrastructure, and consumer preferences for premium natural ingredients that create favorable market conditions for bio vanillin adoption. The Middle East and Africa region is positioned for the fastest growth at 7.51% CAGR through 2031, driven by expanding food processing industries, increasing consumer awareness of natural ingredients, and growing disposable income that supports premium product adoption.
North American markets benefit from established biotechnology companies, supportive regulatory frameworks, and consumer demand for clean label products that drive bio vanillin adoption across food, pharmaceutical, and personal care applications. The region's market development is supported by companies like Borregaard, which has invested approximately USD 15 million to expand vanillin production capacity, and emerging players like Spero Renewables developing cost-competitive production methods from agricultural waste.
Asia-Pacific markets present significant growth opportunities despite current market share limitations, with increasing food processing activity, growing middle-class populations, and evolving consumer preferences for natural ingredients creating favorable long-term market dynamics. The geographic diversification reflects varying regulatory environments, consumer preferences, and industrial development levels that influence bio vanillin market penetration and growth strategies across different regions.
- Kerry Group plc
- Givaudan SA
- Solvay S.A.
- Symrise AG
- Archer-Daniels-Midland Company
- Borregaard AS
- Europabio
- Advanced Biotech
- BASF SE
- Camlin Fine Sciences Ltd
- International Flavors & Fragrances
- Biosynth Ltd
- Oamic Ingredients USA
- Takasago International Corporation
- Axxence Aromatic GmbH
- Evolva Holding SA
- Ennolys by Lesaffre
- Xi'an Healthful Biotechnology Co.,Ltd
- Jeneil Biotech
- Niranbio Chemical
Additional Benefits:
- The market estimate (ME) sheet in Excel format
- 3 months of analyst support
TABLE OF CONTENTS
1 INTRODUCTION
- 1.1 Study Assumption and Market Definition
- 1.2 Scope of the Study
2 RESEARCH METHODOLOGY
3 EXECUTIVE SUMMARY
4 MARKET LANDSCAPE
- 4.1 Market Overview
- 4.2 Market Drivers
- 4.2.1 Sustainability-driven demand from the food and beverage sector
- 4.2.2 Regulatory support for natural label claims
- 4.2.3 Growing consumer preference for plant-based and vegan products
- 4.2.4 Technological advancements in biotechnological production
- 4.2.5 Rising import tariffs on synthetic vanillin
- 4.2.6 Expansion of clean label trends in premium products
- 4.3 Market Restraints
- 4.3.1 High production cost
- 4.3.2 Lack of awareness in developing countries
- 4.3.3 Regulatory and labeling compliance costs
- 4.3.4 Competition from alternative natural flavorings
- 4.4 Supply Chain Analysis
- 4.5 Regulatory Outlook
- 4.6 Porter's Five Forces
- 4.6.1 Threat of New Entrants
- 4.6.2 Bargaining Power of Buyers/Consumers
- 4.6.3 Bargaining Power of Suppliers
- 4.6.4 Threat of Substitute Products
- 4.6.5 Intensity of Competitive Rivalry
5 MARKET SIZE AND GROWTH FORECASTS (VALUE)
- 5.1 By Form
- 5.1.1 Powder
- 5.1.2 Liquid
- 5.2 By Purity Grade
- 5.2.1 Food Grade
- 5.2.2 Pharma Grade
- 5.2.3 Fragrance Grade
- 5.3 By Application
- 5.3.1 Food and Beverages
- 5.3.1.1 Ice Cream
- 5.3.1.2 Baked Goods
- 5.3.1.3 Beverages
- 5.3.1.4 Chocolate & Confectionery
- 5.3.1.5 Other Food and Beverage Applications
- 5.3.2 Pharmaceutical
- 5.3.3 Fragrance and Personal Care
- 5.3.1 Food and Beverages
- 5.4 By Geography
- 5.4.1 North America
- 5.4.1.1 United States
- 5.4.1.2 Canada
- 5.4.1.3 Mexico
- 5.4.1.4 Rest of North America
- 5.4.2 South America
- 5.4.2.1 Brazil
- 5.4.2.2 Argentina
- 5.4.2.3 Rest of South America
- 5.4.3 Europe
- 5.4.3.1 United Kingdom
- 5.4.3.2 Germany
- 5.4.3.3 France
- 5.4.3.4 Italy
- 5.4.3.5 Russia
- 5.4.3.6 Rest of Europe
- 5.4.4 Asia-Pacific
- 5.4.4.1 China
- 5.4.4.2 India
- 5.4.4.3 Japan
- 5.4.4.4 Australia
- 5.4.4.5 Rest of Asia-Pacific
- 5.4.5 Middle East and Africa
- 5.4.5.1 Saudi Arabia
- 5.4.5.2 South Africa
- 5.4.5.3 Rest of Middle East and Africa
- 5.4.1 North America
6 COMPETITIVE LANDSCAPE
- 6.1 Strategic Moves
- 6.2 Market Ranking Analysis
- 6.3 Company Profiles (includes Global-level Overview, Market-level Overview, Core Segments, Financials (if available), Strategic Information, Market Rank/Share, Products and Services, Recent Developments)
- 6.3.1 Kerry Group plc
- 6.3.2 Givaudan SA
- 6.3.3 Solvay S.A.
- 6.3.4 Symrise AG
- 6.3.5 Archer-Daniels-Midland Company
- 6.3.6 Borregaard AS
- 6.3.7 Europabio
- 6.3.8 Advanced Biotech
- 6.3.9 BASF SE
- 6.3.10 Camlin Fine Sciences Ltd
- 6.3.11 International Flavors & Fragrances
- 6.3.12 Biosynth Ltd
- 6.3.13 Oamic Ingredients USA
- 6.3.14 Takasago International Corporation
- 6.3.15 Axxence Aromatic GmbH
- 6.3.16 Evolva Holding SA
- 6.3.17 Ennolys by Lesaffre
- 6.3.18 Xi'an Healthful Biotechnology Co.,Ltd
- 6.3.19 Jeneil Biotech
- 6.3.20 Niranbio Chemical
7 MARKET OPPORTUNITIES AND FUTURE OUTLOOK

 生物香草醛市場:依原料、形態、純度等級及應用分類-2026-2032年全球市場預測
 生物香草醛市場-全球產業規模、佔有率、趨勢、機會、預測:按應用、地區和競爭格局分類,2021-2031年
 生物香草醛市場報告:按原料、應用和地區分類(2026-2034 年)
 2026-2034年全球生物香草醛市場規模、佔有率、趨勢和成長分析報告
 生物香蘭素市場機會、成長要素、產業趨勢分析及2026年至2035年預測
 生物香草醛市場規模、佔有率及成長分析(按來源、應用及地區分類)-2026-2033年產業預測
 生物香草素市場規模、佔有率和趨勢分析報告:按最終用途、按地區、細分市場預測,2025-2030 年
 生物香草素市場報告:2030 年趨勢、預測與競爭分析