


 |
市場調查報告書
商品編碼
2072762
雲端碳足跡追蹤軟體:市場佔有率分析、產業趨勢與統計、成長預測(2026-2031)Cloud Carbon Footprint Tracking Software - Market Share Analysis, Industry Trends & Statistics, Growth Forecasts (2026 - 2031) |
||||||

※ 本網頁內容可能與最新版本有所差異。詳細情況請與我們聯繫。
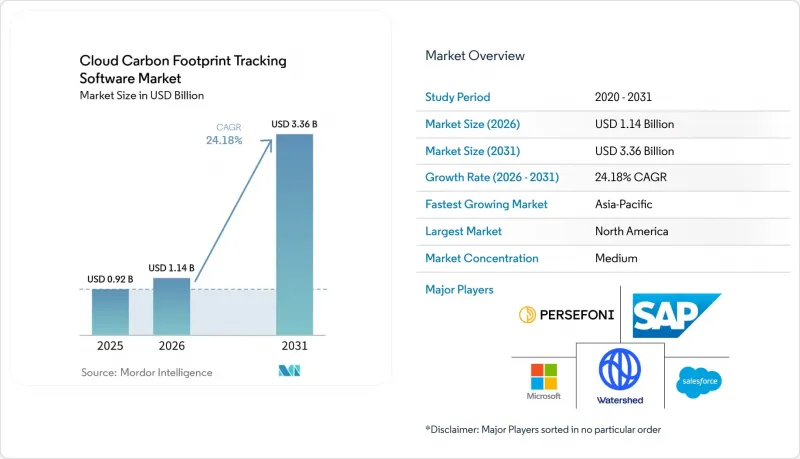
根據 Mordor Intelligence 預測,雲端碳足跡追蹤軟體市場規模預計將在 2025 年達到 9.2 億美元,2026 年達到 11.4 億美元,2031 年達到 33.6 億美元,2026 年至 2031 年的複合年成長率為 24.18%。
本報告按組件(平台和服務)、部署模式(雲端、本地部署、混合部署)、企業規模(例如中小企業)、應用程式(例如雲端基礎設施監控和最佳化)、最終用戶行業(例如工業製造、銀行、金融服務和保險業)以及地區進行細分。市場預測以美元計價。
全球雲碳足跡追蹤軟體市場趨勢及洞察
強制性永續發展報告加強了符合審計要求的排放管理。
雲端碳足跡追蹤軟體市場正受益於新的報告法規,這些法規現已強制要求企業提供其業務活動的可追溯排放數據。歐盟的《企業永續發展報告指令》(CSRD) 擴大了永續發展資訊揭露義務,並要求企業採用基於ESRS E1要求的更系統化的碳核算方法。 《溫室氣體會計系統》(GHG Protocol) 也明確規定了關鍵資訊揭露架構如何將既定的溫室氣體會計規則納入正式的報告要求,從而增加了對能夠集中管理方法、資訊來源和審計歷史的工具的需求。這項轉變對雲端碳足跡追蹤軟體市場有重大影響,因為雲端活動不再遊離於報告範圍之外,而是被納入可報告的範圍2和範圍3碳足跡。因此,企業正在尋求能夠直接從雲端提供者獲取數據、規範其調查方法選擇並產生外部審計團隊無需手動調整即可審查的證據的系統。這使得即時、可審計的排放管理成為購買時的首要任務,而不是事後作為報告附加元件。
擴大 FinOps 的應用範圍,以同時最佳化雲端成本和碳足跡。
雲端碳足跡追蹤軟體市場也受惠於FinOps團隊將工作範圍從支出管理擴展到排放視覺化。 FinOps基金會的一份報告顯示,到2025年,歐洲53%的FinOps團隊將追蹤其雲碳足跡,而北美僅為29%,這表明碳排放測量正在關鍵地區從小眾實踐轉變為常規營運任務。同一項研究發現,全球僅有3%的FinOps團隊基於碳排放最佳化資源,而基於成本的最佳化比例為15%,凸顯了軟體供應商利用碳排放數據進行主動工作負載決策的巨大空間。 Flexera在2026年的一項調查發現,近三分之一的受訪者認為成本最佳化和碳排放減少同等重要,這表明財務目標和永續發展目標正在同一營運工作流程中融合。 IBM Apptio透過將排放視覺化整合到已用於雲端成本管理的平台中,進一步鞏固了這一趨勢,並擴展了其在主要公共雲端上的雲端碳排放報告功能。因此,雲端碳足跡追蹤軟體市場正逐漸融入主流管治,買家要求從單一平台集中管理支出、利用率和排放,而不是為每個任務使用單獨的工具。
在異質雲和傳統環境中整合的複雜性
雲端碳足跡追蹤軟體市場持續面臨引進週期延遲的問題,尤其是在買家同時營運ERP、多重雲端和本地部署環境的情況下。這些專案通常需要多個獨立排放——一個用於計費和資源資料的整合基準、一個用於工作負載遙測的層以及一個用於管治和保障工作流程的層——才能建立可操作的排放基準。當企業需要在AWS、Microsoft Azure、Google Cloud以及並非為碳排放報告而設計的傳統基礎架構上取得統一的視圖時,這種負擔會進一步加重。雖然AWS在2026年從客戶碳足跡工具過渡到永續發展主機提升了原生報告功能的深度,但也迫使軟體供應商和企業用戶更新其地圖、工作流程和內部運算參考點。雲端碳足跡追蹤軟體市場部署週期延長可能會阻礙缺乏專門的財務營運工程師、資料團隊或永續發展系統負責人的中型企業採用此類軟體。因此,雖然實施支援服務的價值不斷提高,但對於優先考慮快速實現價值(價值實現時間)的供應商而言,透過「先佔領市場再擴張」的策略,也可能導致擴張速度放緩。
細分市場分析
到2025年,基於平台的軟體將佔據雲端碳足跡追蹤軟體市場69.85%的佔有率,這表明企業更傾向於整合系統而非功能有限的獨立解決方案。這項領先優勢反映了雲端碳足跡追蹤軟體市場清晰的採購模式:企業更傾向於在一個統一的環境中同時查看成本、排放和利用率。買家通常尋求可透過API連接的儀錶板,這些儀錶板能夠從雲端計費、工作負載編配和永續性報告層檢索數據,而無需繁瑣的手動核對。這種方法在大規模多重雲端環境中尤其具有吸引力,因為財務、平台和永續性團隊可以基於單一的營運記錄來進行工作。 IBM透過將能源和碳指標整合到資源最佳化工作流程中,進一步強化了這一方向,從而增強了將效率和永續性視為相互關聯的決策過程的軟體的吸引力。因此,基於平台的解決方案已成為大多數企業進入雲端碳足跡追蹤軟體市場的預設入口。
預計2026年至2031年間,服務市場將以25.12%的複合年成長率成長,即使平台採用率加速提升,服務層仍將維持其策略重要性。許多客戶在軟體部署能夠確保足夠的可靠性以向董事會提交報告之前,仍然需要資料映射、調查方法設計、保證準備以及跨混合環境整合的幫助。在基於雲端的碳足跡追蹤軟體產業,缺乏內部Kubernetes工程技能或成熟FinOps流程的買家尤其需要這種幫助。 SAP的2026年永續發展人工智慧代理藍圖建議實現模擬和報告任務的自動化,這可能會逐步將服務需求從重複性支援任務轉向更高附加價值的諮詢服務。儘管如此,由於保證要求有限而報告預期日益嚴格,服務需求仍然存在,許多公司在正式建立碳調查方法和內部控制時仍然尋求外部協助。這意味著,雖然平台收入仍然很重要,但雲端碳足跡追蹤軟體市場的業務收益可能仍將與部署品質和審計準備密切相關。
2025年,基於雲端的部署佔據了雲端碳足跡追蹤軟體市場66.74%的佔有率,這反映了該產品與其所測量環境的兼容性。雲端交付之所以在雲端碳足跡追蹤軟體市場中備受青睞,是因為其SaaS架構能夠快速連接到供應商API,集中更新方法論,並可在無需本地系統維護的情況下擴展分散式工作負載。此外,如果資訊揭露法規或供應商資料結構發生變化,供應商可以在雲端環境中更快地交付新的報告功能。 2026年AWS永續發展主機的更新進一步強化了這一趨勢,增強了程序化訪問,並將報告功能整合到供應商環境中。這確保了雲端部署仍然是尋求快速了解其整個雲端環境並長期實現標準化更新的買家最實用的模式。
混合部署預計到 2031 年將以 26.03% 的複合年成長率成長,成為雲碳足跡追蹤軟體市場中成長最快的模式。對於需要將集中式報告與遙測、帳單或營運資料的本地處理規則結合的客戶而言,這種成長尤其顯著。金融服務、醫療保健和公共機構等受監管行業通常需要這種平衡,因為資料居住規則限制了原始基礎設施資料傳輸的範圍。 IBM Turbonomic 在 AWS 聖保羅區域的可用性表明,供應商正在透過提供本地部署選項來滿足這些需求,這些選項既能滿足本地資料居住要求,又不犧牲雲端原生最佳化功能。本地部署在雲端碳足跡追蹤軟體市場中仍然發揮著重要作用,尤其對於對系統遙測資料擁有嚴格控制權的政府機構和關鍵基礎設施使用者而言更是如此。因此,當合規性規則與產品功能同等重要時,能夠靈活提供公共雲端、私有雲端和自主託管模式的供應商將更具優勢。
區域分析
2025年,北美繼續保持在該地區領先地位,佔據全球雲碳足跡追蹤軟體市場34.56%的佔有率。北美雲端碳足跡追蹤軟體市場受益於雲端原生企業的高度集中、成熟的財務營運(FinOps)團隊以及Kubernetes的早期應用。美國仍然是核心收入來源,因為其大型企業已經建立了可審計的排放管理工作流程,以滿足雲端營運和更廣泛的數位基礎設施的需求。加拿大透過更嚴格遵守全球永續發展報告規範來支援需求,而墨西哥則透過其出口相關供應鏈日益符合歐洲報告要求而提升了市場重要性。根據Flexera 2026年的調查,34%的北美受訪者正在追蹤其雲碳足跡,這表明該領域的應用已經超越了試點階段,儘管歐洲仍然領先。
歐洲仍然是雲碳足跡追蹤軟體市場監管最嚴格的地區,這導致主要雲密集型經濟體普遍出於合規性主導進行大量採購。該地區的需求主要受CSRD和ESRS E1法規的推動,這些法規提高了對可審計資料收集、一致的調查方法和跨職能報告工作流程的需求。亞太地區預計到2031年將以27.34%的複合年成長率成長,成為雲端碳足跡追蹤軟體市場成長最快的地區。亞太地區的成長與印度公共雲端使用量的增加、日本對資訊揭露期望的提高以及澳洲和其他區域市場永續發展報告運動的興起密切相關。此外,半導體生產、數位基礎設施投資以及人工智慧相關運算需求的成長也推動了該地區的強勁需求,使供應商能夠獲得廣泛的企業客戶和受監管買家。
儘管南美洲和中東及非洲仍處於起步階段,但雲端碳足跡追蹤軟體市場在這三個地區都呈現出更為清晰的進入機會。在南美,巴西憑藉其大規模的企業基礎和本地雲端服務的可用性,引領著雲端碳足跡追蹤軟體的普及,這使得受監管的客戶更容易獲得本地服務。 IBM Turbonomic 計畫於 2026 年進駐聖保羅,進一步推動了這一趨勢。中東的需求主要受政府主導的數位基礎設施策略以及大型企業(尤其是沙烏地阿拉伯和阿拉伯聯合大公國)的淨零排放措施的驅動。非洲仍處於起步階段,但隨著國際貿易關係和數位基礎設施建設的推進,對排放測量和報告的需求日益成長,其中南非和奈及利亞的重要性日益凸顯。
其他好處:
- Excel格式的市場預測(ME)表
- 3個月的分析師支持
目錄
第1章:引言
- 研究假設和市場定義
- 調查範圍
第2章:調查方法
第3章執行摘要
第4章 市場狀況
- 市場概覽
- 市場促進因素
- 擴大 FinOps 的應用範圍,以同時最佳化雲端成本和碳排放
- 電網碳排放強度 API 可實現即時工作負載部署。
- 雲端原生公司對 Kubernetes 原生自動化的需求
- 強制性永續發展報告加強了符合審計要求的排放管理。
- 多重雲端的擴展催生了對區域感知調度的需求。
- 人工智慧和GPU工作負載對彈性和能源效率的需求日益成長。
- 市場限制因素
- 異質雲端環境與傳統環境整合的複雜性
- 碳數據標準化的限制和預測準確性
- 主動採取碳排放意識強的延期政策可能會對工作負載造成效能風險。
- 資料居住要求和合規性限制了跨區域調度
- 產業價值鏈分析
- 監理情勢
- 技術展望
- 宏觀經濟因素對市場的影響
- 波特五力分析
第5章 市場規模與成長預測
- 按組件
- 平台
- 服務
- 部署模式
- 基於雲端的
- 現場
- 混合
- 按公司規模
- 大公司
- 小型企業
- 透過使用
- 雲端基礎設施監控與最佳化
- 永續發展報告與碳核算
- FinOps整合的碳管理
- 利用人工智慧/機器學習進行永續性最佳化
- 多重雲端排放管理
- 應用程式和工作負載的碳分析
- 按最終用戶行業分類
- 工業製造
- 能源公用事業
- BFSI
- 零售和消費品
- 資訊科技/通訊
- 醫療保健和生命科學
- 政府/公共部門
- 運輸/物流
- 其他終端用戶產業
- 按地區
- 北美洲
- 美國
- 加拿大
- 墨西哥
- 南美洲
- 巴西
- 阿根廷
- 其他南美國家
- 歐洲
- 德國
- 英國
- 法國
- 義大利
- 西班牙
- 俄羅斯
- 荷蘭
- 其他歐洲國家
- 亞太地區
- 中國
- 日本
- 印度
- 韓國
- 澳洲和紐西蘭
- 其他亞太國家
- 中東
- 沙烏地阿拉伯
- 阿拉伯聯合大公國
- 其他中東國家
- 非洲
- 南非
- 奈及利亞
- 其他非洲國家
- 北美洲
第6章 競爭情勢
- 市場集中度
- 策略趨勢
- 市佔率分析
- 公司簡介
- Cast AI
- Densify, Inc.
- GramLabs, Inc. d/b/a StormForge
- IBM Corporation
- Spot Software, Inc.
- Fairwinds, LLC
- Greenpixie Limited
- Electricity Maps SAS
- WattTime, Inc.
- EasyVirt SAS
- CloudBolt Software, Inc.
- Harness, Inc.
- Turbonomic, Inc.
- ProsperOps, Inc.
- Granulate Ltd.
- Manta, Inc.
- CAST AI Group, Inc.
- Kubecost, Inc.
- CloudZero, Inc.
- Replex GmbH
第7章 市場機會與未來展望
According to Mordor Intelligence, the cloud carbon footprint tracking software market size is projected to be USD 0.92 billion in 2025, USD 1.14 billion in 2026, and reach USD 3.36 billion by 2031, growing at a CAGR of 24.18% from 2026 to 2031.
This report is Segmented by Component (Platform and Services), Deployment Mode (Cloud-Based, On-Premises, and Hybrid), Enterprise Size (Small and Medium Enterprises, and More), Application (Cloud Infrastructure Monitoring and Optimization, and More), End-User Industry (Industrial Manufacturing, BFSI, and More), and Geography. The Market Forecasts are Provided in Terms of Value (USD).
Global Cloud Carbon Footprint Tracking Software Market Trends and Insights
Mandatory Sustainability Reporting Increasing Audit-Ready Emissions Controls
The cloud carbon footprint tracking software market is gaining direct support from mandatory reporting rules that now demand traceable emissions data for enterprise operations. The European Union's Corporate Sustainability Reporting Directive expanded sustainability disclosure obligations and pushed companies toward more structured carbon accounting under ESRS E1 requirements. The GHG Protocol also documented how major disclosure frameworks are integrating established greenhouse gas accounting rules into formal reporting requirements, which increases the need for tools that preserve method, source, and audit history in one place. For the cloud carbon footprint tracking software market, that shift matters because cloud activity now falls within reported Scope 2 and Scope 3 footprints rather than outside them. Enterprises, therefore, want systems that can pull cloud-provider data directly, lock methodology choices, and generate evidence that external assurance teams can review without manual reconstruction. This has made real-time, audit-ready emissions controls a purchasing priority rather than a later-stage reporting add-on.
Rising FinOps Adoption For Cloud Cost And Carbon Co-Optimization
The cloud carbon footprint tracking software market is also benefiting from FinOps teams broadening their remit from spend control to emissions visibility. The FinOps Foundation reported that 53% of European FinOps practices tracked cloud carbon in 2025, while North America remained at 29%, indicating that carbon measurement is moving from a niche practice to an operational routine in leading regions. The same survey showed that only 3% of global FinOps practices optimized resources based on carbon, compared with 15% based on cost, leaving a wide gap for software vendors to turn carbon data into active workload decisions. Flexera found in 2026 that for nearly one-third of respondents, cost optimization and reducing carbon emissions were equal priorities, suggesting that finance and sustainability goals are converging within the same operating workflows. IBM Apptio's expansion of cloud carbon emissions reporting across major public clouds reinforced that direction by embedding emissions visibility into a platform already used for cloud cost management. As a result, the cloud carbon footprint tracking software market is being pulled into mainstream infrastructure governance, where buyers want one control surface for spend, utilization, and emissions rather than separate tools for each task.
Integration Complexity Across Heterogeneous Cloud And Legacy Environments
The cloud carbon footprint tracking software market still faces slower rollout cycles when buyers operate across mixed ERP, multi-cloud, and on-premises environments. These projects often require one integration layer for billing and resource data, another for workload telemetry, and another for governance and assurance workflows before a usable emissions baseline can even be established. This burden increases further when companies need a single consolidated view across AWS, Microsoft Azure, Google Cloud, and legacy infrastructure that was never designed for carbon reporting. AWS's transition from the Customer Carbon Footprint Tool to the Sustainability console in 2026 improved native reporting depth, but it also forced software vendors and enterprise users to update mappings, workflows, and internal calculation references. In the cloud carbon footprint tracking software market, long deployment timelines can hold back mid-sized buyers that lack dedicated FinOps engineers, data teams, or sustainability systems staff. That keeps implementation services valuable, but it also slows land-and-expand adoption for vendors that depend on faster time-to-value.
Other drivers and restraints analyzed in the detailed report include:
- AI And GPU Workloads Increasing Elasticity And Energy Efficiency Needs
- Grid Carbon Intensity APIs Enabling Real-Time Workload Placement
- Limited Carbon Data Standardization And Forecast Accuracy
For complete list of drivers and restraints, kindly check the Table Of Contents.
Segment Analysis
Platform software held 69.85% of the cloud carbon footprint-tracking software market share in 2025, indicating that enterprises favored integrated systems over narrow point solutions. That lead reflects a clear buying pattern in the cloud carbon footprint tracking software market, where enterprises prefer one environment to view cost, emissions, and utilization together. Buyers usually want API-connected dashboards that can pull data from cloud billing, workload orchestration, and sustainability reporting layers without heavy manual reconciliation. This approach is especially attractive for large multi-cloud estates because finance, platform, and sustainability teams can work from a single operational record. IBM highlighted this direction by embedding energy and carbon metrics into resource-optimization workflows, thereby reinforcing the appeal of software that treats efficiency and sustainability as linked decisions. As a result, platform offerings have become the default entry point for most enterprise deployments in the cloud carbon footprint tracking software market.
Services are projected to expand at a 25.12% CAGR during 2026-2031, keeping the service layer strategically important even with strong platform adoption. Many customers still need help with data mapping, methodology design, assurance preparation, and integration across hybrid estates before a software deployment becomes reliable enough for board-level reporting. In the cloud carbon footprint tracking software industry, that need is especially visible among buyers that lack internal Kubernetes engineering skills or mature FinOps processes. SAP's 2026 sustainability AI agent roadmap points to some automation of simulation and reporting preparation tasks, which could gradually shift service demand away from repetitive support work and toward higher-value advisory work. Even so, limited assurance requirements and stricter reporting expectations continue to support service demand, as many enterprises still seek external support when formalizing carbon methodologies and internal controls. This means platform revenue remains larger, but services revenue is likely to stay deeply tied to adoption quality and audit readiness in the cloud carbon footprint tracking software market.
Cloud-based deployments accounted for 66.74% of the cloud carbon footprint-tracking software market in 2025, reflecting the natural fit between the product and the environment it measures. The cloud carbon footprint tracking software market favored cloud delivery because SaaS architectures can connect faster to provider APIs, update methods centrally, and scale across distributed workloads without local system maintenance. Vendors can also push new reporting features faster in cloud environments when disclosure rules or provider data structures change. AWS's Sustainability console shift in 2026 underscored that direction by strengthening programmatic access and consolidating reporting features within the provider environment. This keeps cloud deployment as the most practical model for buyers who want quick visibility across cloud estates and standardized updates over time.
Hybrid deployment is projected to grow at a 26.03% CAGR through 2031, making it the fastest-growing model in the cloud carbon footprint tracking software market. Growth is strongest where clients must combine centralized reporting with local processing rules for telemetry, billing detail, or operational data. Regulated sectors such as financial services, healthcare, and public institutions often need that balance because data residency rules limit how far raw infrastructure data can travel. IBM Turbonomic's availability in the AWS Sao Paulo region demonstrated how vendors are responding with in-country deployment options that preserve local residency without sacrificing cloud-native optimization capabilities. On-premises deployment still has a role in the cloud carbon footprint-tracking software market, especially for government and critical infrastructure users who maintain strict control over system telemetry. Vendors with flexible public cloud, private cloud, and sovereign-hosted models therefore hold an advantage when compliance rules are as important as product features.
Complete Report Scope:
- By Component
- Platform
- Services
- By Deployment Mode
- Cloud-Based
- On-Premises
- Hybrid
- By Enterprise Size
- Large Enterprises
- Small and Medium Enterprises
- By Application
- Cloud Infrastructure Monitoring and Optimization
- Sustainability Reporting and Carbon Accounting
- FinOps-Integrated Carbon Management
- AI/ML Sustainability Optimization
- Multi-Cloud Emissions Management
- Application and Workload Carbon Analytics
- By End-user Industry
- Industrial Manufacturing
- Energy and Utilities
- BFSI
- Retail and Consumer Goods
- IT and Telecom
- Healthcare and Life Sciences
- Government and Public Sector
- Transportation and Logistics
- Other End-user Industries
- By Geography
- North America
- United States
- Canada
- Mexico
- South America
- Brazil
- Argentina
- Rest of South America
- Europe
- Germany
- United Kingdom
- France
- Italy
- Spain
- Russia
- Netherlands
- Rest of Europe
- Asia-Pacific
- China
- Japan
- India
- South Korea
- Australia and New Zealand
- Rest of Asia-Pacific
- Middle East
- Saudi Arabia
- United Arab Emirates
- Rest of Middle East
- Africa
- South Africa
- Nigeria
- Rest of Africa
- North America
Geography Analysis
North America held 34.56% of the global cloud carbon footprint-tracking software market share in 2025, maintaining the region's lead. The cloud carbon footprint tracking software market in North America benefited from a high concentration of cloud-native enterprises, mature FinOps teams, and early adoption of Kubernetes. The United States remained the core revenue center because large enterprises there were already building auditable emissions workflows around cloud operations and broader digital infrastructure needs. Canada supported demand by aligning more closely with global sustainability reporting practices, while Mexico added relevance through export-linked supply chains that increasingly align with European reporting requirements. Flexera's 2026 results showed that 34% of North American respondents tracked their cloud carbon footprint, suggesting adoption had already moved beyond pilot use, even if Europe remained ahead.
Europe remained the most regulation-intensive region for the cloud carbon footprint tracking software market, and that kept compliance-led buying strong across major cloud-consuming economies. The region's demand was anchored by CSRD and ESRS E1, which increased the need for auditable data capture, methodological consistency, and cross-functional reporting workflows. Asia-Pacific is projected to grow at a 27.34% CAGR through 2031, making it the fastest-growing regional market for cloud carbon footprint tracking software. Growth in Asia-Pacific is tied to the expanding public cloud footprint in India, rising disclosure expectations in Japan, and wider sustainability reporting moves across Australia and other regional markets. The region also benefits from strong demand tied to semiconductor production, digital infrastructure investment, and AI-related compute growth, which gives vendors a broad mix of enterprise and regulated buyers.
South America, the Middle East, and Africa remain earlier-stage regions, but the cloud carbon footprint tracking software market is gaining clearer entry points across all 3. In South America, Brazil leads adoption because its large enterprise base and local cloud availability make in-country delivery more practical for regulated customers, a dynamic reinforced by IBM Turbonomic's Sao Paulo expansion in 2026. Middle East demand is supported by state-backed digital infrastructure strategies and net-zero commitments from large enterprises, especially in Saudi Arabia and the UAE. Africa is still at an early stage, but South Africa and Nigeria are beginning to matter, as international trade relationships and digital infrastructure build-outs are creating a stronger need for emissions measurement and reporting.
- Cast AI
- Densify, Inc.
- GramLabs, Inc. d/b/a StormForge
- IBM Corporation
- Spot Software, Inc.
- Fairwinds, LLC
- Greenpixie Limited
- Electricity Maps SAS
- WattTime, Inc.
- EasyVirt SAS
- CloudBolt Software, Inc.
- Harness, Inc.
- Turbonomic, Inc.
- ProsperOps, Inc.
- Granulate Ltd.
- Manta, Inc.
- CAST AI Group, Inc.
- Kubecost, Inc.
- CloudZero, Inc.
- Replex GmbH
Additional Benefits:
- The market estimate (ME) sheet in Excel format
- 3 months of analyst support
TABLE OF CONTENTS
1 INTRODUCTION
- 1.1 Study Assumptions and Market Definition
- 1.2 Scope of the Study
2 RESEARCH METHODOLOGY
3 EXECUTIVE SUMMARY
4 MARKET LANDSCAPE
- 4.1 Market Overview
- 4.2 Market Drivers
- 4.2.1 Rising FinOps Adoption for Cloud Cost and Carbon Co-Optimization
- 4.2.2 Grid Carbon Intensity APIs Enabling Real-Time Workload Placement
- 4.2.3 Kubernetes-Native Automation Demand Across Cloud-Native Enterprises
- 4.2.4 Mandatory Sustainability Reporting Increasing Audit-Ready Emissions Controls
- 4.2.5 Multi-Cloud Expansion Creating Region-Aware Scheduling Demand
- 4.2.6 AI and GPU Workloads Increasing Elasticity and Energy Efficiency Needs
- 4.3 Market Restraints
- 4.3.1 Integration Complexity Across Heterogeneous Cloud and Legacy Environments
- 4.3.2 Limited Carbon Data Standardization and Forecast Accuracy
- 4.3.3 Workload Performance Risk from Aggressive Carbon-Aware Deferral Policies
- 4.3.4 Data Residency and Compliance Constraints Restricting Cross-Region Scheduling
- 4.4 Industry Value-Chain Analysis
- 4.5 Regulatory Landscape
- 4.6 Technological Outlook
- 4.7 Impact of Macroeconomic Factors on the Market
- 4.8 Porter's Five Forces Analysis
- 4.8.1 Bargaining Power of Buyers
- 4.8.2 Bargaining Power of Suppliers
- 4.8.3 Threat of New Entrants
- 4.8.4 Threat of Substitutes
- 4.8.5 Intensity of Competitive Rivalry
5 MARKET SIZE AND GROWTH FORECASTS (VALUE)
- 5.1 By Component
- 5.1.1 Platform
- 5.1.2 Services
- 5.2 By Deployment Mode
- 5.2.1 Cloud-Based
- 5.2.2 On-Premises
- 5.2.3 Hybrid
- 5.3 By Enterprise Size
- 5.3.1 Large Enterprises
- 5.3.2 Small and Medium Enterprises
- 5.4 By Application
- 5.4.1 Cloud Infrastructure Monitoring and Optimization
- 5.4.2 Sustainability Reporting and Carbon Accounting
- 5.4.3 FinOps-Integrated Carbon Management
- 5.4.4 AI/ML Sustainability Optimization
- 5.4.5 Multi-Cloud Emissions Management
- 5.4.6 Application and Workload Carbon Analytics
- 5.5 By End-user Industry
- 5.5.1 Industrial Manufacturing
- 5.5.2 Energy and Utilities
- 5.5.3 BFSI
- 5.5.4 Retail and Consumer Goods
- 5.5.5 IT and Telecom
- 5.5.6 Healthcare and Life Sciences
- 5.5.7 Government and Public Sector
- 5.5.8 Transportation and Logistics
- 5.5.9 Other End-user Industries
- 5.6 By Geography
- 5.6.1 North America
- 5.6.1.1 United States
- 5.6.1.2 Canada
- 5.6.1.3 Mexico
- 5.6.2 South America
- 5.6.2.1 Brazil
- 5.6.2.2 Argentina
- 5.6.2.3 Rest of South America
- 5.6.3 Europe
- 5.6.3.1 Germany
- 5.6.3.2 United Kingdom
- 5.6.3.3 France
- 5.6.3.4 Italy
- 5.6.3.5 Spain
- 5.6.3.6 Russia
- 5.6.3.7 Netherlands
- 5.6.3.8 Rest of Europe
- 5.6.4 Asia-Pacific
- 5.6.4.1 China
- 5.6.4.2 Japan
- 5.6.4.3 India
- 5.6.4.4 South Korea
- 5.6.4.5 Australia and New Zealand
- 5.6.4.6 Rest of Asia-Pacific
- 5.6.5 Middle East
- 5.6.5.1 Saudi Arabia
- 5.6.5.2 United Arab Emirates
- 5.6.5.3 Rest of Middle East
- 5.6.6 Africa
- 5.6.6.1 South Africa
- 5.6.6.2 Nigeria
- 5.6.6.3 Rest of Africa
- 5.6.1 North America
6 COMPETITIVE LANDSCAPE
- 6.1 Market Concentration
- 6.2 Strategic Moves
- 6.3 Market Share Analysis
- 6.4 Company Profiles (includes Global Level Overview, Market Level Overview, Core Segments, Financials as available, Strategic Information, Market Rank/Share, Products and Services, Recent Developments)
- 6.4.1 Cast AI
- 6.4.2 Densify, Inc.
- 6.4.3 GramLabs, Inc. d/b/a StormForge
- 6.4.4 IBM Corporation
- 6.4.5 Spot Software, Inc.
- 6.4.6 Fairwinds, LLC
- 6.4.7 Greenpixie Limited
- 6.4.8 Electricity Maps SAS
- 6.4.9 WattTime, Inc.
- 6.4.10 EasyVirt SAS
- 6.4.11 CloudBolt Software, Inc.
- 6.4.12 Harness, Inc.
- 6.4.13 Turbonomic, Inc.
- 6.4.14 ProsperOps, Inc.
- 6.4.15 Granulate Ltd.
- 6.4.16 Manta, Inc.
- 6.4.17 CAST AI Group, Inc.
- 6.4.18 Kubecost, Inc.
- 6.4.19 CloudZero, Inc.
- 6.4.20 Replex GmbH
7 MARKET OPPORTUNITIES AND FUTURE OUTLOOK
- 7.1 White-Space and Unmet-Need Assessment

 碳管理軟體市場預測至2034年-全球分析(按組件、部署模式、功能、企業規模、訂閱模式、最終用戶和地區分類)
 酵素催化二氧化碳還原市場:全球產業分析、市場規模及佔有率和未來預測(2026-2033 年),按酵素類型、應用、技術、最終用戶、國家和地區分類工業脫碳軟體市場預測至2034年-按軟體類型、部署模式、技術、應用、最終用戶和地區分類的全球分析
 全球碳計量平台市場:市場規模、佔有率、趨勢和成長分析(2026-2034)
 碳中和運輸運輸解決方案市場分析及預測(至2035年):按類型、產品、服務、技術、組件、應用、部署模式、最終用戶和解決方案分類
 2026-2030年全球碳管理軟體市場
 永續發展軟體:市場佔有率分析、產業趨勢與統計、成長預測(2026-2031)工業碳捕集、利用與封存(CCUS)材料市場預測至2034年-全球分析(依材料類型、二氧化碳來源、服務模式、技術、應用、最終用戶及地區分類)農場級碳分析市場預測至2034年:按組件、部署形式、農場類型、技術、應用、最終用戶和地區分類的全球分析
 氣候與碳融資市場:依市場類型、專案類型、買方類型、碳機制、產業、交易類型和地區分類