


 |
市場調查報告書
商品編碼
2073369
行動配件:市場佔有率分析、產業趨勢與統計、成長預測(2026-2031)Mobile Accessories - Market Share Analysis, Industry Trends & Statistics, Growth Forecasts (2026 - 2031) |
||||||

※ 本網頁內容可能與最新版本有所差異。詳細情況請與我們聯繫。
根據 Mordor Intelligence 預測,行動配件市場規模預計在 2026 年達到 1,131.9 億美元,在 2031 年達到 1,647.8 億美元,預測期內複合年成長率為 7.8%。
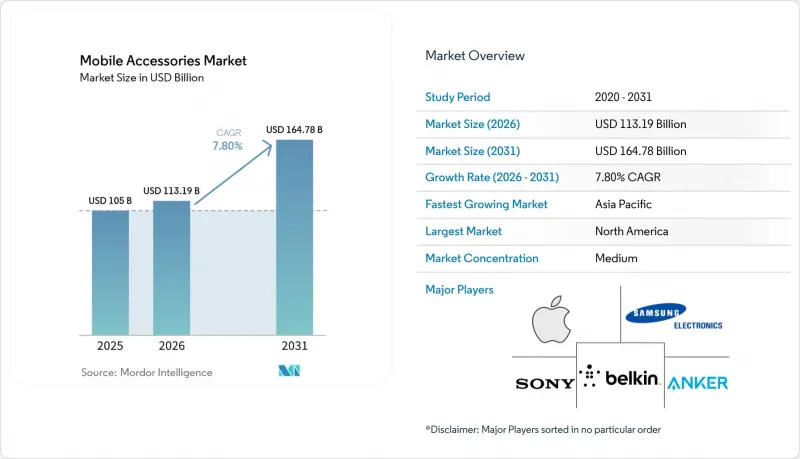
本報告按產品類型(耳機/耳塞、充電器、行動電源、保護殼等)、銷售管道(線上零售、線下零售等)、價格區間(低價位(20美元以下)、中價位(21-50美元)、高價位(51美元及以上))、適用設備(僅限/多安卓、僅限iOS、通用/多安卓平台)及地區進行通用設備(僅限/市場預測以美元計價。
全球行動配件市場趨勢及洞察
採用氮化鎵技術使得超緊湊型快速充電器的製造成為可能。
氮化鎵 (GaN) 裝置的開關頻率比矽元件高 10 倍,這使得設計人員能夠在支援高達 240W 的 USB Power Delivery 3.1 擴展功率範圍的同時,將磁性元件的尺寸縮小 40%。 Anker 將於 2024 年推出的「GaNPrime」電源轉接器,在比矽基同類產品小 30% 的體積內即可提供 150W 的功率,從而在捆綁式充電器市場佔據高階佔有率。 ITU L.1004互通性標準於 2024 年獲得批准,將認證成本降低了 20%,有助於製造商加快產品推廣到擁有多台設備的家庭用戶。輕巧的轉接器能夠讓旅客和航空公司透過單一插座為筆記型電腦、平板電腦和智慧型手機充電,因此備受青睞。此外,良率的提高使 GaN 產品的元件成本每年降低 15-18%,即使平均售價有所下降,也能維持利潤率。
在配件製造中引入永續材料
歐盟的《永續產品生態設計條例》將逐步要求到2027年,配件中必須使用25%的再生塑膠,這將迫使以再生塑膠為中心的供應鏈進行重新設計。蘋果的FineWoven MagSafe保護殼含有68%的再生材料,碳足跡減少了45%,但早期回饋顯示其耐用性有問題。 Peak Design於2024年獲得了美國公平貿易認證,將社會責任合規性置於價格敏感型產品類別的核心位置。年銷售額低於5000萬美元的品牌,其單件產品的測試成本是跨國公司的三倍,這使得大型公司擁有結構性優勢,並加速了線纜行業的重組,因為材料成分必須符合有害物質指令(RoHS)。
仿冒手機配件的氾濫
美國海關與邊防安全在2025年第一季查獲了價值2,070萬美元的假配件,其中62%是蘋果數據線和耳機的仿冒品。歐盟智慧財產局(EUIPO)估計,到2024年,歐盟成員國因仿冒品造成的銷售損失將達13億歐元(14.7億美元)。亞馬遜的「品牌註冊」服務將申訴率降低了25%,但其代價是每年5萬至20萬美元的監控費用,而這些費用最終都轉嫁給了品牌商。消費者對仿冒品的預期價格比正品低60%至70%,但合法企業正在將銷售轉移到自有網路管道,目前這些管道的銷售額佔總銷售額的35%至40%,因為他們將8%至12%的收入用於真偽驗證工具。
細分市場分析
到2025年,保護殼將佔據行動配件市場26.11%的佔有率,鞏固其作為購買設備後首選配件的地位。同時,無線充電器預計將以6.96%的複合年成長率成長,略低於行動配件市場的基準,這主要得益於Qi2「磁力功率配置」的普及。此配置將輸出功率從15W提升至25W,並透過確保線圈對齊,將能量損耗降低30%。耳機和耳塞將佔據第二大市場佔有率,這主要得益於TWS(真無線立體聲)功能的普及,該功能先前僅在高階機型上提供。
由於電池製造商優先發展電動車,移動電池的電芯供應難以提升,這阻礙了容量方面的創新。同時,螢幕保護貼和車載支架等低成長領域仍停滯不前。智慧型手錶錶帶正成為新的收入來源,因為穿戴式裝置的更換高於智慧型手機,相關品牌的毛利率高達 40% 至 60%。因此,品類趨勢呈現兩極化:一方面是規模經濟效益顯著的同質化保護和充電產品,另一方面是像 MagSafe 充電器這樣基於生態系統的產品,儘管技術差異不大,卻依然保持著高價。
預計到2025年,網路商店將佔銷售額的54.22%,年複合成長率達7.67%。品牌正努力擺脫實體店租金和人事費用的束縛,轉而追求數據和利潤率的提升。即使最終購買並非在亞馬遜完成,亞馬遜仍是最大的產品發現平台,經銷商也被迫接受15%至20%的佣金。實體店目前佔45.78%的市場佔有率,但客流量下降、租金飆升,每平方英尺的生產效率低於400美元。
隨著手機補貼減少,消費者開始單獨購買配件,業者自營門市的重要性正在下降。而品牌自營門市則成功地將展示室的吸引力與高階體驗結合,配件銷售額僅佔總銷售額的五分之一,卻貢獻了35%至40%的毛利。在新興市場,批發通路依然重要,但隨著品牌直接與Flipkart和Noon等平台合作,利潤率正受到擠壓。歐盟的《數位服務法案》(DSA)使平台的法律責任成本增加了12%至15%,同時,消費者對線上市場的信任度不斷提高,加速了高階自營網站銷售與以價格為導向的電商平台之間的管道分化。
區域分析
亞太地區在深圳工廠網路和印度總額達1.7億美元(約20.4億美元)的生產連結獎勵計畫的支持下,預計到2025年將佔全球市場佔有率的39.75%。這些激勵措施旨在促進零件生產的本地化。北美地區目前佔據28%的市場佔有率,但面臨行動電話產品生命週期延長和市場飽和的挑戰。儘管如此,知名品牌仍受益於小規模競爭對手無法企及的監管要求。歐洲目前約佔22%的市場佔有率正受到USB-C標準和電子廢棄物法規的影響而發生重組,這些法規對每台設備增加了0.11美元至0.57美元的費用,使那些進行內部回收的公司更具優勢。
中東市場雖然仍維持個位數成長,但得益於95%的智慧型手機普及率和「沙烏地阿拉伯2030願景」下5,000億美元的數位基礎設施投資,其複合年成長率已達7.77%。南美洲的成長僅限於個位數中段,主要受高達60%的進口關稅制約,但當地組裝正在推進,以利用南方共同市場的關稅優惠。在非洲,電網可靠性比品牌更為重要,因此市場關注的重點是太陽能儲能系統等電力連續性產品。
全部區域的市場前景呈現兩極化:成熟市場透過高階生態系統設備提升獲利能力,而新興經濟體則更青睞價格低於20美元的基礎產品。亞太地區仍將是銷售額的中心,隨著電子商務履約滲透到區域城市,中東和東南亞預計將迎來強勁成長。
其他好處:
- Excel格式的市場預測(ME)表
- 3個月的分析師支持
目錄
第1章:引言
- 研究假設和市場定義
- 調查範圍
第2章:調查方法
第3章執行摘要
第4章 市場狀況
- 市場概覽
- 市場促進因素
- 智慧型手機普及率提高
- 電子商務通路的拓展
- 無線音訊的廣泛應用
- 消費者在行動遊戲配件上的支出增加
- 採用氮化鎵技術實現超緊湊型快速充電器
- 在配件製造中引入永續材料
- 市場限制因素
- 假手機配件的普遍性和範圍
- 更換配件週期中的飽和度
- 對電子廢棄物的監管日益嚴格,導致合規成本不斷上升。
- 高容量行動電源用先進電池的供應受限
- 產業價值鏈分析
- 宏觀經濟因素對市場的影響
- 監理情勢
- 技術展望
- 波特五力分析
第5章 市場規模與成長預測
- 依產品類型
- 耳機/耳塞
- 充電器
- 行動電池
- 保護殼
- 螢幕保護貼
- 車用支架
- 自拍棒和雲台
- 智慧型手錶手錶錶帶
- 其他產品類型
- 按銷售管道
- 線上零售
- 線下零售
- 承運商商店
- 品牌自營店
- 批發商和經銷商
- 按價格範圍
- 價格較低(20美元以上)
- 中價位(21-50美元)
- 高價位(51美元以下)
- 相容型號
- 僅限安卓系統的配件
- 僅限 iOS 的配件
- 通用/多平台配件
- 按地區
- 北美洲
- 美國
- 加拿大
- 墨西哥
- 南美洲
- 巴西
- 阿根廷
- 其他南美國家
- 歐洲
- 德國
- 英國
- 法國
- 義大利
- 西班牙
- 俄羅斯
- 其他歐洲國家
- 亞太地區
- 中國
- 印度
- 日本
- 韓國
- 東南亞
- 其他亞太國家
- 中東
- 沙烏地阿拉伯
- 阿拉伯聯合大公國
- 土耳其
- 其他中東國家
- 非洲
- 南非
- 奈及利亞
- 肯亞
- 其他非洲國家
- 北美洲
第6章 競爭情勢
- 市場集中度
- 策略趨勢
- 市佔率分析
- 公司簡介
- Apple Inc.
- Samsung Electronics Co., Ltd.
- Sony Group Corporation
- Belkin International, Inc.
- Anker Innovations Ltd.
- Logitech International SA
- Western Digital Corporation
- Aukey Technology Co., Ltd.
- Bose Corporation
- Xiaomi Corporation
- Huawei Technologies Co., Ltd.
- BBK Electronics Corporation Ltd.
- ZAGG Inc.
- Otter Products LLC
- Skullcandy Inc.
- GN Audio A/S(Jabra)
- Plantronics, Inc.(Poly)
- Baseus Technology Co., Ltd.
- Ugreen Group Limited
- TP-Link Technology Co., Ltd.
第7章 市場機會與未來展望
According to Mordor Intelligence, the mobile accessories market size stands at USD 113.19 billion in 2026 and is projected to reach USD 164.78 billion in 2031, advancing at a 7.8% CAGR over the forecast period.
This report is Segmented by Product Type (Headphones/Earbuds, Chargers, Power Banks, Protective Cases, and More), Distribution Channel (Online Retail, Offline Retail, and More), Price Range (Low (Up To USD 20), Mid (USD 21-50), Premium (USD 51 and Above)), Compatibility (Android-Specific, IOS-Specific, and Universal/Multi-platform), and Geography. The Market Forecasts are Provided in Terms of Value (USD).
Global Mobile Accessories Market Trends and Insights
Adoption of GaN Technology Enabling Ultra-Compact Fast Chargers
Gallium-nitride devices switch at frequencies 10-times higher than silicon, allowing designers to shrink magnetic components by 40% while supporting USB Power Delivery 3.1 Extended Power Range up to 240 W. Anker's GaNPrime, launched in 2024, delivers 150 W in a brick 30% smaller than legacy silicon equivalents and captured premium share from bundled chargers. ITU's L.1004 interoperability standard, ratified in 2024, cut certification costs by 20%, helping makers pursue multi-device households. Travelers and airlines value lighter adapters that power laptops, tablets, and phones from one outlet, while yield gains are trimming GaN bill-of-materials by 15-18% per year, protecting margins even as average selling prices soften.
Integration of Sustainable Materials in Accessory Manufacturing
The European Union's Ecodesign for Sustainable Products Regulation phases in a 25% recycled-plastic requirement for accessories by 2027, forcing redesign of supply chains around post-consumer resin. Apple's FineWoven MagSafe case contains 68% recycled content and cuts carbon footprint 45%, yet feedback shows early durability compromises. Peak Design added Fair Trade USA labor certification in 2024, spotlighting social compliance in a price-sensitive category. Brands under USD 50 million sales face per-unit testing costs triple those of multinationals, granting scale players a structural edge and accelerating consolidation in cases and cables where composition dictates Restriction of Hazardous Substances compliance.
Prevalence of Counterfeit Mobile Accessories
US Customs and Border Protection seized USD 20.7 million in fake accessories in Q1 2025, 62% of which imitated Apple cables and earbuds. EUIPO estimates EUR 1.3 billion (USD 1.47 billion) in lost sales across member states in 2024. Amazon's Brand Registry cut complaint rates 25% yet shifted the USD 50 000-200 000 annual policing burden onto brands. Counterfeits anchor consumer price expectations 60-70% lower than genuine items, while legitimate firms divert 8-12% of revenue to authentication tools, nudging them toward owned-web channels where they now capture 35-40% of sales.
Other drivers and restraints analyzed in the detailed report include:
- Growing Adoption of Wireless Audio
- Increasing Smartphone Penetration
- Stricter E-waste Regulations Raising Compliance Costs
For complete list of drivers and restraints, kindly check the Table Of Contents.
Segment Analysis
Protective cases controlled 26.11% of the mobile accessories market share in 2025, confirming their role as the first add-on after a handset purchase. Wireless chargers, however, are projected to post a 6.96% CAGR that is slightly below the mobile accessories market size baseline, driven by Qi2's Magnetic Power Profile that lifts power from 15 W to 25 W and guarantees coil alignment, trimming energy loss 30%. Headphones and earbuds form the next-largest slice, propelled by TWS features once found only in premium models.
Power banks struggle with cell supply as battery makers prioritize electric vehicles, curbing high-capacity innovation, while screen protectors and car mounts plateau in low-growth territory. Smartwatch bands emerge as a fresh value pool because wearables refresh more often than phones, letting brands levy 40-60% gross margins. Category dynamics thus bifurcate into commoditized protection-and-charging goods where scale wins, versus ecosystem-anchored SKUs such as MagSafe chargers that sustain premium pricing despite limited technical gaps.
Online storefronts captured 54.22% of 2025 revenue and are slated for 7.67% CAGR as brands hunt data and margin by bypassing store rent and staffing costs. Amazon remains the top discovery venue even where final purchase occurs elsewhere, pressuring sellers to accept 15-20% commissions. Physical outlets, holding 45.78% share, fight falling foot traffic and rising rents that drag productivity below USD 400 per square foot.
Carrier shops lose relevance because device subsidies faded and consumers decouple accessory purchases. Brand-owned stores blend showroom flair with premium attachment, generating 35-40% of gross profit from accessories though they supply only a fifth of sales. In emerging markets, wholesale channels still matter but see margins squeezed as brands partner directly with platforms such as Flipkart and Noon. The EU Digital Services Act raised platform liability costs 12-15% yet boosted shopper trust online, accelerating channel polarization between premium owned-web sales and value-driven marketplaces.
Complete Report Scope:
- By Product Type
- Headphones / Earbuds
- Chargers
- Power Banks
- Protective Cases
- Screen Protectors
- Car Mounts
- Selfie Sticks and Gimbals
- Smartwatch Bands and Straps
- Other Product Types
- By Distribution Channel
- Online Retail
- Offline Retail
- Carrier Stores
- Brand-exclusive Stores
- Wholesale and Distributors
- By Price Range
- Low (Greater than or equal to USD 20)
- Mid (USD 21-50)
- Premium (Less than or equal USD 51)
- By Compatibility
- Android-specific Accessories
- iOS-specific Accessories
- Universal / Multi-platform Accessories
- By Geography
- North America
- United States
- Canada
- Mexico
- South America
- Brazil
- Argentina
- Rest of South America
- Europe
- Germany
- United Kingdom
- France
- Italy
- Spain
- Russia
- Rest of Europe
- Asia-Pacific
- China
- India
- Japan
- South Korea
- Southeast Asia
- Rest of Asia-Pacific
- Middle East
- Saudi Arabia
- United Arab Emirates
- Turkey
- Rest of Middle East
- Africa
- South Africa
- Nigeria
- Kenya
- Rest of Africa
- North America
Geography Analysis
Asia-Pacific contributed 39.75% of 2025 value, anchored by Shenzhen's factory network and India's INR 17 000 crore (USD 2.04 billion) production-linked incentives that localize component output. North America's 28% share faces lengthening handset cycles and category saturation, yet large brands benefit from regulatory demands that smaller rivals cannot meet. Europe's roughly 22% slice is reshaped by USB-C and e-waste rules that add USD 0.11-0.57 per unit in fees, favoring firms with in-house recycling.
The Middle East, though single-digit in size, is on track for a 7.77% CAGR as 95% smartphone penetration collides with USD 500 billion digital-infrastructure outlays under Saudi Vision 2030. South America grows mid-single-digits hindered by import duties up to 60%, triggering local assembly to tap Mercosur tariff breaks. Africa focuses on power continuity products like solar banks because grid reliability trumps brand.
Across regions, mature markets monetize through premium ecosystem gear, whereas emerging economies favor sub-USD 20 basics, creating a dual-speed outlook. Asia-Pacific will stay the volume hub while the Middle East and Southeast Asia capture outsized growth as e-commerce fulfillment penetrates secondary cities.
- Apple Inc.
- Samsung Electronics Co., Ltd.
- Sony Group Corporation
- Belkin International, Inc.
- Anker Innovations Ltd.
- Logitech International S.A.
- Western Digital Corporation
- Aukey Technology Co., Ltd.
- Bose Corporation
- Xiaomi Corporation
- Huawei Technologies Co., Ltd.
- BBK Electronics Corporation Ltd.
- ZAGG Inc.
- Otter Products LLC
- Skullcandy Inc.
- GN Audio A/S (Jabra)
- Plantronics, Inc. (Poly)
- Baseus Technology Co., Ltd.
- Ugreen Group Limited
- TP-Link Technology Co., Ltd.
Additional Benefits:
- The market estimate (ME) sheet in Excel format
- 3 months of analyst support
TABLE OF CONTENTS
1 INTRODUCTION
- 1.1 Study Assumptions and Market Definition
- 1.2 Scope of the Study
2 RESEARCH METHODOLOGY
3 EXECUTIVE SUMMARY
4 MARKET LANDSCAPE
- 4.1 Market Overview
- 4.2 Market Drivers
- 4.2.1 Increasing Smartphone Penetration
- 4.2.2 Expansion of E-commerce Channels
- 4.2.3 Growing Adoption of Wireless Audio
- 4.2.4 Rising Consumer Spending on Mobile Gaming Accessories
- 4.2.5 Adoption of GaN Technology Enabling Ultra-Compact Fast Chargers
- 4.2.6 Integration of Sustainable Materials in Accessory Manufacturing
- 4.3 Market Restraints
- 4.3.1 Prevalence of Counterfeit Mobile Accessories
- 4.3.2 Saturation in Replacement Accessory Cycles
- 4.3.3 Stricter E-waste Regulations Raising Compliance Costs
- 4.3.4 Supply Constraints in Advanced Battery Cells for High-Capacity Power Banks
- 4.4 Industry Value Chain Analysis
- 4.5 Impact of Macroeconomic Factors on the Market
- 4.6 Regulatory Landscape
- 4.7 Technological Outlook
- 4.8 Porter's Five Forces Analysis
- 4.8.1 Bargaining Power of Suppliers
- 4.8.2 Bargaining Power of Consumers
- 4.8.3 Threat of New Entrants
- 4.8.4 Threat of Substitute Products
- 4.8.5 Intensity of Competitive Rivalry
5 MARKET SIZE AND GROWTH FORECASTS (VALUE)
- 5.1 By Product Type
- 5.1.1 Headphones / Earbuds
- 5.1.2 Chargers
- 5.1.3 Power Banks
- 5.1.4 Protective Cases
- 5.1.5 Screen Protectors
- 5.1.6 Car Mounts
- 5.1.7 Selfie Sticks and Gimbals
- 5.1.8 Smartwatch Bands and Straps
- 5.1.9 Other Product Types
- 5.2 By Distribution Channel
- 5.2.1 Online Retail
- 5.2.2 Offline Retail
- 5.2.3 Carrier Stores
- 5.2.4 Brand-exclusive Stores
- 5.2.5 Wholesale and Distributors
- 5.3 By Price Range
- 5.3.1 Low (Greater than or equal to USD 20)
- 5.3.2 Mid (USD 21-50)
- 5.3.3 Premium (Less than or equal USD 51)
- 5.4 By Compatibility
- 5.4.1 Android-specific Accessories
- 5.4.2 iOS-specific Accessories
- 5.4.3 Universal / Multi-platform Accessories
- 5.5 By Geography
- 5.5.1 North America
- 5.5.1.1 United States
- 5.5.1.2 Canada
- 5.5.1.3 Mexico
- 5.5.2 South America
- 5.5.2.1 Brazil
- 5.5.2.2 Argentina
- 5.5.2.3 Rest of South America
- 5.5.3 Europe
- 5.5.3.1 Germany
- 5.5.3.2 United Kingdom
- 5.5.3.3 France
- 5.5.3.4 Italy
- 5.5.3.5 Spain
- 5.5.3.6 Russia
- 5.5.3.7 Rest of Europe
- 5.5.4 Asia-Pacific
- 5.5.4.1 China
- 5.5.4.2 India
- 5.5.4.3 Japan
- 5.5.4.4 South Korea
- 5.5.4.5 Southeast Asia
- 5.5.4.6 Rest of Asia-Pacific
- 5.5.5 Middle East
- 5.5.5.1 Saudi Arabia
- 5.5.5.2 United Arab Emirates
- 5.5.5.3 Turkey
- 5.5.5.4 Rest of Middle East
- 5.5.6 Africa
- 5.5.6.1 South Africa
- 5.5.6.2 Nigeria
- 5.5.6.3 Kenya
- 5.5.6.4 Rest of Africa
- 5.5.1 North America
6 COMPETITIVE LANDSCAPE
- 6.1 Market Concentration
- 6.2 Strategic Moves
- 6.3 Market Share Analysis
- 6.4 Company Profiles (includes Global Level Overview, Market Level Overview, Core Segments, Financials as Available, Strategic Information, Market Rank/Share for Key Companies, Products and Services, and Recent Developments)
- 6.4.1 Apple Inc.
- 6.4.2 Samsung Electronics Co., Ltd.
- 6.4.3 Sony Group Corporation
- 6.4.4 Belkin International, Inc.
- 6.4.5 Anker Innovations Ltd.
- 6.4.6 Logitech International S.A.
- 6.4.7 Western Digital Corporation
- 6.4.8 Aukey Technology Co., Ltd.
- 6.4.9 Bose Corporation
- 6.4.10 Xiaomi Corporation
- 6.4.11 Huawei Technologies Co., Ltd.
- 6.4.12 BBK Electronics Corporation Ltd.
- 6.4.13 ZAGG Inc.
- 6.4.14 Otter Products LLC
- 6.4.15 Skullcandy Inc.
- 6.4.16 GN Audio A/S (Jabra)
- 6.4.17 Plantronics, Inc. (Poly)
- 6.4.18 Baseus Technology Co., Ltd.
- 6.4.19 Ugreen Group Limited
- 6.4.20 TP-Link Technology Co., Ltd.
7 MARKET OPPORTUNITIES AND FUTURE OUTLOOK
- 7.1 White-Space and Unmet-Need Assessment

 全球行動電話光學鏡頭市場:機會與策略展望至2035年
 行動電話配件市場:2026-2032年全球市場預測(按產品類型、連接方式、相容性、製造商類型和分銷管道分類)
 行動電話揚聲器市場:按類型、產品類型和地區分類
 電動汽車電池外殼市場機會、成長要素、產業趨勢分析及2026-2035年預測行動電話配件市場:依產品類型、通路、最終用戶和地區分類。行動配件市場機會、成長要素、產業趨勢分析及2026-2035年預測
 穿戴式裝置及行動配件市場佔有率及預測:市場概覽(2026年第一季)
 全球相機背帶市場規模、佔有率、趨勢和成長分析報告(2026-2034年)穿戴式裝置和行動配件的市場佔有率和預測
 行動配件市場規模、佔有率和趨勢分析報告:按產品、銷售管道、地區和細分市場預測(2026-2033 年)