


 |
市場調查報告書
商品編碼
2073360
美國資料中心電力:市場佔有率分析、產業趨勢與統計及成長預測(2026-2031 年)United States Data Center Power - Market Share Analysis, Industry Trends & Statistics, Growth Forecasts (2026 - 2031) |
||||||

※ 本網頁內容可能與最新版本有所差異。詳細情況請與我們聯繫。
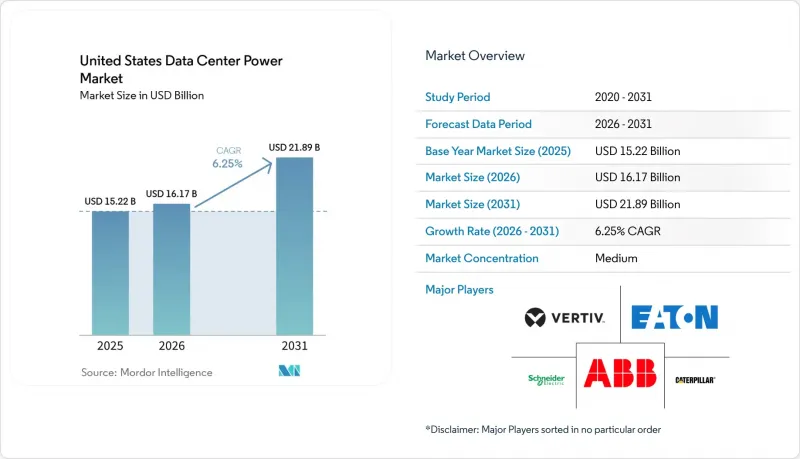
根據 Mordor Intelligence 預測,美國資料中心電力市場規模將從 2025 年的 152.2 億美元成長到 2026 年的 161.7 億美元,然後在 2031 年達到 218.9 億美元,2026 年至 2031 年的複合年成長率為 6.25%。
本報告按組件(電氣解決方案、服務)、資料中心類型(超大規模資料中心業者中心/雲端服務供應商、主機服務供應商等)、資料中心規模(小規模資料中心、中型資料中心、大型資料中心等)和等級(Tier I 和 II、Tier III、Tier IV)進行分類。市場預測以美元計價。
美國資料中心電力市場的趨勢與洞察
機架功率密度正在提高(20 kW/機架或更高正成為標準)。
功率超過 20 kW 的機架正在重塑整個美國資料中心電力市場的電源拓撲。隨著人工智慧部署的機架功率已超過 100 kW,對具備精細計量功能的高電流資料中心機架式 PDU 的需求日益成長,這些 PDU 允許營運商對電源輸出進行微調。直接晶片冷卻 (DTC) 和浸沒式冷卻技術的應用,迫使設計人員轉向採用母線槽系統和遠端電源面板,這些系統和麵板旨在降低電壓降並最大限度地減少發熱量。這些高密度架構壓縮了實體面積,使超大規模業者能夠從每平方英尺的空間中提取更多的運算能力。將智慧配電與即時熱狀態分析相結合的供應商正在獲得優勢。隨著密度的增加,電氣工程師擴大指定使用中壓電源,以減少銅線損耗並確保未來人工智慧加速器所需的功率餘裕,這凸顯了正在進行的結構性變革。
快速過渡到節能高效且成本最佳化的設施
在成本壓力和永續性目標的驅動下,營運商正致力於提升電源使用效率 (PUE) 並降低生命週期成本,效率仍然是美國資料中心電力市場討論的核心。託管服務提供者的利潤率取決於電力採購成本,因此他們迅速採用模組化、尺寸合適的電源模組,以消除閒置容量。具備插座級監控功能的智慧電源分配單元 (PDU) 支援預測性維護和基於使用量的收費模式。財務長們正以 15 年的長期觀點追蹤其整個資產組合的總擁有成本 (TCO),能夠量化能源和維護成本降低影響的供應商比競爭對手獲得更多收入。環境因素也進一步影響競標標準,加速了採購檢驗碳排放設備的趨勢。
電價波動正在擠壓整個美國資料中心電力市場的利潤空間,尤其是在尖峰時段需求激增的一級都會大都會圈。託管協議通常會將客戶電價固定多年,這使得供應商在批發電力成本飆升時面臨風險。在維吉尼亞北部,堵塞費加劇了這個問題,因為電力公司限制新增負荷,迫使開發商安裝成本高昂的現場變電站。營運商正透過固定價格購電協議和利用尖峰時段電價差異進行套利的現場儲能系統來對沖風險。金融市場的不確定性正推動企業向擁有過剩發電能力和更優惠收費系統的次市場擴張。提供金融級整合績效分析的供應商正在幫助客戶在多種定價情境下評估投資報酬率,從而增強客戶即使在市場波動的情況下也能做出明智採購決策的信心。
細分市場分析
到 2025 年,UPS 系統將佔據最大的收入佔有率,占美國資料中心電力市場的 36.04%。長壽命、緊湊型鋰離子面積如今已成為新部署的主流,減少了維護次數,並釋放了寶貴的閒置頻段。 Galaxy VXL 平台展示如何透過小型化設計在不維修機櫃結構的情況下提高機櫃密度。智慧電池管理延長了電池循環壽命,並提供先進的預測性維護引擎所使用的信息,從而確保 AI 工作負載所需的運作。併網韌體使設施能夠提供頻率調節和備轉容量服務,進一步提升了該領域的收入,將原本的成本中心轉變為收入來源。
電源分配單元 (PDU) 是成長最快的產品線,預計到 2031 年將以 6.05% 的複合年成長率成長。超高密度機架需要額定電流超過 100 A/經銷店的 PDU,這就要求 PDU 具備分支級測量功能,能夠即時報告溫度、負載和諧波。軟體定義的插座切換功能支援動態功率限制,並能保護饋線電路免受級聯過載的影響。
託管服務供應商利用規模經濟優勢,並在大都會圈區實現低延遲,預計到 2025 年將佔 45.10% 的收入佔有率。電力可靠性仍然是其核心競爭力,每個資料中心都強調其亞毫秒級的切換時間和銷售週期內低於 1.4 的平均 PUE 值。然而,不斷上漲的能源成本正在擠壓利潤空間,迫使託管營運商部署高效的 UPS 模組,並在符合分區法規的情況下,將廢熱回收利用到相鄰建築中。這些策略引起了面臨減少範圍 2排放壓力的企業租戶的共鳴,從而增強了託管服務的價值提案。
超大規模資料中心和雲端服務供應商正以 8.05% 的複合年成長率快速擴張,它們正在建造數吉瓦級的園區,這正在重塑電力公司的規劃週期。巨型設施的設計指南要求每個 16 兆瓦的建築模組配備 N+1 組電池組,並結合現場燃氣渦輪機或燃料電池,以確保 48 小時的自主運作。
其他好處:
- Excel格式的市場預測(ME)表
- 3個月的分析師支持
目錄
第1章:引言
- 研究假設和市場定義
- 調查範圍
第2章:調查方法
第3章執行摘要
第4章 市場狀況
- 市場概覽
- 市場促進因素
- 提高每個機架的功率密度(20 kW/機架或更高正成為標準)
- 快速過渡到節能高效且成本最佳化的設施
- 在連接佛羅裡達州、維吉尼亞和德克薩斯州。
- 聯邦和州政府為綠色電力基礎設施提供稅收優惠
- 引入現場微電網/燃料電池,為應對停電做好準備。
- 來自併網型UPS系統的需量反應收入
- 市場限制因素
- IT設備的更換週期超過了電力設備投資的回收期。
- 電力價格波動加劇和電網擁塞費用上漲
- 對鋰離子UPS電池材料中PFAS相關材料的監管審查
- 主要都會區發電廠許可證審核延誤
- 供應鏈分析
- 監理情勢
- 技術展望
- 波特五力分析
- 對與市場相關的宏觀經濟趨勢進行評估
第5章 市場規模與成長預測
- 按組件
- 電氣解決方案
- UPS系統
- 發電機
- 柴油發電機
- 瓦斯發電機
- 氫燃料電池發電機
- 配電單元
- 切換裝置
- 傳輸開關
- 遠端電源面板
- 能源儲存系統
- 服務
- 安裝和試運行
- 維護和支援
- 培訓和諮詢
- 電氣解決方案
- 依資料中心類型
- 超大規模資料中心業者雲端服務供應商/雲端服務供應商
- 託管服務提供者
- 企業和邊緣資料中心
- 按資料中心規模
- 小規模資料中心
- 中型資料中心
- 大型資料中心
- 超大型資料中心
- 超大型資料中心
- 等級
- 一級和二級
- Tier III
- Tier IV
第6章 競爭情勢
- 市場集中度
- 策略趨勢
- 市佔率分析
- 公司簡介
- ABB Ltd
- Schneider Electric SE
- Vertiv Holdings Co
- Eaton Corp plc
- Caterpillar Inc
- Cummins Inc
- Generac Power Systems
- Mitsubishi Electric Corp
- Delta Electronics Inc
- Cisco Systems Inc
- Hewlett Packard Enterprise
- Rittal GmbH and Co KG
- Legrand SA
- Leviton Mfg Co Inc
- Cyber Power Systems(USA)Inc
- Piller Power Systems
- Kohler Power Systems
- Bloom Energy Corp
- RESA Power LLC
- Raritan Inc
- Fujitsu Ltd
第7章 市場機會與未來展望
According to Mordor Intelligence, the united states data center power market size is expected to grow from USD 15.22 billion in 2025 to USD 16.17 billion in 2026 and is forecast to reach USD 21.89 billion by 2031 at 6.25% CAGR over 2026-2031.
This report is Segmented by Component (Electrical Solutions, Services), Data Center Type (Hyperscaler/Cloud Service Providers, Colocation Providers, and More), Data Center Size (Small Size Data Centers, Medium Size Data Centers, Large Size Data Centers and More), Tier Type (Tier I and II, Tier III, Tier IV). The Market Forecasts are Provided in Terms of Value (USD)
United States Data Center Power Market Trends and Insights
Growing rack-power density (>= 20 kW/rack becoming mainstream)
Racks surpassing 20 kW are redefining power topologies across the United States data center power market. AI-focused deployments already exceed 100 kW per rack, driving demand for high-amperage data center rack PDUs with granular metering that help operators fine-tune energy delivery. Adoption of direct-to-chip and immersion cooling pushes designers toward busway systems and remote power panels engineered for low voltage drop and minimal heat. These high-density architectures compress physical footprints, enabling hyperscale operators to extract more compute per square foot. Vendors that couple intelligent distribution with real-time thermal insight are gaining an edge. As densities climb, electrical engineers increasingly specify medium-voltage feeds to mitigate copper losses and retain headroom for future AI accelerators, underscoring the structural shift now underway.
Rapid shift to energy-efficient & cost-optimized facilities
Cost pressure and sustainability goals propel operators to chase PUE gains and lifecycle savings, keeping efficiency at the center of the United States data center power market conversation. Colocation providers, where power buys dictate margins, are early adopters of modular, right-sized power blocks that eliminate stranded capacity. Intelligent PDUs with outlet-level monitoring support predictive maintenance and usage-based billing models. Across portfolios, CFOs track total cost of ownership over a 15-year horizon; suppliers that quantify energy and maintenance savings are outselling peers. Green credentials further tip bidding criteria, moving procurement toward equipment with verifiable carbon reductions.
Swinging tariffs tighten margins across the United States data center power market, particularly in Tier 1 metros where demand charges spike during peak conditions. Colocation contracts often lock customer rates for multi-year terms, leaving providers exposed when wholesale power costs surge. In Northern Virginia, congestion fees compound the problem as utilities ration new load, forcing developers into costly on-site substations.Operators hedge with fixed-rate power purchase agreements and onsite battery storage that arbitrages peak differentials. Financial unpredictability steers expansion toward secondary markets boasting surplus generation and friendlier tariff structures. Vendors that offer integrated financial-grade performance analytics help clients benchmark ROI under multiple rate scenarios, bolstering purchase confidence amid volatility.
Other drivers and restraints analyzed in the detailed report include:
- Hyperscale build-out across the FL-VA-TX "data-center corridor"
- Federal & state tax incentives for green power infrastructure
- IT refresh cycles outpacing electrical-plant payback periods
For complete list of drivers and restraints, kindly check the Table Of Contents.
Segment Analysis
UPS systems generated the largest revenue slice in 2025, accounting for 36.04% of the United States data center power market. Lithium-ion chemistries with longer lifespans and smaller footprints now dominate new deployments, cutting maintenance visits and unlocking valuable white space. The Galaxy VXL platform illustrates how form-factor reductions enable higher cabinet densities without structural retrofits. Intelligent battery management enhances cycle life and provides state-of-health insights that feed predictive maintenance engines, securing uptime commitments demanded by AI workloads. Segment revenue is further buoyed by grid-interactive firmware that lets facilities provide frequency-regulation or spinning-reserve services, converting a pure cost center into a profit lever.
Power distribution units (PDUs) are the fastest-growing component line, set to post a 6.05% CAGR through 2031. Ultra-high-density racks require PDUs rated beyond 100 A per whip, with branch-level metering that reports temperature, load, and harmonics in real time. Software-definable outlet switching supports dynamic power capping, protecting feeder circuits from cascading overload.
Colocation providers captured 45.10% of 2025 revenue, leveraging scale economics to deliver low latency across metropolitan footprints. Power reliability acts as a core differentiator; facilities tout sub-2 ms transfer times and sub-1.4 PUE averages during sales cycles. Rising energy costs, however, squeeze profit margins, compelling colos to deploy high-efficiency UPS blocks and reclaim waste heat for adjacent buildings where zoning permits. These strategies resonate with enterprise tenants under pressure to report Scope 2 emissions reductions, reinforcing colo value propositions.
Hyperscale and cloud service providers, expanding at an 8.05% CAGR, build multigigawatt campuses that reorder utility planning horizons. Mega-facility design guides call for N+1 battery strings at building-block increments of 16 MW, coupled with on-site gas turbines or fuel cells that guarantee 48-hour autonomy.
Complete Report Scope:
- By Component
- Electrical Solutions
- UPS Systems
- Generators
- Diesel Generators
- Gas Generators
- Hydrogen Fuel-cell Generators
- Power Distribution Units
- Switchgear
- Transfer Switches
- Remote Power Panels
- Energy-storage Systems
- Service
- Installation and Commissioning
- Maintenance and Support
- Training and Consulting
- Electrical Solutions
- By Data Center Type
- Hyperscaler/Cloud Service Providers
- Colocation Providers
- Enterprise and Edge Data Center
- By Data Center Size
- Small Size Data Centers
- Medium Size Data Centers
- Large Size Data Centers
- Massive Size Data Centers
- Mega Size Data Centers
- By Tier Level
- Tier I and II
- Tier III
- Tier IV
List of Companies Covered in this Report:
- ABB Ltd
- Schneider Electric SE
- Vertiv Holdings Co
- Eaton Corp plc
- Caterpillar Inc
- Cummins Inc
- Generac Power Systems
- Mitsubishi Electric Corp
- Delta Electronics Inc
- Cisco Systems Inc
- Hewlett Packard Enterprise
- Rittal GmbH and Co KG
- Legrand SA
- Leviton Mfg Co Inc
- Cyber Power Systems (USA) Inc
- Piller Power Systems
- Kohler Power Systems
- Bloom Energy Corp
- RESA Power LLC
- Raritan Inc
- Fujitsu Ltd
Additional Benefits:
- The market estimate (ME) sheet in Excel format
- 3 months of analyst support
TABLE OF CONTENTS
1 INTRODUCTION
- 1.1 Study Assumptions and Market Definition
- 1.2 Scope of the Study
2 RESEARCH METHODOLOGY
3 EXECUTIVE SUMMARY
4 MARKET LANDSCAPE
- 4.1 Market Overview
- 4.2 Market Drivers
- 4.2.1 Growing rack-power density (greater than 20 kW/rack becoming mainstream)
- 4.2.2 Rapid shift to energy-efficient and cost-optimized facilities
- 4.2.3 Hyperscale build-out across FL-VA-TX data-center corridor
- 4.2.4 Federal and state tax incentives for green power infrastructure
- 4.2.5 On-site micro-grid / fuel-cell adoption to hedge grid outages
- 4.2.6 Demand-response revenues via grid-interactive UPS fleets
- 4.3 Market Restraints
- 4.3.1 IT refresh cycles outpacing electrical-plant payback periods
- 4.3.2 Rising utility-rate volatility and grid-congestion charges
- 4.3.3 PFAS-related regulatory scrutiny on lithium-ion UPS chemistries
- 4.3.4 Generator permitting delays in Tier 1 metro areas
- 4.4 Supply-Chain Analysis
- 4.5 Regulatory Landscape
- 4.6 Technological Outlook
- 4.7 Porter's Five Forces Analysis
- 4.7.1 Threat of New Entrants
- 4.7.2 Bargaining Power of Buyers
- 4.7.3 Bargaining Power of Suppliers
- 4.7.4 Threat of Substitutes
- 4.7.5 Intensity of Competitive Rivalry
- 4.8 Assesment of Macroeconomic Trends on the Market
5 MARKET SIZE and GROWTH FORECASTS (VALUE)
- 5.1 By Component
- 5.1.1 Electrical Solutions
- 5.1.1.1 UPS Systems
- 5.1.1.2 Generators
- 5.1.1.2.1 Diesel Generators
- 5.1.1.2.2 Gas Generators
- 5.1.1.2.3 Hydrogen Fuel-cell Generators
- 5.1.1.3 Power Distribution Units
- 5.1.1.4 Switchgear
- 5.1.1.5 Transfer Switches
- 5.1.1.6 Remote Power Panels
- 5.1.1.7 Energy-storage Systems
- 5.1.2 Service
- 5.1.2.1 Installation and Commissioning
- 5.1.2.2 Maintenance and Support
- 5.1.2.3 Training and Consulting
- 5.1.1 Electrical Solutions
- 5.2 By Data Center Type
- 5.2.1 Hyperscaler/Cloud Service Providers
- 5.2.2 Colocation Providers
- 5.2.3 Enterprise and Edge Data Center
- 5.3 By Data Center Size
- 5.3.1 Small Size Data Centers
- 5.3.2 Medium Size Data Centers
- 5.3.3 Large Size Data Centers
- 5.3.4 Massive Size Data Centers
- 5.3.5 Mega Size Data Centers
- 5.4 By Tier Level
- 5.4.1 Tier I and II
- 5.4.2 Tier III
- 5.4.3 Tier IV
6 COMPETITIVE LANDSCAPE
- 6.1 Market Concentration
- 6.2 Strategic Moves
- 6.3 Market Share Analysis
- 6.4 Company Profiles (includes Global level Overview, Market level overview, Core Segments, Financials as available, Strategic Information, Market Rank/Share for key companies, Products & Services, and Recent Developments)
- 6.4.1 ABB Ltd
- 6.4.2 Schneider Electric SE
- 6.4.3 Vertiv Holdings Co
- 6.4.4 Eaton Corp plc
- 6.4.5 Caterpillar Inc
- 6.4.6 Cummins Inc
- 6.4.7 Generac Power Systems
- 6.4.8 Mitsubishi Electric Corp
- 6.4.9 Delta Electronics Inc
- 6.4.10 Cisco Systems Inc
- 6.4.11 Hewlett Packard Enterprise
- 6.4.12 Rittal GmbH and Co KG
- 6.4.13 Legrand SA
- 6.4.14 Leviton Mfg Co Inc
- 6.4.15 Cyber Power Systems (USA) Inc
- 6.4.16 Piller Power Systems
- 6.4.17 Kohler Power Systems
- 6.4.18 Bloom Energy Corp
- 6.4.19 RESA Power LLC
- 6.4.20 Raritan Inc
- 6.4.21 Fujitsu Ltd
7 MARKET OPPORTUNITIES and FUTURE OUTLOOK
- 7.1 White-space and Unmet-Need Assessment

 資料中心電力基礎設施市場預測至 2034 年—按基礎設施組件、資料中心層級、額定功率、電力架構、最終用戶和地區分類的全球分析
 全球資料中心電力市場:機會與策略展望(至2035年)
 全球資料中心電力基礎設施市場規模、佔有率、趨勢和成長分析報告(2026-2034年)
 資料中心電源市場:按組件類型、層級類型、資料中心類型和產業分類-2026-2032年全球市場預測
 亞太地區資料中心電力市場:市場佔有率分析、產業趨勢與統計及成長預測(2026-2031年)
 資料中心電力基礎設施市場機會、成長促進因素、產業趨勢分析及2026-2035年預測
 資料中心電源市場:按組件、最終用戶、資料中心規模、產業和地區分類
 資料中心電源市場分析及預測(至2035年):類型、產品類型、服務、技術、組件、應用、部署模式、最終用戶、解決方案、交付模式2026年全球資料中心電源管理市場報告伺服器電源市場:依產品類型、組件、額定功率、外形規格、應用、最終用戶和通路分類-2026-2030年全球預測