


 |
市場調查報告書
商品編碼
2073296
負責人薪酬管理軟體:市佔率分析、產業趨勢與統計及成長預測(2026-2031 年)Executive Compensation Software - Market Share Analysis, Industry Trends & Statistics, Growth Forecasts (2026 - 2031) |
||||||

※ 本網頁內容可能與最新版本有所差異。詳細情況請與我們聯繫。
實施的複雜性仍然是負責人薪酬管理軟體市場面臨的主要障礙。
對於首次從電子表格遷移到功能齊全的平台的用戶而言,這一點尤其重要。此類實施通常需要與人力資源資訊系統 (HRIS)、薪資核算系統、企業資源計劃 (ERP) 和股權激勵系統緊密整合,其工作範圍不僅限於技術配置,還包括設計核准流程、建立職位架構、設定安全權限以及管理變更。實際上,企業還需要協調分散在多個來源系統中的薪酬數據,這會增加額外的時間和服務成本,平台才能可靠地支援計劃和報告。對於中小企業和首次實施負責人薪酬管理軟體的公司而言,這項負擔更為沉重,因為這些公司通常缺乏能夠建構必要基礎架構的內部 IT負責人和薪酬管理專家。到 2031 年,服務業 10.42% 的複合年成長率 (CAGR) 不僅反映了對配置、整合和支援的需求,也顯示引進意願往往強於實際實施準備。
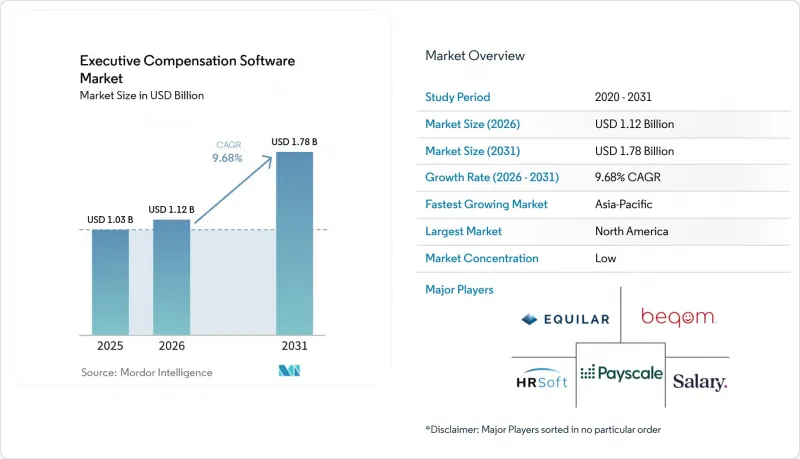
根據Mordor Intelligence預測,到2025年,負責人薪酬管理軟體市場規模將達10.3億美元。該報告按組件(軟體和服務)、部署模式(雲端等)、企業規模(大型企業和中小企業)、最終用戶行業(銀行、金融服務和保險、IT和電信、醫療保健和生命科學、零售和電子商務、工業製造、政府和公共部門等)以及地區進行細分。市場預測以美元計價。
全球負責人薪酬管理軟體市場趨勢與洞察
擴大薪酬透明度和公平性方面的監管
薪酬透明度法規已不再只是自願行為,而是成為負責人薪酬管理軟體市場中許多雇主必不可少的營運要求。截至2026年,美國已有16個州和華盛頓特區強制要求在招聘廣告中披露薪資範圍,而2025年陸續頒布的更多州法律也使得更多雇主需要在整個招聘和薪酬管理流程中維護最新的薪資範圍數據。歐盟的《工資透明指令》要求各國在2026年6月7日前將其納入本國法律,並從2027年起要求擁有250名或以上員工的雇主使用2026年的基準數據進行年度報告。這促使軟體部署計劃提前實施,企業選擇在今年完成部署,而不是等到未來的合規期。這改變了負責人薪酬管理軟體市場的採購標準,因為雇主現在需要集中式記錄、基於角色的存取權限以及在薪酬審查期間提供證據來支援薪酬決策。跨國公司也面臨連鎖反應。僅在受影響的某個地點進行更改,就可能需要對整個共用薪酬系統進行更廣泛的政策和數據調整。因此,監管變化現在鼓勵使用持續性平台,而不是一次性的合規成本。
從以電子表格主導的規劃過渡到可審計的管治
董事會和薪酬委員會對負責人薪酬工作流程採用不同的標準,這導致負責人薪酬管理軟體市場的發展不再局限於提高生產力。雖然基於電子表格的規劃在處理有限的年度任務時仍然有效,但當需要多階段核准、版本歷史記錄、異常追蹤以及證明政策合規性的證據時,其局限性就顯而易見了。 Silae 對 670 萬份薪資單進行的 2026 年分析顯示,負責人薪資的平均差距為 13.37%。在金融和保險業,這一差距超過 45%,並且隨著職業生涯的進展而迅速擴大,這表明如果沒有結構化數據,就很難發現結構性差異。 beqom 的一份報告指出,38% 的歐洲公司認為他們目前的系統不足以滿足即將訂定的歐盟要求,這表明企業在合規準備方面存在差距,而不僅僅是表面上的合規意識問題。負責人薪酬管理軟體市場正受益於此轉變,因為在雇主選擇平台時,管治風險現在與週期效率同等重要。因此,將核准流程、稽核追蹤和受控工作流程納入薪酬方案的供應商,在贏得企業的採購決策方面處於有利地位。
人力資源資訊系統、薪資核算和企業資源規劃系統的整合和實施成本。
ISG Software 的一項調查指出,缺乏與主要 HRIS 供應商預置連接器的平台有被排除在企業採購之外的風險,這凸顯了為何整合準備情況是供應商選擇的決定性因素。
細分市場分析
2025年,軟體仍將佔據負責人薪酬管理軟體市場72.18%的佔有率,持續保持最大佔有率,遙遙領先。這一主導地位反映了大規模雇主已廣泛使用的平台在薪酬規劃、基準測試、薪酬差距分析和資訊揭露支援方面取得的顯著成效。軟體層在負責人薪酬管理軟體市場中仍然佔據核心地位,因為一旦核心模組部署完畢,即可在有限的額外實施成本下擴展使用者和流程。這也有助於雇主在整個薪酬週期內標準化核准途徑、情境建模和報告,避免這些資訊分散在不同的文件和郵件中。這種結構性優勢解釋了為何即使買家期望不斷提高,軟體仍然是收入的主要來源。
由於實施過程中仍需投入大量精力,預計2031年,負責人薪酬管理軟體市場的服務部分將以10.42%的複合年成長率快速成長。許多買家低估了從分散的薪資、人力資源資訊系統和股票選擇權資料中建立符合審計要求的記錄所需的工作量,而這種差距導致對設定和運作後支援的持續需求。第二個因素是企業內部薪資團隊成熟度的差異。根據Payscale 2026年的一項調查,僅有45%的組織在薪資管理成熟度方面達到了「開發階段」或「最佳化階段」。這意味著負責人薪酬管理軟體產業仍依賴外部專家將管治功能轉化為可管理的治理流程。因此,儘管軟體本身構成了收入基礎,但服務部分正在塑造一個新買家和後期實施者仍在努力應對營運複雜性的市場。
到2025年,基於雲端的採用將佔總營收的75.44%,並在2031年之前維持10.11%的複合年成長率,繼續保持規模最大且成長最快的採用模式。在負責人薪酬管理軟體市場,雲端交付備受青睞,因為薪酬規劃通常涉及人力資源、財務、法務和董事會相關人員,他們需要在整個評估週期內存取相同的最新記錄。此外,當報告規則或薪酬透明度要求發生變化時,該模式也支援更快速的產品更新。因此,雇主無需重建本地基礎設施,即可從定期更新過渡到更持續的管治。這種便利性使得雲端交付成為負責人薪資管理軟體市場商業性模式的預設選擇。
在某些法規環境下,尤其是在銀行、金融和保險 (BFSI) 以及政府部門,本地部署和私有雲端方案仍然具有價值,因為這些領域的資料居住要求和監管預期仍然嚴格。德國的 IVV 5.0 框架強化了信貸機構對可變薪酬管理、多年延期支付以及罰款 (MARS) 和追償 (clawback) 追蹤的文檔記錄需求。因此,一些銀行對完全遷移到公共雲端仍然持謹慎態度。由此可見,負責人薪酬管理軟體市場遠比簡單的「純雲端」方案複雜得多。受監管的買家通常更傾向於混合配置,以便能夠掌控其最敏感的記錄。雖然僅提供基礎 SaaS 服務的供應商仍然可以贏得廣泛的企業客戶,但在監管嚴格的領域,他們可能會面臨挑戰。因此,儘管雲端優先設計在負責人薪酬管理軟體產業仍然備受重視,但能夠為有複雜需求的買家提供私有或混合部署模式的供應商仍擁有市場空間。
區域分析
到2025年,北美將佔據負責人薪酬管理軟體市場41.38%的佔有率,成為最大的區域市場佔有率。該地區受益於許多因素,例如:受美國證券交易委員會(SEC)報告義務約束的發行人集中度較高、積極的薪酬差距糾正法律制度,以及以股票薪酬為主的負責人薪酬結構的廣泛應用。在美國,SEC的「薪酬與績效相關性」揭露、各州薪酬範圍揭露以及與追回機制相關的管治等重疊要求,都對負責人薪酬管理軟體市場起到了推動作用。加拿大和墨西哥則透過跨境管治的協調一致,推動了區域需求,這一趨勢在尋求為其北美業務建立通用薪酬管理系統的跨國公司中尤為顯著。
預計到2031年,亞太地區將以11.76%的複合年成長率成長,成為負責人薪酬管理軟體市場成長最快的地區。這一成長主要得益於印度和東南亞企業數位化人力資源的現代化、日本對負責人薪酬監管的加強,以及跨國公司在中國、新加坡和韓國擴展薪資管理系統。根據Ravio發布的《2026年薪資趨勢》報告,亞太和歐洲科技市場人工智慧和機器學習相關職位的招聘年增88%,這些職位的薪資溢價高達12%。這凸顯了快速更新基準和系統化薪酬決定的必要性。 HRSoft也指出,亞太地區、歐盟和中東的金融服務業是客戶獲取成長最快的領域之一,這進一步鞏固了該地區在高度監管的薪資環境下持續成長的勢頭。
歐洲負責人薪酬管理軟體市場監管依然嚴格,這推動了部分大中型企業採用該軟體。歐盟薪酬透明指令下首個2026年數據報告週期顯示,企業普遍的合規意識正轉向積極主動的薪酬採購實務。在德國,IVV 5.0及相關信貸機構管治要求進一步加強了監管,要求在負責人薪酬監督中更全面地整合人力資源、合規和風險資料。雖然南美洲的採用仍處於起步階段,但中東和非洲的需求主要集中在跨國公司的區域總部和子公司,這些公司需要集團層級的薪酬整合,而非部署完全在地化的平台。
其他好處:
- Excel格式的市場預測(ME)表
- 3個月的分析師支持
目錄
第1章:引言
- 研究假設和市場定義
- 調查範圍
第2章:調查方法
第3章執行摘要
第4章 市場狀況
- 市場概覽
- 市場促進因素
- 擴大有關工資透明度和工資平等的法規
- 從以電子表格主導的規劃過渡到符合審計要求的管治
- 與人力資本管理和財務堆疊的雲端原生整合。
- 對以市場基準和人才保留為優先的薪酬確定方法的需求日益成長。
- 美國證券交易委員會的「薪酬與績效掛鉤」以及董事會資訊披露自動化
- 設計與 ESG 掛鉤且經風險已調整的長期獎勵的複雜性。
- 市場限制因素
- 人力資源資訊系統、薪資核算和企業資源規劃系統的整合和實施成本。
- 高度敏感的薪資資料面臨的隱私和網路安全風險
- 調查資料碎片化和工作架構中的漏洞
- 人力資源部、財務部、法務部和董事會之間的跨部門核准出現瓶頸。
- 產業價值鏈分析
- 監理情勢
- 技術展望
- 宏觀經濟因素對市場的影響
- 波特五力分析
第5章 市場規模與成長預測
- 按組件
- 軟體
- 服務
- 部署模式
- 基於雲端的
- 現場
- 按公司規模
- 大公司
- 小型企業
- 按最終用戶行業分類
- BFSI
- IT/通訊
- 醫療保健和生命科學
- 零售與電子商務
- 工業製造
- 政府/公共部門
- 其他終端用戶產業
- 按地區
- 北美洲
- 美國
- 加拿大
- 墨西哥
- 南美洲
- 巴西
- 阿根廷
- 智利
- 其他南美國家
- 歐洲
- 德國
- 英國
- 法國
- 義大利
- 西班牙
- 荷蘭
- 俄羅斯
- 其他歐洲國家
- 亞太地區
- 中國
- 日本
- 印度
- 澳洲
- 新加坡
- 韓國
- 其他亞太國家
- 中東
- 沙烏地阿拉伯
- 阿拉伯聯合大公國
- 土耳其
- 其他中東國家
- 非洲
- 南非
- 奈及利亞
- 埃及
- 其他非洲國家
- 北美洲
第6章 競爭情勢
- 市場集中度
- 策略趨勢
- 市佔率分析
- 公司簡介
- Salary.com, LLC
- Payscale, Inc.
- beqom SA
- Equilar, Inc.
- HRsoft, Inc.
- Decusoft, Inc.
- Aeqium, Inc.
- Compport Private Limited
- OpenComp, Inc.
- Trove Information Technologies, Inc. dba Pave
- Figures SAS
- Ravio Technologies Ltd.
- Performing Ideas HR AB
- Compa Technologies, Inc.
- Main Data Group
- BullseyeEngagement LLC
- Laserbeam Software, LLC
- Syndio, Inc.
- Incentiv, Inc.
- PerformanceCentre, Inc.
第7章 市場機會與未來展望
Implementation complexity remains a real brake on the executive compensation software market, especially for buyers moving from spreadsheets to a formal platform for the first time. These deployments often require deep links into HRIS, payroll, ERP, and equity systems, and the work extends beyond technical setup into approvals design, job architecture, security permissions, and change management. In practice, organizations also need to reconcile compensation data that sits across multiple source systems, which adds time and service cost before the platform can support reliable planning or reporting. This burden is heavier in the executive compensation software market for SMEs and first-time buyers, because they usually have fewer internal IT and compensation specialists available to structure the rollout. The continued 10.42% CAGR for services through 2031 reflects that demand for configuration, integration, and support, and it also shows that adoption intent is often stronger than implementation readiness.
According to Mordor Intelligence, the executive compensation software market was valued at USD 1.03 billion in 2025. This report is Segmented by Component (Software, and Services), Deployment Model (Cloud-Based, and More), Enterprise Size (Large Enterprises, and SMEs), End-User Industry (BFSI, IT and Telecommunications, Healthcare and Lifesciences, Retail and E-Commerce, Industrial Manufacturing, Government and Public Sector, and More), and Geography. The Market Forecasts are Provided in Terms of Value (USD).
Global Executive Compensation Software Market Trends and Insights
Expanding Pay Transparency and Pay Equity Regulation
Pay transparency rules have moved beyond voluntary practice and into mandatory operating requirements for many employers in the executive compensation software market. As of 2026, 16 US states and Washington, D.C., required salary range disclosure in job postings, and several additional state laws became effective across 2025, which widened the number of employers that had to manage live pay range data across recruiting and rewards workflows. The EU Pay Transparency Directive requires member-state transposition by June 7, 2026, and it sets up annual reporting obligations for employers with 250 or more employees from 2027 using 2026 baseline data, which pulled software planning into the current year rather than a later compliance window. This has changed the buying case in the executive compensation software market, because employers need centralized records, role-based access, and evidence that pay decisions can be explained under review. Multinational employers also face a cascade effect, since hiring into one covered location can force broader policy and data changes across shared compensation systems. That is why regulatory change now supports recurring platform usage instead of a one-off compliance spend.
Shift from Spreadsheet-Led Planning to Audit-Ready Governance
Boards and compensation committees are applying a different standard to executive pay workflows, and that is lifting the executive compensation software market beyond a productivity narrative. Spreadsheet-led planning still works for narrow annual exercises, but it breaks down when employers need multi-level approvals, version history, exception tracking, and evidence that decisions followed policy. A 2026 Silae analysis of 6.7 million payslips found an average executive pay gap of 13.37%, with the gap rising above 45% in financial and insurance activity and widening sharply over the span of a career, which shows how hard it is to detect structural gaps without organized data. beqom reported that 38% of European companies viewed their current systems as inadequate for incoming EU requirements, which points to a readiness gap that extends well beyond headline compliance awareness. The executive compensation software market gains from this shift because governance risk now matters as much as cycle efficiency when employers choose a platform. Vendors that embed approvals, audit trails, and controlled workflows into compensation planning are, therefore, better placed to win enterprise buying decisions.
Integration and Implementation Costs Across HRIS, Payroll, And ERP
ISG Software Research noted that platforms without pre-built connectors to major HRIS vendors risk exclusion from enterprise procurement, underscoring why integration readiness has become a gating factor in vendor selection.
Other drivers and restraints analyzed in the detailed report include:
- Cloud-Native Integration with Human Capital Management and Finance Stacks
- Rising Demand for Market Benchmarking and Retention-Driven Pay Decisions
- Sensitive Pay Data Privacy and Cybersecurity Exposure
For complete list of drivers and restraints, kindly check the Table Of Contents.
Segment Analysis
Software held 72.18% of the executive compensation software market share in 2025, which kept it as the largest component by a wide margin. That dominance reflects the installed base of platforms already used for compensation planning, benchmarking, pay equity analytics, and disclosure support across larger employers. The software layer remains central in the executive compensation software market because once core modules are deployed, additional users and process extensions can be added with limited incremental delivery cost. It also allows employers to standardize approval paths, scenario modeling, and reporting across compensation cycles that would otherwise sit in separate files and emails. This structural advantage explains why software still anchors revenue even as buyer expectations become more demanding.
The services side of the executive compensation software market is still projected to grow faster, at a 10.42% CAGR through 2031, because implementation work remains intensive. Many buyers underestimate the effort needed to build audit-ready records from fragmented payroll, HRIS, and equity data, and that gap creates recurring demand for configuration and post-go-live support. A second factor is the maturity gap within internal compensation teams, because Payscale found in 2026 that only 45% of organizations had reached an advancing or optimizing state in compensation maturity. That means the executive compensation software industry still depends on outside expertise to convert platform features into controlled governance processes. The result is a market where software provides the revenue base, while services absorb the operational complexity that new buyers and late-stage adopters still struggle to manage.
Cloud-based deployment accounted for 75.44% of revenue in 2025, and it remains both the largest and fastest-growing deployment model with a 10.11% CAGR through 2031. The executive compensation software market favors cloud delivery because compensation planning usually involves HR, finance, legal, and board participants who need access to the same current records across review cycles. This model also supports quicker product updates when reporting rules or pay transparency requirements change. Employers can therefore move from periodic updates to more continuous governance without rebuilding local infrastructure. That convenience has made cloud delivery the default option for the commercial mainstream of the executive compensation software market.
On-premises and private cloud options still hold value in specific regulated settings, particularly in BFSI and government environments where data residency and supervisory expectations remain strict. Germany's IVV 5.0 framework strengthened the need for documented variable pay controls, multi-year deferral, and malus or clawback tracking in credit institutions, which keeps some banks cautious about fully public cloud deployment. That makes the executive compensation software market more nuanced than a simple cloud-only story, because regulated buyers often prefer hybrid configurations that preserve control over the most sensitive records. Vendors with only a basic SaaS offer can still win broad commercial business, but they may struggle in tightly supervised segments. The executive compensation software industry therefore continues to reward cloud-first design while still leaving room for vendors that can support private or hybrid deployment models for complex buyers.
Complete Report Scope:
- By Component
- Software
- Services
- By Deployment Model
- Cloud-Based
- On-Premises
- By Enterprise Size
- Large Enterprises
- SMEs
- By End-User Industry
- BFSI
- IT and Telecommunications
- Healthcare and Lifesciences
- Retail and E-commerce
- Industrial Manufacturing
- Government and Public Sector
- Other End-user Industries
- By Geography
- North America
- United States
- Canada
- Mexico
- South America
- Brazil
- Argentina
- Chile
- Rest of South America
- Europe
- Germany
- United Kingdom
- France
- Italy
- Spain
- Netherlands
- Russia
- Rest of Europe
- Asia-Pacific
- China
- Japan
- India
- Australia
- Singapore
- South Korea
- Rest of Asia-Pacific
- Middle East
- Saudi Arabia
- United Arab Emirates
- Turkey
- Rest of Middle East
- Africa
- South Africa
- Nigeria
- Egypt
- Rest of Africa
- North America
Geography Analysis
North America held 41.38% of the executive compensation software market size in 2025, which made it the largest regional contributor. The region benefits from the concentration of SEC-reporting issuers, an active pay equity legal environment, and widespread use of equity-heavy executive pay structures. In the United States, the executive compensation software market is supported by overlapping requirements that cover SEC Pay versus Performance disclosure, state salary range posting, and clawback-related governance. Canada and Mexico add to regional demand through cross-border governance alignment, especially among multinational employers that want common compensation controls across North American operations.
Asia-Pacific is projected to grow at an 11.76% CAGR through 2031, giving it the fastest regional trajectory in the executive compensation software market. Growth is coming from digital HR modernization in Indian and Southeast Asian firms, stronger executive remuneration oversight in Japan, and expanding multinational payroll governance across China, Singapore, and South Korea. Ravio's 2026 Compensation Trends report recorded 88% year-over-year growth in AI and ML hiring across Asia-Pacific and European tech markets, with those roles carrying 12% pay premiums, which raises the need for faster benchmark refresh and structured pay decisions. HRSoft also indicated that APAC, EU, and Middle East financial services verticals were among its fastest-growing customer acquisition areas, reinforcing the region's momentum in more regulated compensation environments.
Europe remains a high-intensity regulatory region in the executive compensation software market, and it is pulling adoption forward across both large enterprises and parts of the mid-market. The first reporting cycle tied to 2026 data under the EU Pay Transparency Directive is turning general compliance awareness into active procurement work in 2026. Germany adds another layer through IVV 5.0 and related governance expectations for credit institutions, which require more integrated HR, compliance, and risk data in executive pay oversight. South America is still earlier in adoption, while the Middle East and Africa demand is more concentrated among regional headquarters and multinational subsidiaries that need group-level compensation consolidation rather than a fully localized platform footprint.
- Salary.com, LLC
- Payscale, Inc.
- beqom SA
- Equilar, Inc.
- HRsoft, Inc.
- Decusoft, Inc.
- Aeqium, Inc.
- Compport Private Limited
- OpenComp, Inc.
- Trove Information Technologies, Inc. dba Pave
- Figures SAS
- Ravio Technologies Ltd.
- Performing Ideas HR AB
- Compa Technologies, Inc.
- Main Data Group
- BullseyeEngagement LLC
- Laserbeam Software, LLC
- Syndio, Inc.
- Incentiv, Inc.
- PerformanceCentre, Inc.
Additional Benefits:
- The market estimate (ME) sheet in Excel format
- 3 months of analyst support
TABLE OF CONTENTS
1 INTRODUCTION
- 1.1 Study Assumptions and Market Definition
- 1.2 Scope of the Study
2 RESEARCH METHODOLOGY
3 EXECUTIVE SUMMARY
4 MARKET LANDSCAPE
- 4.1 Market Overview
- 4.2 Market Drivers
- 4.2.1 Expanding Pay Transparency and Pay Equity Regulation
- 4.2.2 Shift From Spreadsheet-Led Planning to Audit-Ready Governance
- 4.2.3 Cloud-Native Integration With Human Capital Management and Finance Stacks
- 4.2.4 Rising Demand for Market Benchmarking and Retention-Driven Pay Decisions
- 4.2.5 SEC Pay Versus Performance and Board-Ready Disclosure Automation
- 4.2.6 ESG-Linked and Risk-Adjusted Long-Term Incentive Design Complexity
- 4.3 Market Restraints
- 4.3.1 Integration and Implementation Costs Across HRIS, Payroll, and ERP
- 4.3.2 Sensitive Pay Data Privacy and Cybersecurity Exposure
- 4.3.3 Survey Data Fragmentation and Weak Job Architecture
- 4.3.4 Cross-Functional Approval Bottlenecks Across HR, Finance, Legal, and Boards
- 4.4 Industry Value Chain Analysis
- 4.5 Regulatory Landscape
- 4.6 Technological Outlook
- 4.7 Impact of Macroeconomic Factors on the Market
- 4.8 Porter's Five Forces Analysis
- 4.8.1 Threat of New Entrants
- 4.8.2 Bargaining Power of Buyers
- 4.8.3 Bargaining Power of Suppliers
- 4.8.4 Threat of Substitutes
- 4.8.5 Intensity of Competitive Rivalry
5 MARKET SIZE AND GROWTH FORECASTS (VALUE)
- 5.1 By Component
- 5.1.1 Software
- 5.1.2 Services
- 5.2 By Deployment Model
- 5.2.1 Cloud-Based
- 5.2.2 On-Premises
- 5.3 By Enterprise Size
- 5.3.1 Large Enterprises
- 5.3.2 SMEs
- 5.4 By End-User Industry
- 5.4.1 BFSI
- 5.4.2 IT and Telecommunications
- 5.4.3 Healthcare and Lifesciences
- 5.4.4 Retail and E-commerce
- 5.4.5 Industrial Manufacturing
- 5.4.6 Government and Public Sector
- 5.4.7 Other End-user Industries
- 5.5 By Geography
- 5.5.1 North America
- 5.5.1.1 United States
- 5.5.1.2 Canada
- 5.5.1.3 Mexico
- 5.5.2 South America
- 5.5.2.1 Brazil
- 5.5.2.2 Argentina
- 5.5.2.3 Chile
- 5.5.2.4 Rest of South America
- 5.5.3 Europe
- 5.5.3.1 Germany
- 5.5.3.2 United Kingdom
- 5.5.3.3 France
- 5.5.3.4 Italy
- 5.5.3.5 Spain
- 5.5.3.6 Netherlands
- 5.5.3.7 Russia
- 5.5.3.8 Rest of Europe
- 5.5.4 Asia-Pacific
- 5.5.4.1 China
- 5.5.4.2 Japan
- 5.5.4.3 India
- 5.5.4.4 Australia
- 5.5.4.5 Singapore
- 5.5.4.6 South Korea
- 5.5.4.7 Rest of Asia-Pacific
- 5.5.5 Middle East
- 5.5.5.1 Saudi Arabia
- 5.5.5.2 United Arab Emirates
- 5.5.5.3 Turkey
- 5.5.5.4 Rest of Middle East
- 5.5.6 Africa
- 5.5.6.1 South Africa
- 5.5.6.2 Nigeria
- 5.5.6.3 Egypt
- 5.5.6.4 Rest of Africa
- 5.5.1 North America
6 COMPETITIVE LANDSCAPE
- 6.1 Market Concentration
- 6.2 Strategic Moves
- 6.3 Market Share Analysis
- 6.4 Company Profiles (includes Global Level Overview, Market Level Overview, Core Segments, Financials as available, Strategic Information, Market Rank/Share, Products and Services, Recent Developments)
- 6.4.1 Salary.com, LLC
- 6.4.2 Payscale, Inc.
- 6.4.3 beqom SA
- 6.4.4 Equilar, Inc.
- 6.4.5 HRsoft, Inc.
- 6.4.6 Decusoft, Inc.
- 6.4.7 Aeqium, Inc.
- 6.4.8 Compport Private Limited
- 6.4.9 OpenComp, Inc.
- 6.4.10 Trove Information Technologies, Inc. dba Pave
- 6.4.11 Figures SAS
- 6.4.12 Ravio Technologies Ltd.
- 6.4.13 Performing Ideas HR AB
- 6.4.14 Compa Technologies, Inc.
- 6.4.15 Main Data Group
- 6.4.16 BullseyeEngagement LLC
- 6.4.17 Laserbeam Software, LLC
- 6.4.18 Syndio, Inc.
- 6.4.19 Incentiv, Inc.
- 6.4.20 PerformanceCentre, Inc.
7 MARKET OPPORTUNITIES AND FUTURE OUTLOOK
- 7.1 White-Space and Unmet-Need Assessment

 2026-2030年全球人力資源與薪資軟體市場
 薪酬管理軟體市場:依部署模式和區域分類
 雲端薪資核算軟體市場報告:按組件、組織規模、產業和地區分類(2026-2034 年)
 2026年全球人力資源與薪資軟體市場報告2026年全球雲端薪資核算軟體市場報告
 2026-2030年全球薪資軟體市場
 人力資源和薪資軟體市場-全球產業規模、佔有率、趨勢、機會和預測:按組件、部署模式、組織規模、產業橫斷面、區域和競爭格局分類,2021-2031年
 人力資源與薪資軟體市場規模、佔有率及成長分析(按應用、組織規模、部署類型和地區分類)-2026-2033年產業預測2034 年全球人力資源與薪資軟體市場機會與策略
 全球雲端基礎薪資核算軟體市場:市場規模、佔有率、趨勢分析(按組件、組織規模、行業和地區)、展望和未來預測(2024-2031 年)