


 |
市場調查報告書
商品編碼
2073119
白盒交換器:市場佔有率分析、產業趨勢與統計、成長預測(2026-2031)White Box Switch - Market Share Analysis, Industry Trends & Statistics, Growth Forecasts (2026 - 2031) |
||||||

※ 本網頁內容可能與最新版本有所差異。詳細情況請與我們聯繫。
據 Mordor Intelligence 稱,2025 年白盒交換機市值為 29.4 億美元,預計到 2031 年將達到 66.5 億美元,而 2026 年為 33.8 億美元,預測期(2026-2031 年)的複合年成長率為 14.49%。
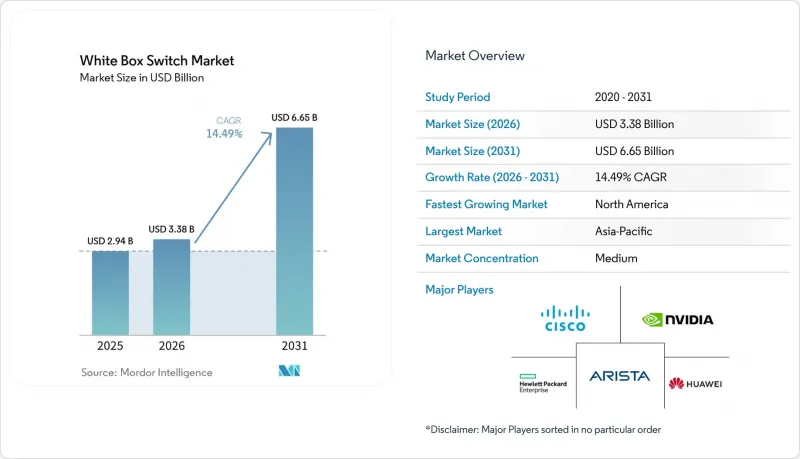
本報告按連接埠速度(10/25 GbE、40 GbE、100 GbE、200/400 GbE、800 GbE)、交換層級(存取層、匯聚層、核心層)、終端用戶產業(雲端服務供應商、通訊業者等)、部署環境(超大規模等)、作業系統(SONiC)、作業系統組件、硬體作業系統、系統市場預測以美元(USD)為單位。
全球白盒交換機市場趨勢與洞察
超大規模資料中心的擴張
像Meta、Google、微軟和亞馬遜這樣的超大規模資料中心業者正持續大規模部署由原始設備製造商 (ODM) 客製化的交換機底盤,從而消除了 OEM 品牌溢價,並實現了 18-24 個月的更快設計更新周期,以與晶片藍圖保持一致。 2026 年的資本支出計畫將數百億美元用於建立人工智慧叢集,每個集群都需要數千個 800 GbE 啟動連接埠來支援高頻寬、低延遲的網路架構。整合光學模組並支援液冷技術的叢集可確保優先供應先進的 ASIC 晶片,從而縮短產品上市時間並提高利潤率。同時,預計到 2030 年,亞太地區的產能將超過北美,供應商正在越南和印度擴大其製造地。這種多元化降低了供應鏈集中風險,並在地緣政治和貿易不確定性下穩定了交貨時間。
過渡到 400G 和 800G 乙太網路連接埠速度
IEEE 802.3df 於 2024 年獲得批准,消除了 800 GbE 部署方面的標準不確定性,加快了 ASIC 廠商的藍圖,並使得 102.4 Tbps 級設備能夠在 12 個月的樣品週期內投入使用。超大規模資料中心業者正在優先升級脊層,並將 400 GbE 晶片級聯到先前運作在 100 GbE 的葉層,從而最佳化整個網路架構的每位元成本。預計到 2026 年,支援接近 30 kW 機架密度的水冷底盤將實現商業化,而線性可插拔光模組將降低約 50% 的模組功耗,從而提高整體能源效率。同時,OSFP 連接埠的前置作業時間已縮短至約 16 週,使得網路架構部署和 GPU 叢集部署能夠更加緊密地同步。現有 OEM 廠商擴大提供與 SONiC 相容的系統,這表明性能差異化正朝著開放、解耦的硬體模型發展。
網路團隊內部的整合與營運複雜性
白盒解決方案的採用正將網路維運從基於命令列介面 (CLI) 的工作流程轉向 Linux、容器化以及 Docker 和 CI/CD 管線等自動化堆疊,由此造成了不容忽視的技能缺口。早期採用者指出,調試容器化化路由功能和維護交換器抽象介面 (SAI) 層需要陡峭的學習曲線,這增加了初始部署期間的運維風險。雖然商業 SONiC 發行版提供支援和工具,但它們並不能完全消除 DevOps 成熟度較低的組織中的文化抵觸情緒。中小企業更傾向於運維複雜度較低的整合網路解決方案,因此,在超大規模環境之外,此類解決方案的採用仍然有限。儘管培訓計畫和託管服務在一定程度上緩解了這些挑戰,但快速的功能發布週期迫使團隊不斷管理更新,許多人認為這增加了維運負擔,而非提高了效率。
細分市場分析
2025年,100GbE層級仍維持46.23%的收入佔有率。這反映了其在企業和傳統資料中心架構中的部署情況,但發展勢頭正迅速轉向更高頻寬的架構。受102.4Tbps ASIC商用化推動,800GbE白盒交換器市場預計將在2026年至2031年間以26.24%的複合年成長率成長,這些ASIC將支援高密度64埠OSFP主幹網路配置。這些平台在滿足AI叢集吞吐量和延遲要求的同時,保持了每比特成本競爭力。隨著超大規模資料中心業者資料中心優先考慮可擴展、無阻塞的架構,800GbE正從早期部署走向全面普及,取代了中間升級路徑。
這種加速縮短了傳統的升級週期,通訊業者擴大跳過400 GbE葉層升級,直接遷移到800 GbE脊層,以適應不斷擴展的人工智慧工作負載。由此帶來的需求激增將促進商用晶片的銷售,並改善整個生態系統的經濟效益。高效節能的線性可插拔光模組降低了模組能耗,直接降低了營運成本。同時,水冷底盤消除了超過30 kW機架中的散熱限制,從而實現了更高的端口密度。供應商已經預先檢驗了這些架構的參考設計,縮短了部署時間,並加速了在白盒環境中向下一代高速交換的快速過渡。
到2025年,接取平台將佔總營收的39.62%,這反映出其在企業園區和邊緣環境中的廣泛部署,但成長重心正轉向更高價值的核心層。隨著超大規模資料中心業者圍繞800 GbE和新興的1.6 Tbps連接埠重新設計其骨幹架構,核心交換器預計將以15.83%的複合年成長率成長。這些升級將提高核心層的市場佔有率,並透過將多個傳統底盤整合到更少、更高密度的系統中,從而提高空間和電源效率。因此,資本配置正轉向網路層的更高層級,在這些層級,效能提升將直接影響工作負載的可擴展性和對延遲敏感的應用。
同時,SONiC企業級功能集的擴展,包括對PVST+和802.1X的支持,正逐步推動其產品滲透到接入層應用場景,使ODM廠商能夠部署基於Marvell架構、經濟高效的1GbE PoE交換機,用於園區網路。然而,預算優先順序仍嚴重偏向AI驅動的基礎設施,其中無阻塞主幹網路架構能夠提供最佳的效能和經濟效益。因此,儘管存取層的應用正在擴大目標市場,但大部分新增收入仍集中在核心交換領域,這進一步提升了其在白盒交換機市場的策略重要性。
區域分析
預計到2025年,北美將佔全球需求的39.47%。這主要得益於維吉尼亞、奧勒岡州和愛荷華州的超大規模資料中心叢集,叢集持續推動大規模白盒交換機的部署。 2026年的資本支出計畫超過600億美元,其中大部分將用於人工智慧基礎設施,這些基礎設施需要800GbE主幹網路層和液冷機架環境來維持高密度運算負載。同時,企業採用率也逐漸提高,金融服務和媒體等產業正在試行基於SONiC的架構,以降低軟體授權成本並提高營運柔軟性。超大規模市場的主導地位和不斷擴大的企業採用率進一步鞏固了北美作為白盒交換機市場主要收入來源的地位。
亞太地區是成長最快的地區,預計將以15.21%的複合年成長率成長,這得益於各國政府對數位基礎設施的大力支持以及主要經濟體加速部署5G。資料在地化政策和雲端運算的普及推動了該地區對資料中心容量的需求,預計到2030年,託管式資料中心容量將超過23,900兆瓦,超過美國。在供應方面,台灣的原始設計製造商(ODM)正在將製造地擴展到越南和馬來西亞,以利用成本優勢、稅收優惠和地緣政治分散。這種在地化將縮短前置作業時間,增強供應鏈韌性,從而加速白盒交換解決方案在超大規模資料中心和新興企業市場的應用。
歐洲的成長受到監管和永續性優先事項以及通訊業者主導的網路轉型舉措的影響。通訊業者優先考慮節能型 400 GbE 交換平台,並結合線性可插拔光元件,這可以降低高達 30% 的功耗,並符合區域碳排放目標。隨著通訊業者尋求供應商多元化和成本控制,開放式無線存取網路 (Open RAN) 專案進一步加速了解耦網路的採用。在英國和德國等國家,政府主導的資金正在推動開放式基礎設施模式的轉型。同時,在南美、中東和非洲等新興地區,部署尚處於早期階段,試點部署正在增加,這表明白盒交換機市場正在逐步擴展到現有區域之外。
其他好處:
- Excel格式的市場預測(ME)表
- 3個月的分析師支持
目錄
第1章:引言
- 研究假設和市場定義
- 調查範圍
第2章:調查方法
第3章執行摘要
第4章 市場狀況
- 市場概覽
- 市場促進因素
- 超大規模資料中心的擴張
- 過渡到 400G 和 800G 乙太網路連接埠速度
- 透過硬體和軟體分離實現成本最佳化
- 人工智慧和機器學習工作負載需要低延遲的網路架構。
- 永續發展目標旨在促進節能轉型
- 開放原始碼作業系統生態系統的成熟
- 市場限制因素
- 網路團隊的整合與營運複雜性
- 供應商提供的支援和保固不足。
- 通用矽供應鏈的波動性
- 開放網路環境中的安全問題
- 產業供應鏈分析
- 監理情勢
- 技術展望
- 宏觀經濟因素對市場的影響
- 波特五力分析
第5章 市場規模與成長預測
- 連接埠速度
- 10/25 GbE
- 40 GbE
- 100 GbE
- 200/400 GbE
- 800 GbE
- 交換層
- 存取交換機
- 配電開關
- 核心交換機
- 按最終用戶行業分類
- 雲端服務供應商
- 通訊業者
- 公司
- 政府/公共部門
- 按部署環境
- 超大規模資料中心
- 企業資料中心
- 邊緣資料中心
- 透過網路作業系統(NOS)
- SONiC
- Cumulus Linux
- Pica8 PicOS
- 其他NOS
- 按組件
- 硬體
- 網路作業系統(NOS)
- 服務
- 按地區
- 北美洲
- 美國
- 加拿大
- 墨西哥
- 南美洲
- 巴西
- 阿根廷
- 其他南美國家
- 歐洲
- 德國
- 英國
- 法國
- 義大利
- 西班牙
- 俄羅斯
- 其他歐洲國家
- 亞太地區
- 中國
- 日本
- 印度
- 韓國
- 澳洲
- 其他亞太國家
- 中東
- 沙烏地阿拉伯
- 阿拉伯聯合大公國
- 土耳其
- 其他中東國家
- 非洲
- 南非
- 北非
- 其他非洲國家
- 北美洲
第6章 競爭情勢
- 市場集中度
- 策略趨勢
- 市佔率分析
- 公司簡介
- Accton Technology Corporation
- Quanta Cloud Technology Inc.
- Hon Hai Precision Industry Co., Ltd.
- Celestica Inc.
- Delta Electronics, Inc.
- Alpha Networks Inc.
- Edgecore Networks Corporation
- Asterfusion Data Technologies Co., Ltd.
- Lanner Electronics Inc.
- Wistron Corporation
- Inventec Corporation
- Super Micro Computer, Inc.
- MiTAC Holdings Corporation
- Netberg Ltd.
- Interface Masters Technologies, Inc.
- UfiSpace Co., Ltd.
- Radisys Corporation
- Advantech Co., Ltd.
- Silicom Ltd.
- Flex Ltd.
第7章 市場機會與未來展望
According to Mordor Intelligence, the white box switch market size was valued at USD 2.94 billion in 2025 and estimated to grow from USD 3.38 billion in 2026 to reach USD 6.65 billion by 2031, at a CAGR of 14.49% during the forecast period (2026-2031).
This report is Segmented by Port Speed (10/25 GbE, 40 GbE, 100 GbE, 200/400 GbE, 800 GbE), Switch Layer (Access, Distribution, Core), End User Industry (Cloud Service Providers, Telecom Operators, and More), Deployment Environment (Hyperscale, and More), Network Operating System (SONiC, and More), Component (Hardware, NOS, Services), and Geography. The Market Forecasts are Provided in Terms of Value (USD).
Global White Box Switch Market Trends and Insights
Hyperscale Data Center Expansion
Hyperscalers such as Meta, Google, Microsoft, and Amazon continue to deploy self-specified switch chassis manufactured by ODMs at scale, removing OEM brand premiums and enabling faster 18-24 month design refresh cycles aligned with silicon roadmaps. Capital expenditure programs entering 2026 allocate tens of billions of dollars (USD tens of billions) toward AI cluster buildouts, each demanding thousands of 800 GbE spine ports to support high-bandwidth, low-latency fabrics. ODMs that integrate optics and support liquid cooling secure priority access to advanced ASIC supply, shortening commercialization timelines and improving margin capture. At the same time, Asia-Pacific capacity is projected to surpass North America by 2030, prompting vendors to expand manufacturing footprints in Vietnam and India. This diversification reduces supply chain concentration risk and stabilizes delivery timelines amid geopolitical and trade uncertainties.
Transition to 400G and 800G Ethernet Port Speeds
The ratification of IEEE 802.3df in 2024 removed standards uncertainty for 800 GbE deployments, accelerating ASIC vendor roadmaps toward 102.4 Tbps-class devices within a 12-month sampling window. Hyperscalers prioritize spine-layer upgrades, cascading 400 GbE silicon into leaf tiers that previously operated at 100 GbE, thereby optimizing cost per bit across fabrics. Liquid-cooled chassis are expected to be commercialized by 2026 to support rack densities approaching 30 kW, while linear pluggable optics reduce module power consumption by approximately 50%, improving overall energy efficiency. Concurrently, OSFP port lead times have compressed to around 16 weeks, enabling tighter synchronization between network fabric rollouts and GPU cluster deployments. Incumbent OEMs are increasingly offering SONiC-compatible systems, indicating that performance differentiation is converging toward open, disaggregated hardware models.
Integration and Operational Complexity for Network Teams
White box deployments shift network operations from CLI-based workflows to Linux, containerization, and automation stacks such as Docker and CI/CD pipelines, creating a non-trivial skills gap. Early adopters highlight steep learning curves when debugging containerized routing functions or maintaining Switch Abstraction Interface layers, increasing operational risk during initial rollouts. Commercial SONiC distributions provide support and tooling, but they do not fully offset cultural resistance in organizations lacking DevOps maturity. Adoption outside hyperscale environments remains constrained, as smaller enterprises prefer integrated networking solutions with lower operational complexity. Although training programs and managed services partially mitigate these challenges, the rapid release cadence of features forces teams to manage continuous updates, which many view as incremental operational overhead rather than net efficiency gains.
Other drivers and restraints analyzed in the detailed report include:
- Cost Optimization via Hardware-Software Disaggregation
- AI and Machine Learning Workloads Demand Low-Latency Fabrics
- Limited Vendor Support and Warranty Ecosystem
For complete list of drivers and restraints, kindly check the Table Of Contents.
Segment Analysis
The 100 GbE tier retained a 46.23% revenue share in 2025, reflecting its installed base across enterprise and legacy data center fabrics, but momentum is shifting rapidly toward higher bandwidth architectures. The white box switch market for 800 GbE is projected to grow at a 26.24% CAGR between 2026 and 2031, supported by the commercialization of 102.4 Tbps ASICs that enable dense 64-port OSFP spine configurations. These platforms meet the throughput and latency requirements of AI clusters while maintaining competitive cost per bit. As hyperscalers prioritize scalable, non-blocking fabrics, 800 GbE transitions from early deployment to volume adoption, displacing intermediate upgrade paths.
This acceleration compresses traditional upgrade cycles, with operators increasingly bypassing 400 GbE leaf upgrades and moving directly to 800 GbE spine layers to align with AI workload scaling. The resulting surge in demand strengthens merchant silicon volumes and improves ecosystem economics. Power-efficient linear pluggable optics reduce module energy consumption, directly lowering operating expenditure, while liquid-cooled chassis remove thermal constraints in racks exceeding 30 kW, enabling higher port density. Vendors are already pre-validating reference designs for these architectures, shortening deployment timelines and accelerating a rapid shift toward next-generation high-speed switching in white-box environments.
Access platforms accounted for 39.62% of revenue in 2025, reflecting their broad deployment across enterprise campus and edge environments, but growth is shifting toward higher-value core layers. Core switches are projected to expand at a 15.83% CAGR as hyperscalers redesign spine architectures around 800 GbE and emerging 1.6 Tbps ports. These upgrades increase core-layer share by consolidating multiple legacy chassis into fewer, higher-density systems, improving space and power efficiency. As a result, capital allocation is moving upward in the network hierarchy, where performance gains directly influence workload scalability and latency-sensitive applications.
At the same time, SONiC's expanding enterprise feature set, including PVST+ and 802.1X support, is enabling gradual penetration into access-layer use cases, allowing ODMs to introduce cost-effective Marvell-based 1 GbE PoE switches for campus deployments. However, budget prioritization remains skewed toward AI-driven infrastructure, where non-blocking spine fabrics deliver the highest performance and economic impact. Consequently, while access-layer adoption broadens the addressable market, the majority of incremental revenue growth is concentrated in core switching, reinforcing its strategic importance in the white-box switch market.
Complete Report Scope:
- By Port Speed
- 10/25 GbE
- 40 GbE
- 100 GbE
- 200/400 GbE
- 800 GbE
- By Switch Layer
- Access Switches
- Distribution Switches
- Core Switches
- By End User Industry
- Cloud Service Providers
- Telecom Operators
- Enterprises
- Government & Public Sector
- By Deployment Environment
- Hyperscale Data Centers
- Enterprise Data Centers
- Edge Data Centers
- By Network Operating System (NOS)
- SONiC
- Cumulus Linux
- Pica8 PicOS
- Other NOS
- By Component
- Hardware
- Network Operating System (NOS)
- Services
- By Geography
- North America
- United States
- Canada
- Mexico
- South America
- Brazil
- Argentina
- Rest of South America
- Europe
- Germany
- United Kingdom
- France
- Italy
- Spain
- Russia
- Rest of Europe
- Asia-Pacific
- China
- Japan
- India
- South Korea
- Australia
- Rest of Asia-Pacific
- Middle East
- Saudi Arabia
- United Arab Emirates
- Turkey
- Rest of Middle East
- Africa
- South Africa
- North Africa
- Rest of Africa
- North America
Geography Analysis
North America accounted for 39.47% of demand in 2025, anchored by hyperscale data center clusters in Virginia, Oregon, and Iowa, which continue to drive high-volume deployments of white-box switches. Capital expenditure plans exceed USD 60 billion in 2026, largely directed toward AI infrastructure that requires 800 GbE spine layers and liquid-cooled rack environments to sustain high-density compute loads. In parallel, enterprise adoption is gradually expanding, with sectors such as financial services and media piloting SONiC-based fabrics to reduce software licensing costs and improve operational flexibility. This combination of hyperscale dominance and incremental enterprise uptake reinforces North America's position as the primary revenue contributor in the white box switch market.
Asia-Pacific is the fastest-growing region, projected to expand at a 15.21% CAGR, supported by strong government incentives for digital infrastructure and accelerating 5G deployment across major economies. Data localization policies and rising cloud adoption are driving demand for regional data center capacity, with managed colocation expected to exceed 23,900 MW by 2030, surpassing the United States. At the supply level, Taiwan-based ODMs are expanding manufacturing into Vietnam and Malaysia to leverage cost advantages, tax incentives, and geopolitical diversification. This localized production capability reduces lead times and strengthens supply chain resilience, enabling faster adoption of white box switching solutions across both hyperscale and emerging enterprise markets.
Europe's growth is shaped by regulatory and sustainability priorities, as well as telecom-driven network transformation initiatives. Operators are prioritizing energy-efficient 400 GbE switching platforms combined with linear pluggable optics, which can reduce power consumption by up to 30% and align with regional carbon-reduction targets. Open RAN programs are further accelerating the adoption of disaggregated networking as carriers seek vendor diversification and cost control. Government-backed funding in countries such as the United Kingdom and Germany is supporting the transition toward open infrastructure models. Meanwhile, emerging regions, including South America, the Middle East, and Africa, are at early stages of adoption but are seeing increasing pilot deployments, indicating gradual expansion of the white box switch market beyond established geographies.
- Accton Technology Corporation
- Quanta Cloud Technology Inc.
- Hon Hai Precision Industry Co., Ltd.
- Celestica Inc.
- Delta Electronics, Inc.
- Alpha Networks Inc.
- Edgecore Networks Corporation
- Asterfusion Data Technologies Co., Ltd.
- Lanner Electronics Inc.
- Wistron Corporation
- Inventec Corporation
- Super Micro Computer, Inc.
- MITAC Holdings Corporation
- Netberg Ltd.
- Interface Masters Technologies, Inc.
- UfiSpace Co., Ltd.
- Radisys Corporation
- Advantech Co., Ltd.
- Silicom Ltd.
- Flex Ltd.
Additional Benefits:
- The market estimate (ME) sheet in Excel format
- 3 months of analyst support
TABLE OF CONTENTS
1 INTRODUCTION
- 1.1 Study Assumptions and Market Definition
- 1.2 Scope of the Study
2 RESEARCH METHODOLOGY
3 EXECUTIVE SUMMARY
4 MARKET LANDSCAPE
- 4.1 Market Overview
- 4.2 Market Drivers
- 4.2.1 Hyperscale Data Center Expansion
- 4.2.2 Transition to 400G and 800G Ethernet Port Speeds
- 4.2.3 Cost Optimization via Hardware-Software Disaggregation
- 4.2.4 AI and Machine Learning Workloads Demand Low-Latency Fabrics
- 4.2.5 Sustainability Targets Driving Energy-Efficient Switching
- 4.2.6 Open Source NOS Ecosystem Maturation
- 4.3 Market Restraints
- 4.3.1 Integration and Operational Complexity for Network Teams
- 4.3.2 Limited Vendor Support and Warranty Ecosystem
- 4.3.3 Supply Chain Volatility of Merchant Silicon
- 4.3.4 Security Concerns in Open Networking Environments
- 4.4 Industry Supply-Chain Analysis
- 4.5 Regulatory Landscape
- 4.6 Technological Outlook
- 4.7 Impact of Macroeconomic Factors on the Market
- 4.8 Porter's Five Forces Analysis
- 4.8.1 Threat of New Entrants
- 4.8.2 Bargaining Power of Suppliers
- 4.8.3 Bargaining Power of Buyers
- 4.8.4 Threat of Substitutes
- 4.8.5 Competitive Rivalry
5 MARKET SIZE AND GROWTH FORECASTS (VALUE)
- 5.1 By Port Speed
- 5.1.1 10/25 GbE
- 5.1.2 40 GbE
- 5.1.3 100 GbE
- 5.1.4 200/400 GbE
- 5.1.5 800 GbE
- 5.2 By Switch Layer
- 5.2.1 Access Switches
- 5.2.2 Distribution Switches
- 5.2.3 Core Switches
- 5.3 By End User Industry
- 5.3.1 Cloud Service Providers
- 5.3.2 Telecom Operators
- 5.3.3 Enterprises
- 5.3.4 Government & Public Sector
- 5.4 By Deployment Environment
- 5.4.1 Hyperscale Data Centers
- 5.4.2 Enterprise Data Centers
- 5.4.3 Edge Data Centers
- 5.5 By Network Operating System (NOS)
- 5.5.1 SONiC
- 5.5.2 Cumulus Linux
- 5.5.3 Pica8 PicOS
- 5.5.4 Other NOS
- 5.6 By Component
- 5.6.1 Hardware
- 5.6.2 Network Operating System (NOS)
- 5.6.3 Services
- 5.7 By Geography
- 5.7.1 North America
- 5.7.1.1 United States
- 5.7.1.2 Canada
- 5.7.1.3 Mexico
- 5.7.2 South America
- 5.7.2.1 Brazil
- 5.7.2.2 Argentina
- 5.7.2.3 Rest of South America
- 5.7.3 Europe
- 5.7.3.1 Germany
- 5.7.3.2 United Kingdom
- 5.7.3.3 France
- 5.7.3.4 Italy
- 5.7.3.5 Spain
- 5.7.3.6 Russia
- 5.7.3.7 Rest of Europe
- 5.7.4 Asia-Pacific
- 5.7.4.1 China
- 5.7.4.2 Japan
- 5.7.4.3 India
- 5.7.4.4 South Korea
- 5.7.4.5 Australia
- 5.7.4.6 Rest of Asia-Pacific
- 5.7.5 Middle East
- 5.7.5.1 Saudi Arabia
- 5.7.5.2 United Arab Emirates
- 5.7.5.3 Turkey
- 5.7.5.4 Rest of Middle East
- 5.7.6 Africa
- 5.7.6.1 South Africa
- 5.7.6.2 North Africa
- 5.7.6.3 Rest of Africa
- 5.7.1 North America
6 COMPETITIVE LANDSCAPE
- 6.1 Market Concentration
- 6.2 Strategic Moves
- 6.3 Market Share Analysis
- 6.4 Company Profiles (includes Global Level Overview, Market Level Overview, Core Segments, Financials as available, Strategic Information, Market Rank/Share, Products and Services, Recent Developments)
- 6.4.1 Accton Technology Corporation
- 6.4.2 Quanta Cloud Technology Inc.
- 6.4.3 Hon Hai Precision Industry Co., Ltd.
- 6.4.4 Celestica Inc.
- 6.4.5 Delta Electronics, Inc.
- 6.4.6 Alpha Networks Inc.
- 6.4.7 Edgecore Networks Corporation
- 6.4.8 Asterfusion Data Technologies Co., Ltd.
- 6.4.9 Lanner Electronics Inc.
- 6.4.10 Wistron Corporation
- 6.4.11 Inventec Corporation
- 6.4.12 Super Micro Computer, Inc.
- 6.4.13 MiTAC Holdings Corporation
- 6.4.14 Netberg Ltd.
- 6.4.15 Interface Masters Technologies, Inc.
- 6.4.16 UfiSpace Co., Ltd.
- 6.4.17 Radisys Corporation
- 6.4.18 Advantech Co., Ltd.
- 6.4.19 Silicom Ltd.
- 6.4.20 Flex Ltd.
7 MARKET OPPORTUNITIES AND FUTURE OUTLOOK
- 7.1 White-space and Unmet-need Assessment

 寬頻擴大機市場規模、佔有率和成長分析:按擴大機類型、頻寬、應用、最終用戶、安裝方式和地區分類-2026-2033年產業預測
 串行設備伺服器市場規模、佔有率、成長率、全球產業分析、區域趨勢以及 2026 年至 2034 年的預測。
 軟交換設備市場:全球市場預測,2026-2032年
 訊號放大器市場規模、佔有率和成長分析:按產品類型、網路技術、覆蓋範圍、安裝類型、最終用戶和地區分類-2026-2033年產業預測
 CityLoop網路市場預測至2034年—按網路類型、部署模式、技術、應用、最終用戶和區域分類的全球分析
 軟交換設備市場規模、佔有率和成長分析:依架構分類、服務元件配置、部署基礎設施模型、用戶數量和地區分類-2026-2033年產業預測
 串列設備伺服器:市場佔有率分析、產業趨勢與統計資料、成長預測(2026-2031 年)通訊網路視覺化解決方案市場預測至2034年—按組件、部署模式、技術、應用、最終用戶和地區分類的全球分析
 2026年全球網際網路協定(IP)網路市場報告2026年全球核心網路設備市場報告