


 |
市場調查報告書
商品編碼
2073108
ESG分析與標竿平台:市場佔有率分析、產業趨勢與統計、成長預測(2026-2031年)ESG Analytics and Benchmarking Platform - Market Share Analysis, Industry Trends & Statistics, Growth Forecasts (2026 - 2031) |
||||||

※ 本網頁內容可能與最新版本有所差異。詳細情況請與我們聯繫。
根據 Mordor Intelligence 預測,ESG 分析和基準平台市場規模預計將在 2025 年達到 41.6 億美元,2026 年達到 48 億美元,到 2031 年達到 105.1 億美元,2026 年至 2031 年的複合年成長率為 16.97%。
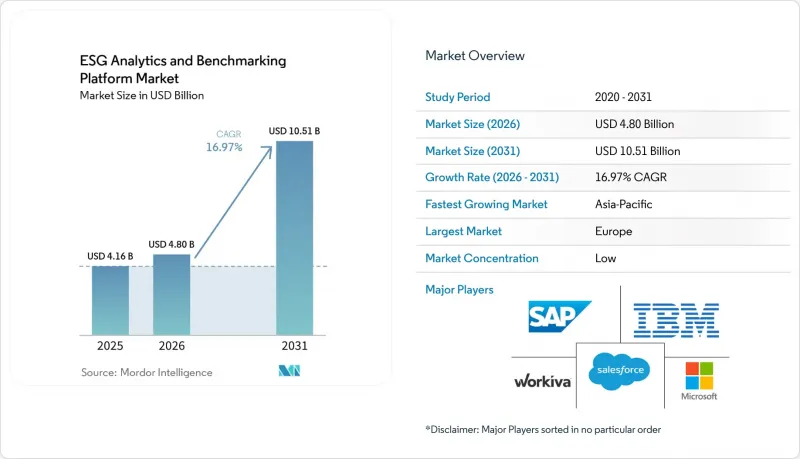
本報告按部署類型(雲端部署、本地部署、混合部署)、交付類型(軟體平台和服務)、企業規模(大型企業、中小企業)、最終用戶產業(IT和電信、銀行、金融服務和保險、工業製造、能源和公共產業等)以及地區進行細分。市場預測以美元計價。
全球ESG分析與標竿平台市場趨勢及洞察
對可審計的ESG資訊揭露的需求日益成長
隨著報告要求的日益嚴格,ESG軟體正從單純的資訊揭露支援工具轉型為管理報告的作業系統。企業現在需要能夠支援常規提交週期、內部審核和外部鑑證的工作流程,而無需依賴手動電子表格匯總。這種轉變對ESG分析和基準測試平台市場至關重要,因為監管壓力不僅影響直接報告的公司,還影響跨國公司以及與受監管營業單位相關的供應商網路。雖然在報告規則較為成熟的地區,由此產生的需求最為強勁,但類似的採購邏輯正在全球範圍內蔓延,這些企業尋求的是單一的、管治的數據層,而不是本地的、臨時性的解決方案。這也提升了能夠在單一環境中處理雙重重要性評估、版本控制和框架映射的平台的價值。隨著資訊揭露與財務報告的連結日益緊密,採購討論的焦點也從任意的ESG工具轉向可審計的資料基礎設施。
利用人工智慧技術對片段化的ESG數據進行標準化
當企業需要清理、整理和協調跨系統和營業單位的不一致的永續發展數據時,人工智慧的角色尤其突出。這在ESG分析和基準測試平台市場中尤其重要,因為分散的輸入資料仍然限制了基準測試的質量,尤其是在企業需要進行跨境或跨業務部門比較時。 IBM在2026年對其Envizi產品進行了更新,擴展了這一標準化層,新增了對Excel中排放計算的支持,以及符合修訂後報告要求的新框架設置。這些措施表明,供應商正努力將ESG運算緊密整合到核心業務工作流程中,同時減輕與更新相關的營運負擔。這也解釋了為什麼人工智慧和內建運算工具正在將競爭焦點從單純的資料收集轉移到輔助資料解讀、基準測試和情境分析。隨著這些功能的成熟,改進範圍3覆蓋所需的時間和成本正在降低。
私營供應商在ESG數據方面存在品質差距
ESG分析和基準測試平台市場最大的營運弱點仍然是上游供應商的數據品質。根據經合組織2025年發布的一項分析,在關鍵產品中,僅有7%的ESG指標直接涉及供應鏈風險管理,而68%的績效指標仍基於輸入資料且具有定性特徵。 Sage在2025年12月的一項調查發現,只有32%的中小企業建立了永續發展報告基礎設施,其中62%的企業認為「複雜性」是正式報告的主要障礙。這種情況意義重大,因為儘管小規模供應商在企業的價值鏈中佔據很大比例,但許多企業仍然缺乏能夠產生可審計ESG數據的系統。因此,平台供應商被迫更加依賴估算模型、供應商互動模組和資料品管,導致產品複雜性增加,服務交付負擔加重。在上游報告結構成熟之前,基準測試的準確性在許多客戶環境中仍將難以保證。
細分市場分析
到2025年,基於雲端的ESG分析和基準測試平台市佔率將達到66.12%。這項領先優勢體現了雲端交付模式的優勢,該模式允許企業透過持續的產品發布來適應監管變化,而無需進行一次性的內部IT變更。企業正在利用雲端環境調整揭露邏輯、基準測試和排放運算,以符合不斷變化的報告架構。這使得雲端成為ESG分析和基準測試平台市場中尋求更快部署和更便利更新周期的買家的首選。
預計2026年至2031年間,混合部署將以17.25%的複合年成長率成長。這一成長反映了這樣一個現實:敏感的員工資料、薪資資料和社會資料並非總是能遷移到單一的公共雲端環境。跨國公司通常需要在維護集中式基準測試和資訊揭露管理的同時,對受限資料進行本地處理。這種平衡預計將使混合部署成為ESG分析和基準測試平台市場中成長最快的部署模式。
到2025年,軟體平台將佔據ESG分析和基準測試平台市場69.45%的佔有率。企業更傾向於可配置的平台,這些平台能夠在一個統一的管治環境下整合ESG資料管理、資訊揭露工作流程和基準測試結果。隨著報告要求與財務和合規管理日益緊密結合,這一趨勢愈發明顯。因此,審計追蹤、工作流程核准和用戶級存取控制等功能鞏固了軟體在ESG分析和基準測試平台市場的主導地位。
預計2026年至2031年,服務業的複合年成長率將達到17.05%。這一成長反映了在ERP、採購、人力資源、供應商和設施等資料來源中同時實施ESG系統的複雜性。許多公司仍需要協助將其內部資料對應到CSRD、GRI、SASB、CDP和ISSB等框架。此外,許多組織缺乏內部報告能力來獨立完成全面的實施和框架轉換,從而導致對相關服務的需求增加。
區域分析
2025年,歐洲佔了ESG分析和基準平台市場34.56%的佔有率。該地區的領先地位源於大型企業中法律約束性揭露規則、買方期望和報告結構的最強組合。這種環境推動了對能夠管理常規報告週期、確保保證準備就緒並保證一致性的平台的需求。該地區的市場也受益於供應鏈效應,因為受監管的大型企業正在將結構化的ESG資料要求擴展到更廣泛的供應商群體。慕尼黑工商會(IHK Munich)在2026年指出,即使許多不在CSRD直接監管範圍內的公司,仍將繼續透過其客戶關係面臨間接的報告要求。
2025年,北美在ESG分析和基準測試平台市場仍佔據顯著佔有率。企業應對氣候變遷報告的需求、投資者的密切關注以及歐洲資訊揭露要求對全球企業的域外適用性,推動了該地區的需求成長。總部位於美國的跨國公司若在歐洲企業發展、上市或擁有供應商關係,則被迫加強其報告體系,即便當地法規並不統一。這促進了需要同時遵守多個報告體系的公司採用該平台。南美市場仍處於起步階段,其中巴西主要上市公司的需求成長最為強勁,而其他南美市場則處於更為漸進的採用階段。
預計亞太地區在2026年至2031年間將以17.45%的複合年成長率成長,成為ESG分析和基準平台市場中成長最快的區域市場。這一成長動能反映了企業營運中永續發展理念的更廣泛融合,而非僅依賴單一的監管因素。世界大型企業聯合會在2026年報告中指出,亞太地區的企業主管比全球同業更重視企業永續發展,預計到2026年,該地區超過50%的企業將全面整合其永續發展活動,高於2025年的36%。中東和非洲地區也持續成長,儘管其基數小規模,但得益於各國永續發展政策、投資者篩檢要求以及出口導向企業面臨的買方主導的供應鏈報告要求,該地區的成長勢頭依然強勁。
其他好處:
- Excel格式的市場預測(ME)表
- 3個月的分析師支持
目錄
第1章:引言
- 研究假設和市場定義
- 調查範圍
第2章:調查方法
第3章執行摘要
第4章 市場狀況
- 市場概覽
- 市場促進因素
- 對可審計的ESG資訊揭露的需求日益成長
- 採購主導的供應商ESG篩檢
- 利用人工智慧實現碎片化ESG數據的標準化
- 投資者要求ESG評分具有可比性
- 在報表工作流程中引入“雙重重要性”
- 與企業風險管理系統和財務系統的整合
- 市場限制因素
- 私營供應商在ESG數據方面存在品質差距
- 評級模型和基準模型的調查方法有差異
- 中型企業面臨的實施負擔
- 不同司法管轄區之間的法規差異
- 宏觀經濟因素對市場的影響
- 產業價值/價值鏈分析
- 監理情勢
- 技術展望
- 波特五力分析
第5章 市場規模與成長預測
- 部署模式
- 基於雲端的
- 現場
- 混合
- 報價
- 軟體平台
- 服務
- 按公司規模
- 大公司
- 小型企業
- 按最終用途行業分類
- IT/通訊
- BFSI
- 工業製造
- 能源公用事業
- 石油和天然氣
- 零售與電子商務
- 食品飲料製造業
- 建築和基礎設施
- 政府/公共部門
- 其他終端用戶產業
- 按地區
- 北美洲
- 美國
- 加拿大
- 墨西哥
- 南美洲
- 巴西
- 阿根廷
- 其他南美國家
- 歐洲
- 德國
- 英國
- 法國
- 義大利
- 西班牙
- 俄羅斯
- 其他歐洲國家
- 亞太地區
- 中國
- 印度
- 日本
- 韓國
- 澳洲
- 其他亞太國家
- 中東和非洲
- 中東
- 沙烏地阿拉伯
- 阿拉伯聯合大公國
- 其他中東國家
- 非洲
- 南非
- 奈及利亞
- 其他非洲國家
- 中東
- 北美洲
第6章 競爭情勢
- 市場集中度
- 策略趨勢
- 市佔率分析
- 公司簡介
- Microsoft Corporation
- IBM Corporation
- SAP SE
- Salesforce, Inc.
- Wolters Kluwer NV
- Workiva Inc.
- Sphera Solutions, Inc.
- Enablon SAS
- Intelex Technologies ULC
- Diligent Corporation
- Cority Software Inc.
- Nasdaq, Inc.
- EcoVadis SAS
- Ulula Inc.
- Novisto Inc.
- SP Global Inc.
- Moody's Corporation
- LSEG Data and Analytics,
- Gensuite LLC
- Persefoni AI, Inc.
第7章 市場機會與未來展望
According to Mordor Intelligence, the ESG analytics and benchmarking platform market size is projected to be USD 4.16 billion in 2025, USD 4.80 billion in 2026, and reach USD 10.51 billion by 2031, growing at a CAGR of 16.97% from 2026 to 2031.
This report is Segmented by Deployment Mode (Cloud-Based, On-Premises, and Hybrid), Offering (Software Platforms, and Services), Enterprise Size (Large Enterprises, and Small and Medium-Sized Enterprises), End-Use Industry (IT and Telecom, BFSI, Industrial Manufacturing, Energy and Utilities, and More), and Geography. The Market Forecasts are Provided in Terms of Value (USD).
Global ESG Analytics and Benchmarking Platform Market Trends and Insights
Rising Demand for Auditable ESG Disclosures
Mandatory reporting is changing ESG software from a disclosure support tool into an operating system for controlled reporting. Companies now need workflows that can support recurring filing cycles, internal review, and external assurance without relying on manual spreadsheet consolidation. That shift is important for the ESG analytics and benchmarking platform market because regulatory pressure now affects not only direct reporters but also multinational groups and supplier networks tied to in-scope entities. The resulting demand is strongest where reporting rules are more mature, but the same buying logic is spreading across global operations that want a single, governed data layer rather than local workarounds. This is also raising the value of platforms that can handle dual materiality, version control, and framework mapping in a single environment. As disclosure moves closer to financial reporting, the buying conversation is shifting from optional ESG tooling to an auditable data infrastructure.
AI-Enabled Normalization of Fragmented ESG Data
AI is becoming most useful where companies need to clean, structure, and reconcile inconsistent sustainability data across systems and entities. In the ESG analytics and benchmarking platform market, that matters because fragmented inputs still limit benchmark quality, especially when enterprises need cross-border or multi-business-unit comparisons. IBM expanded this normalization layer in 2026 through Envizi product updates that supported emissions calculations in Excel and new framework configurations tied to revised reporting needs. Those moves show how vendors are trying to reduce the operational burden of updates while keeping ESG calculations closer to core business workflows. They also show why AI and embedded calculation tools are pushing competition away from simple data capture and toward interpretation, benchmarking, and scenario support. As these capabilities mature, the time and cost required to improve Scope 3 coverage are declining.
ESG Data Quality Gaps Across Private Suppliers
The biggest operating weakness in the ESG analytics and benchmarking platform market is still the quality of upstream supplier data. An OECD analysis published in 2025 found that only 7% of ESG metrics across major products directly addressed supply-chain risk management, while 68% of performance metrics remained input-based and qualitative. A December 2025 Sage study added that only 32% of SMEs had sustainability reporting infrastructure in place, and 62% identified complexity as the main barrier to formal reporting. These conditions matter because small suppliers account for a large share of enterprise value chains, yet many still lack systems capable of producing auditable ESG data. That forces platform vendors to rely more heavily on estimation models, supplier engagement modules, and data quality controls, which raises product complexity and service effort. Until upstream reporting maturity improves, benchmarking depth will remain uneven across many customer environments.
Other drivers and restraints analyzed in the detailed report include:
- Investor Pressure for Comparable ESG Scores
- Procurement-Led Supplier ESG Screening
- Methodology Drift Across Rating and Benchmarking Models
For complete list of drivers and restraints, kindly check the Table Of Contents.
Segment Analysis
Cloud-based deployment accounted for 66.12% of the ESG analytics and benchmarking platform market in 2025. That lead reflects the advantage of delivery models that can absorb regulatory updates through ongoing product releases rather than through one-time internal IT changes. Companies are using cloud environments to keep disclosure logic, benchmark settings, and emissions calculations aligned with changing reporting frameworks. This has made the cloud the default option for buyers who want faster implementation and easier update cycles across the ESG analytics and benchmarking platform market.
Hybrid deployment is projected to expand at 17.25% CAGR from 2026 to 2031. This growth reflects the reality that sensitive workforce, compensation, and social data cannot always move into a single public cloud environment. Multinational companies often need local handling for restricted data while still using centralized benchmarking and disclosure controls. That balance is expected to keep hybrid as the fastest-growing deployment pattern in the ESG analytics and benchmarking platform market.
Software platforms accounted for 69.45% of the ESG analytics and benchmarking platform market in 2025. Enterprises favored configurable platforms that could bring together ESG data management, disclosure workflows, and benchmarking outputs in a single, governed environment. This preference strengthened as reporting expectations moved closer to finance and compliance controls. Audit trails, workflow approvals, and user-level access controls therefore support the leading position of software in the ESG analytics and benchmarking platform market.
Services are projected to grow at 17.05% CAGR from 2026 to 2031. This expansion reflects the complexity of implementing ESG systems across ERP, procurement, HR, supplier, and facility data sources simultaneously. Many companies still need support to map internal data to frameworks such as CSRD, GRI, SASB, CDP, and ISSB. Services are also gaining because many organizations still lack enough in-house reporting depth to manage full deployment and framework translation on their own.
Complete Report Scope:
- By Deployment Mode
- Cloud-Based
- On-Premises
- Hybrid
- By Offering
- Software Platforms
- Services
- By Enterprise Size
- Large Enterprises
- Small and Medium Enterprises
- By End-Use Industry
- IT and Telecom
- BFSI
- Industrial Manufacturing
- Energy and Utilities
- Oil and Gas
- Retail and E-Commerce
- Food and Beverage Manufacturing
- Construction and Infrastructure
- Government and Public Sector
- Other End-User Industries
- By Geography
- North America
- United States
- Canada
- Mexico
- South America
- Brazil
- Argentina
- Rest of South America
- Europe
- Germany
- United Kingdom
- France
- Italy
- Spain
- Russia
- Rest of Europe
- Asia-Pacific
- China
- India
- Japan
- South Korea
- Australia
- Rest of Asia-Pacific
- Middle East and Africa
- Middle East
- Saudi Arabia
- United Arab Emirates
- Rest of Middle East
- Africa
- South Africa
- Nigeria
- Rest of Africa
- Middle East
- North America
Geography Analysis
Europe held 34.56% of the ESG analytics and benchmarking platform market share in 2025. The region led because it had the strongest mix of enforceable disclosure rules, buyer expectations, and reporting discipline across large enterprises. That environment supported demand for platforms that could manage recurring reporting cycles, assurance preparation, and benchmark consistency. The regional market also benefits from supply-chain effects because large in-scope companies pass structured ESG data requirements to a much wider supplier base. IHK Munchen noted in 2026 that many firms removed from direct CSRD scope would still face indirect reporting demands through customer relationships.
North America also accounted for a meaningful share of the ESG analytics and benchmarking platform market in 2025. Enterprise climate reporting needs, investor scrutiny, and the extraterritorial effect of European disclosure requirements on global companies have driven demand in the region. U.S.-based multinationals with operations, listings, or supplier links in Europe have had to strengthen their reporting systems, even where local rules were less uniform. This has supported platform adoption among companies that need to work across multiple reporting regimes simultaneously. South America remained at an earlier stage, with Brazil leading demand among large listed companies, while other South American markets stayed in a more gradual adoption phase.
Asia-Pacific is projected to expand at a 17.45% CAGR from 2026 to 2031, making it the fastest-growing regional segment in the ESG analytics and benchmarking platform market. The region's momentum reflects a broader rise in sustainability integration across business operations rather than reliance on a single regulatory trigger. The Conference Board reported in 2026 that Asia-Pacific executives placed greater emphasis on corporate sustainability than global peers, and that 50% or more of businesses in the region were expected to have fully integrated sustainability operations by 2026, up from 36% in 2025. The Middle East and Africa are also growing from a smaller base, supported by national sustainability agendas, investor screening requirements, and buyer-led supply-chain reporting requests for export-facing companies.
- Microsoft Corporation
- IBM Corporation
- SAP SE
- Salesforce, Inc.
- Wolters Kluwer N.V.
- Workiva Inc.
- Sphera Solutions, Inc.
- Enablon SAS
- Intelex Technologies ULC
- Diligent Corporation
- Cority Software Inc.
- Nasdaq, Inc.
- EcoVadis SAS
- Ulula Inc.
- Novisto Inc.
- SP Global Inc.
- Moody's Corporation
- LSEG Data and Analytics,
- Gensuite LLC
- Persefoni AI, Inc.
Additional Benefits:
- The market estimate (ME) sheet in Excel format
- 3 months of analyst support
TABLE OF CONTENTS
1 INTRODUCTION
- 1.1 Study Assumptions and Market Definition
- 1.2 Scope of the Study
2 RESEARCH METHODOLOGY
3 EXECUTIVE SUMMARY
4 MARKET LANDSCAPE
- 4.1 Market Overview
- 4.2 Market Drivers
- 4.2.1 Rising Demand for Auditable ESG Disclosures
- 4.2.2 Procurement-Led Supplier ESG Screening
- 4.2.3 AI-Enabled Normalization of Fragmented ESG Data
- 4.2.4 Investor Pressure for Comparable ESG Scores
- 4.2.5 Double Materiality Adoption in Reporting Workflows
- 4.2.6 Integration With Enterprise Risk and Finance Systems
- 4.3 Market Restraints
- 4.3.1 ESG Data Quality Gaps Across Private Suppliers
- 4.3.2 Methodology Drift Across Rating and Benchmarking Models
- 4.3.3 High Implementation Burden for Mid-Market Firms
- 4.3.4 Regulatory Fragmentation Across Jurisdictions
- 4.4 Impact of Macroeconomic Factors on the Market
- 4.5 Industry Value / Supply-Chain Analysis
- 4.6 Regulatory Landscape
- 4.7 Technological Outlook
- 4.8 Porter's Five Forces Analysis
- 4.8.1 Threat of New Entrants
- 4.8.2 Bargaining Power of Suppliers
- 4.8.3 Bargaining Power of Buyers
- 4.8.4 Threat of Substitutes
- 4.8.5 Intensity Of Competitive Rivalry
5 MARKET SIZE AND GROWTH FORECASTS (VALUE)
- 5.1 By Deployment Mode
- 5.1.1 Cloud-Based
- 5.1.2 On-Premises
- 5.1.3 Hybrid
- 5.2 By Offering
- 5.2.1 Software Platforms
- 5.2.2 Services
- 5.3 By Enterprise Size
- 5.3.1 Large Enterprises
- 5.3.2 Small and Medium Enterprises
- 5.4 By End-Use Industry
- 5.4.1 IT and Telecom
- 5.4.2 BFSI
- 5.4.3 Industrial Manufacturing
- 5.4.4 Energy and Utilities
- 5.4.5 Oil and Gas
- 5.4.6 Retail and E-Commerce
- 5.4.7 Food and Beverage Manufacturing
- 5.4.8 Construction and Infrastructure
- 5.4.9 Government and Public Sector
- 5.4.10 Other End-User Industries
- 5.5 By Geography
- 5.5.1 North America
- 5.5.1.1 United States
- 5.5.1.2 Canada
- 5.5.1.3 Mexico
- 5.5.2 South America
- 5.5.2.1 Brazil
- 5.5.2.2 Argentina
- 5.5.2.3 Rest of South America
- 5.5.3 Europe
- 5.5.3.1 Germany
- 5.5.3.2 United Kingdom
- 5.5.3.3 France
- 5.5.3.4 Italy
- 5.5.3.5 Spain
- 5.5.3.6 Russia
- 5.5.3.7 Rest of Europe
- 5.5.4 Asia-Pacific
- 5.5.4.1 China
- 5.5.4.2 India
- 5.5.4.3 Japan
- 5.5.4.4 South Korea
- 5.5.4.5 Australia
- 5.5.4.6 Rest of Asia-Pacific
- 5.5.5 Middle East and Africa
- 5.5.5.1 Middle East
- 5.5.5.1.1 Saudi Arabia
- 5.5.5.1.2 United Arab Emirates
- 5.5.5.1.3 Rest of Middle East
- 5.5.5.2 Africa
- 5.5.5.2.1 South Africa
- 5.5.5.2.2 Nigeria
- 5.5.5.2.3 Rest of Africa
- 5.5.5.1 Middle East
- 5.5.1 North America
6 COMPETITIVE LANDSCAPE
- 6.1 Market Concentration
- 6.2 Strategic Moves
- 6.3 Market Share Analysis
- 6.4 Company Profiles (includes Global Level Overview, Market Level Overview, Core Segments, Financials as available, Strategic Information, Market Rank/Share, Products and Services, Recent Developments)
- 6.4.1 Microsoft Corporation
- 6.4.2 IBM Corporation
- 6.4.3 SAP SE
- 6.4.4 Salesforce, Inc.
- 6.4.5 Wolters Kluwer N.V.
- 6.4.6 Workiva Inc.
- 6.4.7 Sphera Solutions, Inc.
- 6.4.8 Enablon SAS
- 6.4.9 Intelex Technologies ULC
- 6.4.10 Diligent Corporation
- 6.4.11 Cority Software Inc.
- 6.4.12 Nasdaq, Inc.
- 6.4.13 EcoVadis SAS
- 6.4.14 Ulula Inc.
- 6.4.15 Novisto Inc.
- 6.4.16 SP Global Inc.
- 6.4.17 Moody's Corporation
- 6.4.18 LSEG Data and Analytics,
- 6.4.19 Gensuite LLC
- 6.4.20 Persefoni AI, Inc.
7 MARKET OPPORTUNITIES AND FUTURE OUTLOOK
- 7.1 White-space and Unmet-Need Assessment

 永續績效提升市場:全球市場預測,2026-2032年
 ESG軟體:市場佔有率分析、產業趨勢與統計、成長預測(2026-2031年)
 空間法律與管治市場規模、佔有率及成長分析:按服務類型、應用、客戶類型、提供者和地區分類-2026-2033年產業預測
 本報告概述了 ESG評級服務市場,包括其規模、佔有率、成長、全球產業分析、區域趨勢以及 2026-2034 年的預測。
 環境績效管理市場預測至2034年-按組件、部署模式、技術、應用、最終用戶和地區分類的全球分析
 2026年全球環境、社會與管治(ESG)關聯保險市場報告2026年全球太空法與管治市場報告
 ESG風險管理市場分析及預測(至2035年):依類型、產品類型、服務、技術、組件、應用、部署類型、最終用戶及解決方案分類ESG投資市場規模、佔有率、成長及全球產業分析:按類型、應用和地區分類,並預測至2026-2034年ESG評估服務:市場佔有率分析、產業趨勢與統計、成長預測(2026-2031年)