


 |
市場調查報告書
商品編碼
2072952
上市服務市場:市場佔有率分析、產業趨勢與統計、成長預測(2026-2031 年)Go-to-Market Services - Market Share Analysis, Industry Trends & Statistics, Growth Forecasts (2026 - 2031) |
||||||

※ 本網頁內容可能與最新版本有所差異。詳細情況請與我們聯繫。
據 Mordor Intelligence 稱,市場進入 (GTM) 服務市場預計將從 2025 年的 421 億美元成長到 2026 年的 460.5 億美元,到 2031 年達到 728.5 億美元,預計 2026 年至 2031 年的複合成長率為 9.60%。
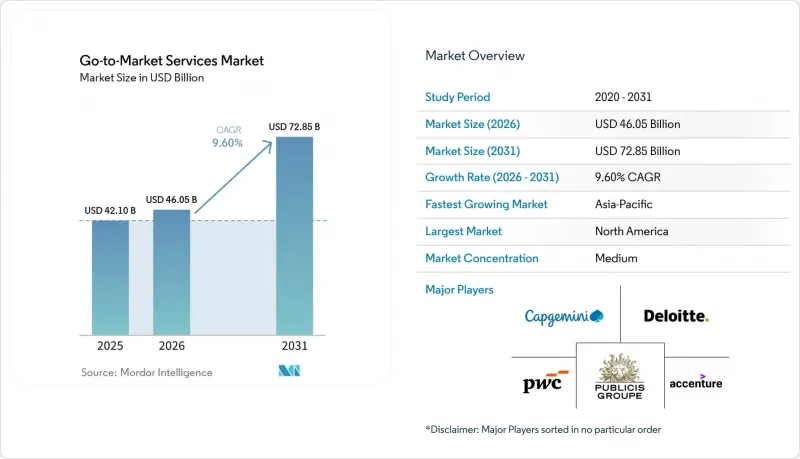
本報告按服務類型(市場進入策略、定位和通訊策略等)、交付模式(現場交付、遠端交付等)、公司規模(大型企業、中型企業等)、最終用戶行業(零售和電子商務、IT和電信、銀行、金融服務和保險等)以及地區進行細分。市場預測以美元計價。
全球市場推廣服務市場趨勢與洞察
人工智慧主導的銷售和行銷轉型
市場進入(GTM)服務市場正經歷著一場比單純的工作流程自動化更深刻的變革。這是因為生成式人工智慧和基於代理的人工智慧正在取代規劃、互動和衡量背後的基本假設。 Forrester 將這種轉變描述為一個轉折點,在這個轉折點上,維持傳統的市場進入結構變得困難重重,尤其是在行銷、銷售和客戶成功部門仍然各自獨立運作,並且對買家進展的定義各不相同的情況下。這種轉變意義重大,因為人工智慧驅動的購買行為降低了傳統需求指標的可靠性。這使得內部團隊難以使用傳統的活動儀表板來證明預算的合理性,而專家顧問則更有可能訂單重新設計衡量方法和建立實施框架的工作。 銷售團隊指出,儘管高階主管們期望生成式人工智慧在銷售領域能夠帶來顯著的收入成長,但最終結果取決於銷售、行銷和服務部門之間的密切合作,而許多組織尚未建立起這樣的框架。此外,安永於2026年3月與Snowflake和Canva合作推出的「基於代理商的編配平台」表明,線索產生、定價支援和合約自動化正被整合到單一的商業工作流程中,這增加了實施的複雜性。在此背景下,市場准入服務市場更重視那些能夠將人工智慧編配與實際創收營運結合的供應商,而不是那些僅提供孤立工具或短期實驗性支援的供應商。
對全通路採購與銷售整合的需求
此外,B2B採購活動在更多管道和資訊來源上的擴展,以及買家對一致性而非分散化體驗日益成長的期望,也為市場推廣(GTM)服務市場提供了強勁的推動力。 Gartner在其2026年5月發布的報告中指出,買家在採購時會使用多種資訊來源,其中45%的買家在最近一次交易中使用了人工智慧產生的信息,而69%的買家仍然會在關鍵階段諮詢銷售負責人以驗證人工智慧產生的資訊。這項發現凸顯了一個簡單的商業性現實:儘管數位化自助服務正在擴展,但隨著交易規模的擴大、技術要素的增強以及風險的增加,人工檢驗的需求並不會消失。 Hokodo的研究發現,歐洲B2B負責人希望擁有多種不同的銷售管道,並期望獲得快速、簡單且準確的數位體驗。這推動了對能夠將通路、資料流和銷售負責人的準備工作整合為一個整體的GTM專家的需求。 Forrester先前已指出,超過100萬美元的大規模B2B交易中,超過一半將透過數位自助服務管道完成。這意味著,只有在可靠性、合規性和交易結構至關重要的情況下,銷售負責人主導的互動才會出現。因此,市場對能夠全面解決通路架構、營收營運重組和現場能力提升等問題的整合式服務的需求持續成長。
預算削減和企劃為基礎採購
市場推廣(GTM)服務市場持續面臨來自顧客削減開支的壓力。當董事會要求更清晰的收入業績,而營運預算卻依然緊張時,這種趨勢尤其明顯。 Gartner 發布的《2025 年行銷長支出調查》顯示,行銷預算佔企業收入的比例維持在 7.7% 不變,許多行銷長 (CMO) 被要求在資源有限的情況下完成更多工作。在此環境下,許多買家正從無限期長期合約轉向短期、基於里程碑的合約。這要求服務提供者更快證明其價值,並在同一份合約中承擔更大的商業性風險。 Analytical Partners 在 2026 年 2 月發布的報告顯示,高階決策者在預算分配中更重視計量經濟模型和商業分析。這使得那些無法證明其貢獻的 GTM 服務提供者的選擇標準更加嚴格。百事公司在2025年揭露資訊中也證實了類似的效率導向策略,揭露已削減5億美元的廣告支出,以配合各支出類別效率的提升。在市場推廣服務市場,這不會消除需求,但合約規模將會縮小,核准週期將會延長,供應商將被要求在銷售點提供更清晰的投資報酬率。
細分市場分析
2025年,需求創造和潛在客戶開發佔市場進入(GTM)服務市場佔有率的25.67%。這表明,儘管購買行為變得不再線性,對傳統推廣模式的反應速度也有所放緩,但通路建設仍然是預算分配的重中之重。由於董事會持續從通路覆蓋率、成交率和交易流程透明度等方面評估銷售團隊,這部分業務組合仍保持強勁勢頭。所有這些都使得對銷售漏斗上游階段的支援始終處於支出決策的核心位置。在更廣泛的市場進入服務業中,市場進入策略和市場進入、定位和通訊以及產品發布和商業化繼續發揮著至關重要的作用。這是因為企業需要幫助將人工智慧驅動的提案轉化為清晰的商業性故事。此外,隨著人們越來越傾向於重新思考結合直接和間接銷售的混合管道,與通路合作夥伴和分銷策略相關的工作也變得日益重要。由於數位化自助服務與現有合作夥伴模式的結合,這種混合管道的管理難度越來越高。雖然「其他」部分規模較小,但它涵蓋了商業性重要的任務,例如在人工智慧驅動的環境中影響購買管道、重新評估定位以及支援分析師關係。
預計到2031年,銷售賦能和上市支援將以15.86%的複合年成長率成長,並有望成為上市服務市場中成長最快的服務類型,因為客戶正從採購工具轉向實施支援。 ZS在2026年IDC MarketScape「生命科學研發策略諮詢」報告中的定位,以及其更廣泛的商業人工智慧服務,顯示賦能不再局限於內容庫和培訓課程。 Highspot在生命科學和醫療保健領域的人工智慧銷售賦能表明,輔導、情境化內容傳送和工作流程整合正成為更深入整合的準備模型的一部分。核心挑戰在於,許多公司部署平台的速度超過了管理人員和銷售負責人的吸收速度,導致對行為改變、流程設計和管理人員主導的採納支援方面的外部支援需求增加。事實上,在市場准入服務市場,賦能的成長速度超過了整體市場,因為實施和執行的規範性已變得比僅僅獲得軟體存取權更為重要。
至2025年,混合交付模式將佔市場推廣(GTM)服務市場規模的38.81%。這反映出企業持續傾向將現場存取與遠端效率結合的模式,而非依賴單一參與的方式。這種模式對於需要經營團隊信任、快速迭代和切實可行的轉型支援的專案尤其有效,尤其是在專案同時涉及定價、銷售流程、合作夥伴管理和客戶參與時。在風險較高的「作戰室」環境中,現場交付仍然至關重要,有助於協調經營團隊,並能透過研討會和直接的相關人員互動來提升執行質量,從而完成複雜的重新設計工作。遠端交付對於更廣泛的執行支援、中等規模的專案管理以及以分散式協作為標準做法的工作流程仍然十分重要。在所有這些趨勢中,市場推廣(GTM)服務市場更青睞那些能夠靈活調整人員配備和交付模式,同時又不影響速度或課責的供應商。
預計到2031年,託管交付服務將以15.43%的複合年成長率成長,顯示市場進入(GTM)服務市場正從一次性諮詢服務向持續營運支援發生更深層的轉變。麥肯錫於2026年1月與AWS合作推出的這項服務表明,大型企業正在轉向一種將策略規劃、平台執行和可衡量的業務價值相結合的協同轉型模式。這一趨勢反映了客戶對收費系統的需求,這種模式更側重於結果而非時間或人力投入,尤其是在需要持續調整而非一次性建議的人工智慧專案中。託管交付服務還有助於客戶在穩定的服務關係中維護組織內部的專業知識,這在預期收入營運、需求創造和賦能將逐季提升的情況下至關重要。對於服務提供者而言,市場進入(GTM)服務市場重視那些能夠持續營運市場進入能力並根據客戶關鍵績效指標(KPI)展現可衡量成果的公司。
區域分析
到2025年,北美將佔據市場進入(GTM)服務市場佔有率的47.02%,憑藉集中的企業技術需求、人工智慧的早期應用以及大規模的成熟買家部署基礎,使其成為名副其實的收入中心。美國將繼續維持GTM服務市場的最大貢獻者地位,而隨著企業在北美拓展業務並需要在地化的商業性執行,加拿大和墨西哥也將發揮重要的支持作用。近岸外包的趨勢將進一步提升墨西哥的重要性,這將有助於製造和科技公司在需要市場准入支援、合作夥伴發展和本地打入市場策略制定的地方建立和加強區域商業性存在。北美GTM服務市場也將受益於矽谷、紐約和波士頓等中心城市周邊人工智慧原生專家的聚集,將加速服務交付速度並加劇市場競爭。同時,人們對數位廣告和資訊揭露的期望不斷變化,也將增加大規模企業客戶對合規性商業化支援的需求。
歐洲在市場進入(GTM)服務領域仍然是一個成熟且重要的市場,其中德國、英國和法國作為人工智慧應用、全通路重塑和合規商業部署的關鍵需求中心尤為突出。在英國和歐盟營運的公司持續面臨通路和合規的複雜性,尤其是在單一商業模式下協調資料管治、人工智慧法規和跨國擴張計畫時。西班牙和義大利在市場進入支援服務領域蘊藏著尚未開發的機遇,因為當地公司擴大尋求協助,以便在保持國內成本控制的同時拓展到鄰近地區。南美洲的絕對規模仍然較小,但巴西、阿根廷和智利仍然是跨國公司進入市場計劃和數位化主導的國內擴張的重點關注區域。南美洲各地監管差異凸顯了實質審查、定位和在地化工作的重要性,即使專案進度不均衡,專家顧問也能發揮作用。
亞太地區預計到2031年將以14.48%的複合年成長率成長,這主要得益於數位轉型和跨國投資帶來的持續需求,使其成為市場准入支援服務市場成長最快的地區。印度積極採用人工智慧,以及中國作為企業擴張的“目的地”和“起點”,都推動了對本地實施支援、策略夥伴和市場特定通訊的需求成長。日本和新加坡也在塑造該地區的商業機遇,其中日本透過產業政策指南影響規劃週期,而新加坡則作為東南亞企業發展計畫的關鍵樞紐。在中東,阿拉伯聯合大公國、沙烏地阿拉伯和卡達正吸引眾多企業轉型計畫的強勁需求,而非洲雖然仍處於起步階段,但正透過南非、埃及和奈及利亞等市場不斷擴張,這些市場的數位化商業基礎設施和行動優先的購物習慣也在持續改善。
其他好處:
- Excel格式的市場預測(ME)表
- 3個月的分析師支持
目錄
第1章:引言
- 研究假設和市場定義
- 調查範圍
第2章:調查方法
第3章執行摘要
第4章 市場狀況
- 市場概覽
- 市場促進因素
- 人工智慧主導的銷售和行銷轉型
- 對全通路採購與銷售整合的需求
- 跨國業務拓展和本地化的必要性。
- 重新設計人工智慧和訂閱服務的定價和獲利模式
- 代理引擎最佳化和機器可讀報價設計
- 混合(直銷和合作夥伴)管道的管治
- 市場限制因素
- 預算削減和企劃為基礎採購
- 企業內部多技術和人工智慧團隊的興起導致了外包執行的減少。
- 資料管治的差距以及採用基於代理的人工智慧的準備工作不足。
- 銷售管道之間的競爭以及折扣在銷售管道間的流出。
- 宏觀經濟因素對市場的影響
- 產業價值鏈分析
- 監理情勢
- 技術展望
- 波特五力分析
第5章 市場規模與成長預測
- 按服務類型
- 策略與規劃
- 產品上市和商業化
- 通路合作夥伴和分銷策略
- 需求生成和潛在客戶開發
- 銷售賦能與銷售支持
- 其他服務類型
- 按型號提供
- 現場配送
- 遠端交付
- 混合交付
- 託管交付
- 按公司規模
- 大公司
- 中型公司
- 小規模企業
- 產業最終用途
- 零售與電子商務
- 消費品/美容
- 媒體與娛樂
- 資訊科技/通訊
- BFSI
- 醫療保健和生命科學
- 其他終端使用者產業(教育、旅遊和酒店、工業、汽車)
- 按地區
- 北美洲
- 美國
- 加拿大
- 墨西哥
- 南美洲
- 巴西
- 阿根廷
- 智利
- 其他南美國家
- 歐洲
- 德國
- 英國
- 法國
- 義大利
- 西班牙
- 其他歐洲國家
- 亞太地區
- 中國
- 日本
- 印度
- 韓國
- 澳洲
- 其他亞太國家
- 中東
- 阿拉伯聯合大公國
- 沙烏地阿拉伯
- 卡達
- 其他中東國家
- 非洲
- 南非
- 埃及
- 奈及利亞
- 其他非洲國家
- 北美洲
第6章 競爭情勢
- 市場集中度
- 策略趨勢
- 市佔率分析
- 公司簡介
- Deloitte Touche Tohmatsu Limited
- Accenture plc
- PricewaterhouseCoopers International Limited
- Publicis Groupe SA
- Capgemini SE
- International Business Machines Corporation
- Ernst & Young Global Limited
- KPMG International Limited
- Bain & Company, Inc.
- McKinsey & Company, Inc.
- Boston Consulting Group, Inc.
- Simon-Kucher & Partners Strategy & Marketing Consultants GmbH
- ZS Associates, Inc.
- Cognizant Technology Solutions Corporation
- Infosys Limited
- Wipro Limited
- Tata Consultancy Services Limited
- NMS Consulting, Inc.
- Oliver Wyman, Inc.
- P&C Global, LLC
第7章 市場機會與未來展望
According to Mordor Intelligence, the go-to-market services market size is expected to increase from USD 42.1 billion in 2025 to USD 46.05 billion in 2026 and reach USD 72.85 billion by 2031, growing at a CAGR of 9.60% over 2026-2031.
This report is Segmented by Service Type (GTM Strategy and Market Entry, Positioning and Messaging Strategy, and More), Delivery Model (Onsite Delivery, Remote Delivery, and More), Enterprise Size (Large Enterprises, Mid-Sized Enterprises, and More), End-Use Industry (Retail and E-Commerce, IT and Telecom, BFSI, and More), and Geography. The Market Forecasts are Provided in Terms of Value (USD).
Global Go-to-Market Services Market Trends and Insights
AI-Led Sales and Marketing Transformation
The go-to-market services market is being pushed forward by a deeper change than simple workflow automation, because generative and agentic AI are replacing core assumptions behind planning, engagement, and measurement. Forrester described this shift as a point where older go-to-market structures become difficult to sustain, especially when marketing, sales, and customer success still operate on separate systems and separate definitions of buyer progress. This change matters because AI-mediated buying weakens older demand metrics, which makes it harder for internal teams to defend spend using legacy activity dashboards and easier for specialist advisers to win work around measurement redesign and execution discipline. Salesforce highlighted that business leaders expect meaningful revenue gains from generative AI in commercial functions, but those gains depend on tight coordination across sales, marketing, and service, which many organizations still do not have in place. EY's March 2026 launch of an agentic sales orchestration platform with Snowflake and Canva also showed how prospecting, pricing support, and contract automation are now being tied together in a single commercial workflow, raising the complexity of implementation. In this setting, the go-to-market services market is rewarding providers that can connect AI orchestration to real revenue operations, rather than those that only offer isolated tools or short-term experimentation support.
Omnichannel Buying and Sales Alignment Demand
The go-to-market services market is also benefiting from the fact that B2B buying is now spread across more channels, more information sources, and more moments where buyers expect continuity rather than disconnected outreach. Gartner reported in May 2026 that buyers used multiple information sources during a purchase and that 45% had used generative AI in a recent transaction, yet 69% still turned to sales representatives to validate AI-generated information at critical stages. That finding supports a simple commercial reality, digital self-service is expanding, but it does not remove the need for human validation when deals become larger, more technical, or more risky. Hokodo found that European B2B buyers wanted several distinct sales channels and expected digital experiences that were fast, simple, and accurate, which reinforces demand for GTM specialists who can rebuild channel design, data flow, and seller readiness together. Forrester had already signaled that more than half of large B2B transactions above USD 1 million would move through digital self-serve channels, which means seller-led interactions are being reserved for the points where confidence, compliance, and deal structure matter most. As a result, the go-to-market services market is seeing sustained demand for work that spans channel architecture, RevOps redesign, and front-line enablement in one connected program.
Budget Compression and Project-Based Procurement
The go-to-market services market continues to face pressure from tighter client spending, especially when boards demand clearer revenue outcomes while leaving operating budgets constrained. Gartner's 2025 CMO Spend Survey showed that marketing budgets remained stalled at 7.7% of company revenue and that many chief marketing officers were being asked to do more with less. In that environment, many buyers are shifting away from open-ended retainers and toward short, milestone-based engagements that require providers to prove value faster and carry more commercial risk within the same contract. Analytic Partners reported in February 2026 that senior decision-makers were leaning more heavily on econometric models and commercial analytics for budget allocation, which raises the screening threshold for any GTM provider that cannot demonstrate a measurable contribution. PepsiCo reinforced the same efficiency mood when its 2025 disclosures pointed to a USD 500 million advertising reduction tied to productivity gains across spending categories. For the go-to-market services market, this does not remove demand, but it does compress deal size, lengthen approval cycles, and push vendors toward clearer ROI framing at the point of sale.
Other drivers and restraints analyzed in the detailed report include:
- Cross-Border Expansion and Localization Needs
- Pricing and Monetization Redesign for AI and Subscription Offers
- In-House Martech and AI Teams Reducing Outsourced Execution
For complete list of drivers and restraints, kindly check the Table Of Contents.
Segment Analysis
Demand generation and lead generation held 25.67% of the go-to-market services market share in 2025, which shows that pipeline creation remained the first budget priority even as buying behavior became less linear and less responsive to older outreach models. This part of the portfolio stayed resilient because boards continued to judge commercial teams on pipeline coverage, conversion discipline, and deal flow visibility, all of which kept top-of-funnel support central to spending decisions. Within the broader go-to-market service industry, GTM strategy and market entry, positioning and messaging, and product launch and commercialization retained a premium role because enterprises needed help translating AI-enabled offers into clear commercial narratives. Channel partner and distribution strategy work also gained relevance as companies revisited hybrid direct and indirect routes that had become harder to govern once digital self-serve motions were layered onto existing partner models. The others segment remained smaller, but it captured commercially important mandates such as positioning refreshes and analyst relations support that influenced buying pathways in a more AI-mediated environment.
Sales enablement and go-to-sales support is projected to expand at a 15.86% CAGR through 2031, making it the fastest-growing service type in the go-to-market services market as clients shift from tool buying to adoption support. ZS's positioning in the 2026 IDC MarketScape for life sciences R&D strategic consulting and its wider commercial AI offerings point to a market where enablement is no longer limited to content libraries and training sessions. Highspot's documentation around AI sales enablement for life sciences and healthcare shows that coaching, contextual content delivery, and workflow integration are becoming part of a more embedded readiness model. The core issue is that many companies adopted platforms faster than managers and sellers could absorb them, which expanded demand for external support around behavior change, process design, and manager-led reinforcement. In effect, the go-to-market services market is seeing enablement grow faster than the overall category because adoption and execution discipline now matter more than simple software access.
Hybrid delivery accounted for 38.81% of the go-to-market services market size in 2025, reflecting continued enterprise preference for models that combine on-site access with remote efficiency rather than relying on only one mode of engagement. This format works well for mandates that need executive trust, rapid iteration, and hands-on change support, especially when projects touch pricing, sales process, partner management, and customer engagement at the same time. On-site delivery still matters for high-stakes war-room situations, leadership alignment, and complex redesign work where workshops and direct stakeholder management can improve execution quality. Remote delivery remained important for broader execution support, mid-tier program management, and workstreams where distributed collaboration has become operationally normal. Across these patterns, the go-to-market services market favored providers that could flex staffing and delivery design without weakening speed or accountability.
Managed delivery is projected to advance at a 15.43% CAGR through 2031, and this marks a deeper shift in the go-to-market services market from episodic advisory toward recurring operating support. McKinsey's January 2026 launch with AWS showed how major firms are moving toward joint transformation models that link strategic planning to platform execution and measurable business value. That move reflects client demand for fee structures tied more closely to outcomes and less to time and staffing inputs, especially in AI programs that need continuous tuning rather than one-time recommendations. Managed delivery also helps clients keep institutional knowledge inside a stable service relationship, which matters when revenue operations, demand generation, and enablement are expected to improve quarter after quarter. For providers, the go-to-market services market is rewarding those that can operate ongoing GTM functions while proving measurable performance against client KPIs.
Complete Report Scope:
- By Service Type
- Strategy and Planning (includes GTM Strategy, Market Entry, Positioning and Messaging Strategy)
- Product Launch and Commercialization
- Channel Partner and Distribution Strategy
- Demand Generation and Lead Generation
- Sales Enablement and Go-to-Sales Support
- Other Service Types
- By Delivery Model
- Onsite Delivery
- Remote Delivery
- Hybrid Delivery
- Managed Delivery
- By Enterprise Size
- Large Enterprises
- Mid-sized Enterprises
- Small Enterprises
- By End-use Industry
- Retail and E-commerce
- Consumer Goods and Beauty
- Media and Entertainment
- IT and Telecom
- BFSI
- Healthcare and Life Sciences
- Other End-use Industries (Education, Travel and Hospitality, Industrial, Automotive)
- By Geography
- North America
- United States
- Canada
- Mexico
- South America
- Brazil
- Argentina
- Chile
- Rest of South America
- Europe
- Germany
- United Kingdom
- France
- Italy
- Spain
- Rest of Europe
- Asia-Pacific
- China
- Japan
- India
- South Korea
- Australia
- Rest of Asia-Pacific
- Middle East
- United Arab Emirates
- Saudi Arabia
- Qatar
- Rest of Middle East
- Africa
- South Africa
- Egypt
- Nigeria
- Rest of Africa
- North America
Geography Analysis
North America held 47.02% of the go-to-market services market share in 2025, making it the clear revenue center because the region combines dense enterprise technology demand with early AI adoption and a large installed base of sophisticated buyers. The United States remained the largest national contributor in the go-to-market services market, while Canada and Mexico added meaningful support as companies expanded North American operations and needed localized commercial execution. Mexico gained added relevance as nearshoring trends encouraged manufacturing and technology firms to establish or deepen regional commercial footprints that required market entry support, partner development, and local route-to-market planning. The go-to-market services market in North America also benefited from the density of AI-native boutiques around hubs such as Silicon Valley, New York, and Boston, which raised both delivery speed and competitive intensity. At the same time, evolving digital advertising and disclosure expectations increased the need for compliance-aware commercialization support across larger enterprise accounts.
Europe remained a mature but still meaningful part of the go-to-market services market, with Germany, the United Kingdom, and France standing out as the main demand centers for AI adoption, omnichannel redesign, and regulated commercial execution. Companies operating across the UK and EU continued to face channel and compliance complexity, especially when data governance, AI rules, and cross-border expansion plans had to be coordinated in a single commercial model. Spain and Italy represented underpenetrated opportunities in the go-to-market services market because local enterprises increasingly sought support for expansion into neighboring regions while still managing cost discipline at home. South America stayed smaller in absolute terms, but Brazil, Argentina, and Chile remained the main focal points for multinational entry programs and digitally led domestic expansion. Regulatory variability across South America kept diligence, positioning, and localization work important, which preserved room for specialist advisers even when project timing was uneven.
Asia-Pacific is projected to register a 14.48% CAGR through 2031, making it the fastest-growing region in the go-to-market services market as digital transformation and cross-border investment continue to lift demand. India's strong AI adoption profile and China's role as both a destination and a source of commercial expansion are widening the need for local execution support, partner strategy, and market-specific messaging. Japan and Singapore are also shaping the regional opportunity, with one influencing planning cycles through industrial policy guidance and the other acting as a preferred operating base for Southeast Asian commercialization programs. In the Middle East, the UAE, Saudi Arabia, and Qatar are drawing stronger demand from enterprise transformation agendas, while Africa remains earlier stage but is expanding through markets such as South Africa, Egypt, and Nigeria where digital commercial infrastructure and mobile-first buying behavior continue to improve.
- Deloitte Touche Tohmatsu Limited
- Accenture plc
- PricewaterhouseCoopers International Limited
- Publicis Groupe S.A.
- Capgemini SE
- International Business Machines Corporation
- Ernst & Young Global Limited
- KPMG International Limited
- Bain & Company, Inc.
- McKinsey & Company, Inc.
- Boston Consulting Group, Inc.
- Simon-Kucher & Partners Strategy & Marketing Consultants GmbH
- ZS Associates, Inc.
- Cognizant Technology Solutions Corporation
- Infosys Limited
- Wipro Limited
- Tata Consultancy Services Limited
- NMS Consulting, Inc.
- Oliver Wyman, Inc.
- P&C Global, LLC
Additional Benefits:
- The market estimate (ME) sheet in Excel format
- 3 months of analyst support
TABLE OF CONTENTS
1 INTRODUCTION
- 1.1 Study Assumptions and Market Definition
- 1.2 Scope of the Study
2 RESEARCH METHODOLOGY
3 EXECUTIVE SUMMARY
4 MARKET LANDSCAPE
- 4.1 Market Overview
- 4.2 Market Drivers
- 4.2.1 AI-Led Sales and Marketing Transformation
- 4.2.2 Omnichannel Buying and Sales Alignment Demand
- 4.2.3 Cross-Border Expansion and Localization Needs
- 4.2.4 Pricing and Monetization Redesign for AI and Subscription Offers
- 4.2.5 Agent-Engine Optimization and Machine-Readable Offer Design
- 4.2.6 Channel Governance for Hybrid Direct and Partner Routes
- 4.3 Market Restraints
- 4.3.1 Budget Compression and Project-Based Procurement
- 4.3.2 In-House Martech and AI Teams Reducing Outsourced Execution
- 4.3.3 Data Governance and Agentic AI Readiness Gaps
- 4.3.4 Channel Conflict and Discount Leakage Across Routes-to-Market
- 4.4 Impact of Macroeconomic Factors on the Market
- 4.5 Industry Value Chain Analysis
- 4.6 Regulatory Landscape
- 4.7 Technological Outlook
- 4.8 Porter's Five Forces Analysis
- 4.8.1 Bargaining Power of Buyers
- 4.8.2 Bargaining Power of Suppliers
- 4.8.3 Threat of New Entrants
- 4.8.4 Threat of Substitutes
- 4.8.5 Competitive Rivalry
5 MARKET SIZE AND GROWTH FORECASTS (VALUE)
- 5.1 By Service Type
- 5.1.1 Strategy and Planning (includes GTM Strategy, Market Entry, Positioning and Messaging Strategy)
- 5.1.2 Product Launch and Commercialization
- 5.1.3 Channel Partner and Distribution Strategy
- 5.1.4 Demand Generation and Lead Generation
- 5.1.5 Sales Enablement and Go-to-Sales Support
- 5.1.6 Other Service Types
- 5.2 By Delivery Model
- 5.2.1 Onsite Delivery
- 5.2.2 Remote Delivery
- 5.2.3 Hybrid Delivery
- 5.2.4 Managed Delivery
- 5.3 By Enterprise Size
- 5.3.1 Large Enterprises
- 5.3.2 Mid-sized Enterprises
- 5.3.3 Small Enterprises
- 5.4 By End-use Industry
- 5.4.1 Retail and E-commerce
- 5.4.2 Consumer Goods and Beauty
- 5.4.3 Media and Entertainment
- 5.4.4 IT and Telecom
- 5.4.5 BFSI
- 5.4.6 Healthcare and Life Sciences
- 5.4.7 Other End-use Industries (Education, Travel and Hospitality, Industrial, Automotive)
- 5.5 By Geography
- 5.5.1 North America
- 5.5.1.1 United States
- 5.5.1.2 Canada
- 5.5.1.3 Mexico
- 5.5.2 South America
- 5.5.2.1 Brazil
- 5.5.2.2 Argentina
- 5.5.2.3 Chile
- 5.5.2.4 Rest of South America
- 5.5.3 Europe
- 5.5.3.1 Germany
- 5.5.3.2 United Kingdom
- 5.5.3.3 France
- 5.5.3.4 Italy
- 5.5.3.5 Spain
- 5.5.3.6 Rest of Europe
- 5.5.4 Asia-Pacific
- 5.5.4.1 China
- 5.5.4.2 Japan
- 5.5.4.3 India
- 5.5.4.4 South Korea
- 5.5.4.5 Australia
- 5.5.4.6 Rest of Asia-Pacific
- 5.5.5 Middle East
- 5.5.5.1 United Arab Emirates
- 5.5.5.2 Saudi Arabia
- 5.5.5.3 Qatar
- 5.5.5.4 Rest of Middle East
- 5.5.6 Africa
- 5.5.6.1 South Africa
- 5.5.6.2 Egypt
- 5.5.6.3 Nigeria
- 5.5.6.4 Rest of Africa
- 5.5.1 North America
6 COMPETITIVE LANDSCAPE
- 6.1 Market Concentration
- 6.2 Strategic Moves
- 6.3 Market Share Analysis
- 6.4 Company Profiles (includes Global Level Overview, Market Level Overview, Core Segments, Financials as available, Strategic Information, Market Rank/Share, Products and Services, Recent Developments)
- 6.4.1 Deloitte Touche Tohmatsu Limited
- 6.4.2 Accenture plc
- 6.4.3 PricewaterhouseCoopers International Limited
- 6.4.4 Publicis Groupe S.A.
- 6.4.5 Capgemini SE
- 6.4.6 International Business Machines Corporation
- 6.4.7 Ernst & Young Global Limited
- 6.4.8 KPMG International Limited
- 6.4.9 Bain & Company, Inc.
- 6.4.10 McKinsey & Company, Inc.
- 6.4.11 Boston Consulting Group, Inc.
- 6.4.12 Simon-Kucher & Partners Strategy & Marketing Consultants GmbH
- 6.4.13 ZS Associates, Inc.
- 6.4.14 Cognizant Technology Solutions Corporation
- 6.4.15 Infosys Limited
- 6.4.16 Wipro Limited
- 6.4.17 Tata Consultancy Services Limited
- 6.4.18 NMS Consulting, Inc.
- 6.4.19 Oliver Wyman, Inc.
- 6.4.20 P&C Global, LLC
7 MARKET OPPORTUNITIES AND FUTURE OUTLOOK
- 7.1 White-space and unmet-need assessment

 BlockConnect 服務市場預測至 2034 年—按服務類型、部署模式、技術、應用、最終用戶和地區分類的全球分析
 亞太地區IT服務:市場佔有率分析、產業趨勢與統計及成長預測(2026-2031年)
 2026年全球網路整合與部署服務市場報告2026年全球消費科技與服務市場報告2026年全球網路服務市場報告2026年全球電子服務市場報告
 硬體支援服務市場:按服務類型、公司規模、最終用戶產業、硬體類型和地區分類
 大型通訊業者業務與IT服務:全球市場預測(2025-2030)2026年全球網路部署服務市場報告
 IT 服務市場:2026-2032 年全球市場預測(按服務類型、合約模式、最終用戶、組織規模和部署方式分類)