


 |
市場調查報告書
商品編碼
2072763
伺服器虛擬化能源最佳化軟體:市場佔有率分析、產業趨勢與統計及成長預測(2026-2031)Server Virtualization Energy Optimization Software - Market Share Analysis, Industry Trends & Statistics, Growth Forecasts (2026 - 2031) |
||||||

※ 本網頁內容可能與最新版本有所差異。詳細情況請與我們聯繫。
據 Mordor Intelligence 稱,伺服器虛擬化能源最佳化軟體市場在 2025 年的價值為 7.6 億美元,預計到 2031 年將達到 21.1 億美元,而 2026 年為 9 億美元,2026 年至 2031 年預測期內的複合年成長率為 18.58%。
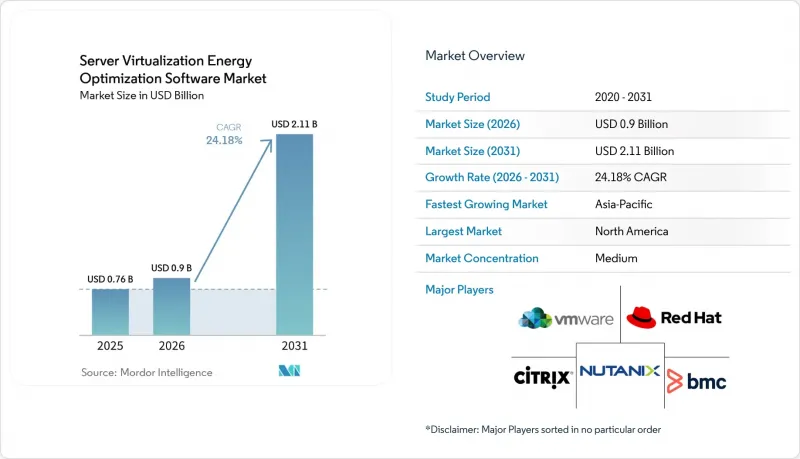
本報告按組件(軟體和服務)、部署模式(雲端、本地部署、混合部署)、企業規模(大型企業、中小企業)、最終用戶行業(工業製造、能源和公共產業、銀行、金融服務和保險、零售和消費品等)以及地區進行細分。市場預測以美元計價。
全球伺服器虛擬化能源最佳化軟體市場趨勢及洞察
虛擬化伺服器環境中更高的功率密度
人工智慧加速器的引入導致每個機架的功耗集中化,使得伺服器虛擬化能耗最佳化軟體市場面臨直接挑戰。國際能源總署 (IEA) 指出,伺服器已佔資料中心電力需求的 60%,並預測到 2030 年伺服器電力消耗量將顯著成長。這項轉變意義重大,因為傳統的靜態部署模型是為通用伺服器環境設計的,無法有效應對混合叢集,在混合集群中,單一支援人工智慧的機架功耗可能超過 30 kW。 2026 年發表在《能源》(Energy) 期刊上的一項研究表明,協調電源、計算和冷卻最佳化可以將資料中心電力消耗降低高達 30.56%,優於恆定氣流系統。隨著機架密度的增加,虛擬機器部署不當的成本成長速度遠超線性成長,這使得伺服器虛擬化能耗最佳化軟體市場與核心營運堆疊緊密相關。
企業對降低資料中心能源成本的興趣日益濃厚
隨著電力成為資料中心營運商的主要營運支出,伺服器虛擬化能源最佳化軟體市場正從中受益,因為買家將能源管理與基礎設施成本降低聯繫起來。即使在正式設定永續發展目標之前,伺服器整合的運轉率依然具有吸引力,因為即使是利用率較低的實體伺服器也會消耗大量的尖峰時段電力。 2026年5月,博通公司宣布VMware Cloud Foundation 9.1引入了智慧記憶體分層和增強的壓縮功能,使混合AI和非AI工作負載叢集的伺服器成本降低了高達40%。根據IBM的報告,Atruvia利用Turbonomic在18個月內淘汰了1000多台實體伺服器,在減少20%硬體面積的同時,降低了能耗和碳排放。這正在推動伺服器虛擬化能源最佳化軟體市場的採購決策,將營運效率、硬體精簡和永續性報告整合到單一的軟體解決方案中。
多重雲端和混合虛擬化堆疊的可見性局限性
隨著工作負載在私有雲和公有雲環境之間遷移,伺服器虛擬化能耗最佳化軟體市場持續面臨視覺性的挑戰。能源、利用率和碳排放資訊通常分散在各個供應商的特定主機中,這削弱了歸因的一致性,也使得檢驗大規模最佳化的有效性變得困難。供應商工具也反映了這種碎片化現象;博通在 VMware 環境中顯示碳排放和能耗儀表板,而 Dynatrace 則透過其自身的觀測層提供成本和碳排放最佳化資訊。當工作負載在同一報告期間內在本地 VMware 和公共雲端之間遷移時,基準假設可能會在測量完成之前變更。在遙測資料在不同環境之間實現更加統一之前,伺服器虛擬化能耗最佳化軟體市場在混合環境中的採用決策將繼續面臨延遲。
細分市場分析
到2025年,軟體將佔據伺服器虛擬化能耗最佳化軟體市場70.12%的佔有率,成為領先的元件細分市場。在伺服器虛擬化能耗最佳化軟體市場,買家仍優先考慮虛擬機器最佳化平台、資源分配引擎和功耗分析,而非獨立工具。整合工作負載平衡、虛擬機器整合、容量最佳化和功耗分析等功能的捆綁產品正在模糊各個產品類型之間的界限。因此,伺服器虛擬化能耗最佳化軟體產業的競爭將繼續聚焦於平台深度和整合度,以實現持續的市場認可。
預計2026年至2031年,服務業將以20.12%的複合年成長率成長,成為各組成部分中成長最快的產業。伺服器虛擬化能源最佳化軟體市場的成長主要得益於許多部署需要跨多個虛擬機器管理程式堆疊進行持續調優,而非一次性安裝。 IBM的一份報告顯示,Atruvia利用Turbonomic在18個月內淘汰了1000多台實體伺服器,同時減少了20%的硬體面積,並降低了能耗和碳排放。 2025年5月,IBM將Turbonomic的功能擴展到GitHub和HashiCorp Terraform,從而擴展了該服務在整個基礎設施即代碼(IaC)環境中的應用範圍。
到2025年,基於雲端的部署將佔據伺服器虛擬化能源最佳化軟體市場66.41%的佔有率,在部署模式中佔據絕對領先地位。雲端交付在伺服器虛擬化能源最佳化軟體市場迅速發展,因為SaaS模式無需本地維護,並能持續收集分散式工作負載的遙測資料。對於那些希望更快更新、更方便地存取儀錶板,同時又不想擴充本地軟體團隊的用戶來說,這種方式也十分理想。然而,儘管雲端部署主導地位,但人們仍然擔心將敏感工作負載和能源資料置於外部聚合層會帶來安全隱患。
預計到 2031 年,混合部署將以 19.95% 的複合年成長率成長,成為成長最快的採用模式。隨著企業希望在保持對公有雲上所有工作負載的可見性的同時,還能對高度敏感的環境進行有效控制,公共雲端虛擬化能源最佳化軟體市場正朝著這個方向發展。博通公司將 VMware Cloud Foundation 9.1 定位為強調這種平衡,透過擴展碳排放透明度和為混合 AI 和非 AI 環境提供節能叢集儀表板來實現這一目標。 2025 年 8 月,博通公司宣布,其十大財富 500 強企業中有九家已決定採用 VMware Cloud Foundation,這進一步證明了混合架構在伺服器虛擬化能源最佳化軟體市場中的持續強勁勢頭。
區域分析
到2025年,北美將成為最大的區域市場,佔據伺服器虛擬化能源最佳化軟體市場34.56%的佔有率。該地區受益於超大規模和企業級資料中心的高密度分佈,以及能源管理與財務報告之間更緊密的聯繫。根據美國國會研究服務處(CRS)的數據顯示,2023年美國資料中心的年能耗達到176太瓦時(TWh),佔全國總電力消耗量的4.4%。 CRS也指出,到2028年,這數字可能會翻倍甚至兩番。美國證券交易委員會(SEC)的氣候變遷資訊揭露規則提高了上市公司對範圍1和範圍2的追蹤要求,進一步增強了基於軟體的能源歸因的合法性。雖然加拿大和墨西哥在區域整體市場中所佔佔有率仍然較小,但隨著數位基礎設施的發展和資訊揭露要求的日益規範化,這些地區的伺服器虛擬化能源最佳化軟體市場正在不斷擴張。
預計到2031年,亞太地區的複合年成長率將達到23.78%,在所有區域市場中成長最高。隨著資料中心容量的擴張、國家級資料法規的訂定以及能源效率標準的日益嚴格,伺服器虛擬化能源最佳化軟體市場在該地區正蓬勃發展,營運商被迫採取更積極主動的電源管理方式。新加坡、印度、中國和澳洲尤其引人注目,因為營運商需要在不影響利用率、冷卻負荷和報告品質控制的前提下擴展容量。與基礎設施成長速度較慢的地區相比,這些因素共同造就了亞太地區伺服器虛擬化能源最佳化軟體市場更為廣闊的成長潛力。
儘管歐洲的伺服器虛擬化能源最佳化軟體市場成長速度絕對值低於亞太地區,但由於強制性而非可選的報告要求,它仍然是該市場最強勁的地區之一。歐盟委員會強制要求所有超過 500 千瓦的資料中心提交年度績效報告,而合規性是推動重複購買的關鍵因素,這得益於將於 2026 年 5 月實施的報告週期。歐盟 2025 年 7 月發布的一項關於未來能源績效和永續性報告工作的調查顯示,預計相關法規將更加嚴格,瑞典和德國等國已採取的措施也印證了這一趨勢。在南美洲、中東和非洲,儘管伺服器虛擬化能源最佳化軟體市場仍處於早期應用階段,但全部區域大規模新建數位基礎設施專案的推進,該市場已開始嶄露頭角。
其他好處:
- Excel格式的市場預測(ME)表
- 3個月的分析師支持
目錄
第1章:引言
- 研究假設和市場定義
- 調查範圍
第2章:調查方法
第3章執行摘要
第4章 市場狀況
- 市場概覽
- 市場促進因素
- 提高虛擬化伺服器環境中的功率密度
- 企業對降低資料中心能源成本的興趣日益濃厚
- 超融合融合式基礎架構和整合運算堆疊的擴展
- 碳排放報告和能源透明度方面的合規壓力
- 人工智慧驅動的電源調度和工作負載放置
- 虛擬機器層面的詳細能源歸屬需求
- 市場限制因素
- 多重雲端和混合虛擬化堆疊的可見性局限性
- 與傳統編配和監控工具整合的複雜性。
- 小規模IT環境中的投資報酬率不確定性
- 電力遙測和資產映射中的數據品質挑戰
- 產業價值鏈分析
- 宏觀經濟因素對市場的影響
- 監理情勢
- 技術展望
- 波特五力分析
第5章 市場規模與成長預測
- 按組件
- 軟體
- 虛擬機器最佳化平台
- 資源分配引擎
- 考慮能源效率的工作負載負載平衡
- VM整合工具
- 產能最佳化軟體
- 功耗分析
- 服務
- 軟體
- 部署模式
- 基於雲端的
- 現場
- 混合
- 按公司規模
- 大公司
- 小型企業
- 按最終用戶行業分類
- 工業製造
- 能源公用事業
- BFSI
- 零售和消費品
- 資訊科技/通訊
- 醫療保健和生命科學
- 政府/公共部門
- 運輸/物流
- 其他終端用戶產業
- 按地區
- 北美洲
- 美國
- 加拿大
- 墨西哥
- 南美洲
- 巴西
- 阿根廷
- 其他南美國家
- 歐洲
- 德國
- 英國
- 法國
- 義大利
- 西班牙
- 俄羅斯
- 荷蘭
- 其他歐洲國家
- 亞太地區
- 中國
- 日本
- 印度
- 韓國
- 澳洲和紐西蘭
- 其他亞太國家
- 中東
- 沙烏地阿拉伯
- 阿拉伯聯合大公國
- 其他中東國家
- 非洲
- 南非
- 奈及利亞
- 其他非洲國家
- 北美洲
第6章 競爭情勢
- 市場集中度
- 策略趨勢
- 市佔率分析
- 公司簡介
- VMware, Inc.
- Red Hat, Inc.
- Nutanix, Inc.
- BMC Software, Inc.
- Citrix Systems, Inc.
- Nlyte Software, Inc.
- Densify Inc.
- ParkMyCloud, Inc.
- Device42, Inc.
- Turbonomic, Inc.
- Flexera Software LLC
- Dell Technologies Inc.
- Hewlett Packard Enterprise Company
- Lenovo Group Limited
- Oracle Corporation
- Microsoft Corporation
- IBM Corporation
- Broadcom Inc.
- OpenText Corporation
- ManageEngine, a division of Zoho Corporation Pvt. Ltd.
- Karios AI
- Sunbird Software
- SolarWinds Corporation
- Dynatrace, Inc.
- Grafana Labs, Inc.
第7章 市場機會與未來展望
According to Mordor Intelligence, the server virtualization energy optimization software market size was valued at USD 0.76 billion in 2025 and estimated to grow from USD 0.90 billion in 2026 to reach USD 2.11 billion by 2031, at a CAGR of 18.58% during the forecast period 2026-2031.
This report is Segmented by Component (Software and Services), Deployment Mode (Cloud-Based, On-Premises, and Hybrid), Enterprise Size (Large Enterprises, and Small and Medium Enterprises), End-User Industry (Industrial Manufacturing, Energy and Utilities, BFSI, Retail and Consumer Goods, and More), and Geography. The Market Forecasts are Provided in Terms of Value (USD).
Global Server Virtualization Energy Optimization Software Market Trends and Insights
Rising Power Density In Virtualized Server Environments
AI accelerator adoption is concentrating more wattage per rack, turning power density into a direct software issue for the server virtualization energy-optimization software market. The International Energy Agency stated that servers already accounted for 60% of data center electricity demand and projected that server electricity consumption would grow strongly through 2030. That change matters because static placement models were built for general-purpose server estates, not for mixed clusters where a single AI-capable rack can draw 30 kW or more. A 2026 study published in Energy found that coordinated power, computing, and cooling optimization reduced data center power consumption by up to 30.56% versus constant air volume systems. As rack density rises, the cost of poor VM placement increases faster than linearly, keeping the server virtualization energy-optimization software market close to the core operating stack.
Growing Enterprise Focus On Data Center Energy Cost Reduction
Electricity has become a larger operating expense for data center operators, so the server virtualization energy optimization software market is benefiting as buyers link energy control with infrastructure cost reduction. Physical servers that run at low utilization still consume a large share of peak power, which keeps consolidation economics attractive even before formal sustainability targets are applied. Broadcom stated in May 2026 that VMware Cloud Foundation 9.1 introduced intelligent memory tiering and enhanced compression, reducing server costs by up to 40% for clusters running mixed AI and non-AI workloads. IBM reported that Atruvia used Turbonomic to decommission more than 1,000 physical servers in 18 months, cutting hardware footprint by 20% while lowering energy use and carbon emissions. This is pushing the server virtualization energy optimization software market toward purchase decisions that combine operating efficiency, hardware reduction, and sustainability reporting in a single software solution.
Limited Visibility Across Multi-Cloud And Hybrid Virtualization Stacks
The server virtualization energy optimization software market still faces visibility challenges when workloads move between private and public environments. Energy, utilization, and carbon information are often split across provider-specific consoles, which undermines attribution consistency and makes it harder to validate optimization at scale. Vendor tools reflect this fragmentation, with Broadcom surfacing carbon and energy dashboards inside VMware environments and Dynatrace exposing cost and carbon optimization through its own observability layer. When a workload shifts between on-premises VMware and public cloud during the same reporting window, baseline assumptions can change before measurement is complete. Until telemetry becomes more uniform across environments, the server virtualization energy optimization software market will continue to face slower rollout decisions in hybrid estates.
Other drivers and restraints analyzed in the detailed report include:
- Expansion Of Hyperconverged Infrastructure And Consolidated Compute Stacks
- Compliance Pressure For Carbon Reporting And Energy Transparency
- Integration Complexity With Legacy Orchestration And Monitoring Tools
For complete list of drivers and restraints, kindly check the Table Of Contents.
Segment Analysis
Software accounted for 70.12% of the server virtualization energy optimization software market share in 2025, making it the leading component segment. In the server virtualization energy optimization software market, buyers continued to prioritize VM optimization platforms, resource allocation engines, and power analytics over stand-alone tools. Bundled offerings that combine workload balancing, VM consolidation, capacity optimization, and power analytics are reducing the boundary between separate product categories. This keeps competition centered on platform depth and integration stickiness inside the server virtualization energy optimization software industry.
Services are projected to expand at a 20.12% CAGR from 2026 to 2031, the fastest rate within the component mix. The server virtualization energy optimization software market is seeing that growth because many deployments require continuous tuning across mixed hypervisor stacks rather than a one-time installation. IBM reported that Atruvia used Turbonomic to decommission more than 1,000 physical servers in 18 months while reducing its hardware footprint by 20% and lowering energy use and carbon emissions. IBM also extended Turbonomic into GitHub and HashiCorp Terraform in May 2025, which widened the services role across infrastructure-as-code environments.
Cloud-based deployment accounted for 66.41% of the server virtualization energy optimization software market in 2025, giving it a clear lead among deployment models. The server virtualization energy optimization software market favored cloud delivery because SaaS models eliminated local maintenance and enabled continuous telemetry from distributed workloads. This approach also fits buyers that wanted faster updates and easier dashboard access without expanding on-site software teams. Even so, cloud leadership has not removed concerns about placing sensitive workloads and energy data in external aggregation layers.
Hybrid deployment is projected to grow at a 19.95% CAGR through 2031, making it the fastest-growing deployment mode. The server virtualization energy optimization software market is moving in this direction because enterprises want private control for sensitive environments while still maintaining visibility across public cloud workloads. Broadcom positioned VMware Cloud Foundation 9.1 around that balance by extending carbon transparency and energy-efficient cluster dashboards for mixed AI and non-AI environments. Broadcom also stated in August 2025 that 9 of the top 10 Fortune 500 companies had committed to VMware Cloud Foundation, underscoring the staying power of hybrid architectures in the server virtualization energy-optimization software market.
Complete Report Scope:
- By Component
- Software
- VM optimization platforms
- Resource allocation engines
- Energy-aware workload balancing
- VM consolidation tools
- Capacity optimization software
- Power consumption analytics
- Services
- Software
- By Deployment Mode
- Cloud-Based
- On-Premises
- Hybrid
- By Enterprise Size
- Large Enterprises
- Small and Medium Enterprises
- By End-user Industry
- Industrial Manufacturing
- Energy and Utilities
- BFSI
- Retail and Consumer Goods
- IT and Telecom
- Healthcare and Life Sciences
- Government and Public Sector
- Transportation and Logistics
- Other End-user Industries
- By Geography
- North America
- United States
- Canada
- Mexico
- South America
- Brazil
- Argentina
- Rest of South America
- Europe
- Germany
- United Kingdom
- France
- Italy
- Spain
- Russia
- Netherlands
- Rest of Europe
- Asia-Pacific
- China
- Japan
- India
- South Korea
- Australia and New Zealand
- Rest of Asia-Pacific
- Middle East
- Saudi Arabia
- United Arab Emirates
- Rest of Middle East
- Africa
- South Africa
- Nigeria
- Rest of Africa
- North America
Geography Analysis
North America held 34.56% of the server virtualization energy optimization software market share in 2025, making it the largest region. The region benefits from dense hyperscale and enterprise data center footprints, along with stronger links between energy management and financial reporting. The Congressional Research Service stated that U.S. data center annual energy use reached 176 TWh in 2023, equal to 4.4% of national electricity use, and it noted that the figure could double or triple by 2028. The SEC climate disclosure rule heightened the importance of Scope 1 and Scope 2 tracking for listed companies, strengthening the case for software-based energy attribution. Canada and Mexico remain smaller parts of the regional base, but the server virtualization energy optimization software market is expanding there as digital infrastructure and disclosure expectations become more formal.
Asia-Pacific is projected to grow at 23.78% CAGR through 2031, making it the fastest regional segment. The server virtualization energy optimization software market is gaining momentum here because new data center capacity, sovereign data rules, and tighter efficiency standards are pushing operators to manage power more actively. Singapore, India, China, and Australia are drawing attention because operators need to scale capacity without losing control over utilization, cooling pressure, and reporting quality. This combination gives the server virtualization energy optimization software market a broader runway in Asia-Pacific than in regions with slower infrastructure growth.
Europe is growing more slowly than Asia-Pacific on an absolute basis, yet it remains one of the most durable parts of the server virtualization energy optimization software market because reporting obligations are mandatory rather than optional. The European Commission requires annual performance reporting for data centers above 500 kW, and the reporting cycle that came into force in May 2026 has made compliance a repeat-purchase driver. A July 2025 EU study on the next steps for energy performance and sustainability reporting indicated that the rules will become more demanding over time, while national measures in countries such as Sweden and Germany are already reinforcing that direction. South America, the Middle East, and Africa are still earlier adopters, yet the server virtualization energy optimization software market is beginning to appear in large new-build digital infrastructure projects across those regions.
- VMware, Inc.
- Red Hat, Inc.
- Nutanix, Inc.
- BMC Software, Inc.
- Citrix Systems, Inc.
- Nlyte Software, Inc.
- Densify Inc.
- ParkMyCloud, Inc.
- Device42, Inc.
- Turbonomic, Inc.
- Flexera Software LLC
- Dell Technologies Inc.
- Hewlett Packard Enterprise Company
- Lenovo Group Limited
- Oracle Corporation
- Microsoft Corporation
- IBM Corporation
- Broadcom Inc.
- OpenText Corporation
- ManageEngine, a division of Zoho Corporation Pvt. Ltd.
- Karios AI
- Sunbird Software
- SolarWinds Corporation
- Dynatrace, Inc.
- Grafana Labs, Inc.
Additional Benefits:
- The market estimate (ME) sheet in Excel format
- 3 months of analyst support
TABLE OF CONTENTS
1 INTRODUCTION
- 1.1 Study Assumptions and Market Definition
- 1.2 Scope of the Study
2 RESEARCH METHODOLOGY
3 EXECUTIVE SUMMARY
4 MARKET LANDSCAPE
- 4.1 Market Overview
- 4.2 Market Drivers
- 4.2.1 Rising Power Density in Virtualized Server Environments
- 4.2.2 Growing Enterprise Focus on Data Center Energy Cost Reduction
- 4.2.3 Expansion of Hyperconverged Infrastructure and Consolidated Compute Stacks
- 4.2.4 Compliance Pressure for Carbon Reporting and Energy Transparency
- 4.2.5 AI-Assisted Power Scheduling and Workload Placement
- 4.2.6 Demand for Granular VM-Level Energy Attribution
- 4.3 Market Restraints
- 4.3.1 Limited Visibility Across Multi-Cloud and Hybrid Virtualization Stacks
- 4.3.2 Integration Complexity With Legacy Orchestration and Monitoring Tools
- 4.3.3 ROI Uncertainty for Smaller It Environments
- 4.3.4 Data Quality Gaps in Power Telemetry and Asset Mapping
- 4.4 Industry Value-Chain Analysis
- 4.5 Impact of Macroeconomic Factors on the Market
- 4.6 Regulatory Landscape
- 4.7 Technological Outlook
- 4.8 Porter's Five Forces Analysis
- 4.8.1 Threat of New Entrants
- 4.8.2 Bargaining Power of Buyers
- 4.8.3 Bargaining Power of Suppliers
- 4.8.4 Threat of Substitutes
- 4.8.5 Intensity of Competitive Rivalry
5 MARKET SIZE AND GROWTH FORECASTS (VALUE)
- 5.1 By Component
- 5.1.1 Software
- 5.1.1.1 VM optimization platforms
- 5.1.1.2 Resource allocation engines
- 5.1.1.3 Energy-aware workload balancing
- 5.1.1.4 VM consolidation tools
- 5.1.1.5 Capacity optimization software
- 5.1.1.6 Power consumption analytics
- 5.1.2 Services
- 5.1.1 Software
- 5.2 By Deployment Mode
- 5.2.1 Cloud-Based
- 5.2.2 On-Premises
- 5.2.3 Hybrid
- 5.3 By Enterprise Size
- 5.3.1 Large Enterprises
- 5.3.2 Small and Medium Enterprises
- 5.4 By End-user Industry
- 5.4.1 Industrial Manufacturing
- 5.4.2 Energy and Utilities
- 5.4.3 BFSI
- 5.4.4 Retail and Consumer Goods
- 5.4.5 IT and Telecom
- 5.4.6 Healthcare and Life Sciences
- 5.4.7 Government and Public Sector
- 5.4.8 Transportation and Logistics
- 5.4.9 Other End-user Industries
- 5.5 By Geography
- 5.5.1 North America
- 5.5.1.1 United States
- 5.5.1.2 Canada
- 5.5.1.3 Mexico
- 5.5.2 South America
- 5.5.2.1 Brazil
- 5.5.2.2 Argentina
- 5.5.2.3 Rest of South America
- 5.5.3 Europe
- 5.5.3.1 Germany
- 5.5.3.2 United Kingdom
- 5.5.3.3 France
- 5.5.3.4 Italy
- 5.5.3.5 Spain
- 5.5.3.6 Russia
- 5.5.3.7 Netherlands
- 5.5.3.8 Rest of Europe
- 5.5.4 Asia-Pacific
- 5.5.4.1 China
- 5.5.4.2 Japan
- 5.5.4.3 India
- 5.5.4.4 South Korea
- 5.5.4.5 Australia and New Zealand
- 5.5.4.6 Rest of Asia-Pacific
- 5.5.5 Middle East
- 5.5.5.1 Saudi Arabia
- 5.5.5.2 United Arab Emirates
- 5.5.5.3 Rest of Middle East
- 5.5.6 Africa
- 5.5.6.1 South Africa
- 5.5.6.2 Nigeria
- 5.5.6.3 Rest of Africa
- 5.5.1 North America
6 COMPETITIVE LANDSCAPE
- 6.1 Market Concentration
- 6.2 Strategic Moves
- 6.3 Market Share Analysis
- 6.4 Company Profiles (includes Global Level Overview, Market Level Overview, Core Segments, Financials as available, Strategic Information, Market Rank/Share, Products and Services, Recent Developments)
- 6.4.1 VMware, Inc.
- 6.4.2 Red Hat, Inc.
- 6.4.3 Nutanix, Inc.
- 6.4.4 BMC Software, Inc.
- 6.4.5 Citrix Systems, Inc.
- 6.4.6 Nlyte Software, Inc.
- 6.4.7 Densify Inc.
- 6.4.8 ParkMyCloud, Inc.
- 6.4.9 Device42, Inc.
- 6.4.10 Turbonomic, Inc.
- 6.4.11 Flexera Software LLC
- 6.4.12 Dell Technologies Inc.
- 6.4.13 Hewlett Packard Enterprise Company
- 6.4.14 Lenovo Group Limited
- 6.4.15 Oracle Corporation
- 6.4.16 Microsoft Corporation
- 6.4.17 IBM Corporation
- 6.4.18 Broadcom Inc.
- 6.4.19 OpenText Corporation
- 6.4.20 ManageEngine, a division of Zoho Corporation Pvt. Ltd.
- 6.4.21 Karios AI
- 6.4.22 Sunbird Software
- 6.4.23 SolarWinds Corporation
- 6.4.24 Dynatrace, Inc.
- 6.4.25 Grafana Labs, Inc.
7 MARKET OPPORTUNITIES AND FUTURE OUTLOOK
- 7.1 White-Space and Unmet-Need Assessment

 2026年全球環境循環能源網路市場報告2026年全球精益能源管理市場報告
 心理能量最佳化市場預測至2034年-按解決方案類型、消費者細分、技術、應用、最終用戶和地區分類的全球分析
 醫療保健IT永續發展軟體:市場佔有率分析、產業趨勢與統計及成長預測(2026-2031年)智慧熱能網路管理市場預測至2034年-全球解決方案類型、組件、部署模式、技術、應用、最終用戶和區域分析資料中心能源最佳化和電源管理解決方案市場預測至 2034 年—按部署模式、技術、應用、最終用戶和地區分類的全球分析物聯網能源管理市場:2034 年預測-按設備、部署模式、連接方式、技術、應用、最終用戶和地區分類的全球分析能源最佳化軟體市場預測至2034年—按組件、部署類型、企業規模、應用、最終用戶和地區分類的全球分析
 2026-2030年全球併網建築解決方案市場
 工業能源效率市場:按交付類型、最終用戶產業和地區分類