


 |
市場調查報告書
商品編碼
2072531
活動物流:市場佔有率分析、產業趨勢與統計、成長預測(2026-2031)Event Logistics - Market Share Analysis, Industry Trends & Statistics, Growth Forecasts (2026 - 2031) |
||||||

※ 本網頁內容可能與最新版本有所差異。詳細情況請與我們聯繫。
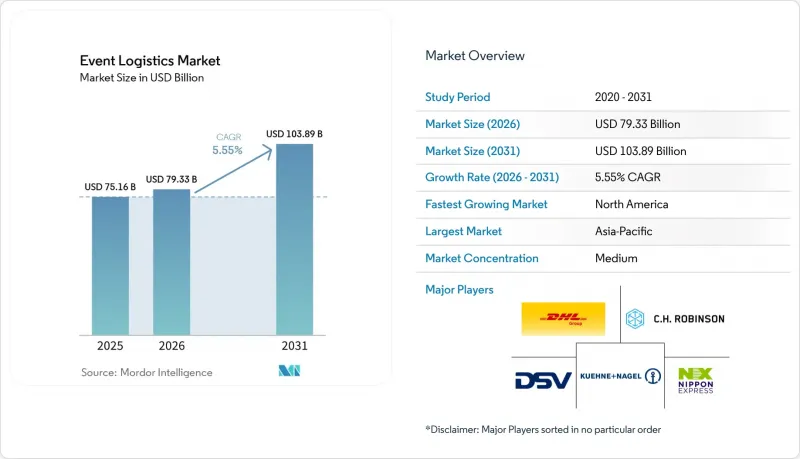
據 Mordor Intelligence 稱,2025 年活動物流市場價值為 751.6 億美元,預計到 2031 年將達到 1038.9 億美元,而 2026 年為 793.3 億美元,預測期(2026-2031 年)的複合年成長率為 5.55%。
本報告按服務(運輸、倉儲、配送和庫存管理等)、應用(娛樂和媒體、體育賽事、展覽會、企業活動及其他應用)和地區(北美、南美、亞太、歐洲以及中東和非洲)進行細分。市場預測以美元計價。
全球活動物流市場趨勢與洞察
大型活動的增加和混合形式的興起正在擴大全球需求。
如今,混合型活動需要貨運和數位基礎設施的並行協調。例如,在2024年巴黎奧運期間,CEVA物流負責協調廣播設備的交付,同時在三個總面積面積8萬平方公尺的樞紐處理了17萬個托盤。這清楚地展現了正在重塑服務組合的雙流模式。類似的需求也出現在企業會議中,展位搭建材料和雲端串流設備必須同時交付。這迫使供應商組成專業的多媒體團隊,透過一份工作單來管理光纖連接、顯示設備和現場技術人員。
國際體育和文化巡迴的日程安排持續擴大。
巡迴行程越來越長,也越來越全球化,這使得海關手續和ATA單證冊管理變得更加複雜。 2024年,途經美國、加拿大和墨西哥邊境的卡車運輸量超過32萬輛。這主要是由於《美墨加協定》(USMCA)的條款簡化了前往連續巡迴地點的設備重新入境程序。體育場館演出主辦單位現在要求供應商在主要邊境口岸附近的轉運樞紐配備備用燈光鑽機和吊裝硬體,以降低因邊境延誤而導致的損失。
國際空運和海運運費持續波動
空運現貨價格可能在幾週內翻倍,迫使活動組織者增加緊急預算或提前預訂大宗貨物。 2024年,受關稅動盪的影響,跨境卡車運輸價格上漲了50%至75%,進一步加劇了本已捉襟見肘的活動預算壓力。服務供應商正在探索避險協議和多模態路線,以減輕價格波動對客戶的影響。
細分市場分析
至2025年,運輸業將佔活動物流市場77.60%的佔有率,凸顯其在專業設備運輸中的核心角色。儘管貨運價格有所波動,但對於需要減震的樂器和廣播設備而言,能夠確保溫控貨艙的空運航線需求仍然強勁。整合的物聯網感測器能夠追蹤位置、濕度和振動情況,從而減少保險索賠,並增強托運人和組織者之間的信任。倉儲、配送和庫存管理預計將以6.72%的複合年成長率成長,這反映了客戶對在場館集中區域附近預先儲備資產的需求。區域樞紐內的自動化取貨系統和RFID閘機已將揀貨和包裝時間縮短了22%,從而實現了在連續巡迴日期之間進行隔夜調貨。因此,預計到2031年,活動物流市場中倉儲解決方案的市場規模將穩定成長。
由於路線規劃靈活,道路運輸仍然是最後一公里配送的主流選擇,但由於駕駛者短缺,尤其是在北美地區,公路運輸面臨許多限制。中國和歐盟的鐵路走廊吸引了大量能夠承受較長前置作業時間的舞台搭建貨物,有助於減少排放。海運仍然是運輸非緊急展位設備的選擇,其成本優勢符合永續性。空運則繼續作為對時效性要求較高的設備的細分市場,尤其對運輸互動數位設備的需求日益成長,因為這類設備一旦延誤就會迅速貶值。因此,活動物流業正在投資多式聯運方案,根據貨物處理需求,選擇最可靠、低碳的運輸路線。
區域分析
預計到2025年,北美將繼續佔據全球活動物流市場37.75%的佔有率。這主要歸功於其密集的場館網路,涵蓋拉斯維加斯、芝加哥和多倫多等城市,這些城市同時也是重要的物流中轉樞紐。美墨加協定(USMCA)簡化的流程以及成熟的第三方物流(3PL)生態系統,確保了跨境物流的可靠性。然而,不斷上漲的燃油價格和司機短缺問題持續對利潤率構成壓力。該地區的企業活動部門全年保持穩定的運輸量,並擁有充足的行銷預算,減輕了季節性波動對供應商的影響。墨西哥已成為美國最大的貿易夥伴,進口額高達4756億美元,這為近岸外包創造了機遇,縮短了運輸距離,減少了貨物停留時間。
亞太地區是成長最快的地區,預計到2031年將以6.98%的複合年成長率成長。這一成長得益於商務旅行支出不斷增加(預計到2027年將達到8000億美元)以及基礎建設的加速發展。在中國,蓬勃發展的國內展覽會市場,尤其以科技、汽車和製造業為重點,推動了對精通複雜展位搭建的專業現場人員的需求。在印度,從海得拉巴到孟買的會展中心建設計畫正在拓展多城市旅遊套餐的範圍;而在日本,對智慧場館技術的投資正在刺激對物聯網整合物流解決方案的需求。因此,亞太地區的活動物流市場將持續快速擴張。
歐洲市場前景保持平衡。儘管ICS2法規增加了合規負擔,但從漢諾威工業博覽會到米蘭時裝週,歐洲密集的各類活動維持了穩定的貨運量。由於贊助商要求供應鏈的每個環節都必須提交碳排放報告,因此能夠證明符合ISO 20121標準的供應商更具優勢。除了這三大主要地區之外,中東和非洲也憑藉著世博會和娛樂城建設等項目看到了新的商機,但基礎設施短缺暫時限制了貨運量的成長。
其他好處:
- Excel格式的市場預測(ME)表
- 3個月的分析師支持
目錄
第1章:引言
- 研究假設和市場定義
- 調查範圍
第2章:調查方法
第3章執行摘要
第4章 市場狀況
- 市場概覽
- 市場促進因素
- 隨著大型活動和混合(線上+線下)形式的增加,全球對綜合活動物流解決方案的需求正在擴大。
- 國際體育賽事、音樂會和文化巡迴的日程安排不斷延長,推動了時間緊迫的跨境貨運產業的發展。
- 體驗式品牌行銷活動在各行各業蓬勃發展,導致物流外包成本增加,以實現快速的搭建和拆卸週期。
- 組織者越來越傾向於透過單一聯繫點進行端到端的物流外包,以控制成本和執行風險。
- 參與者和組織者對物聯網和無線射頻識別技術實現的即時包裹追蹤的期望日益成長,這推動了先進物流服務的普及。
- 贊助商和場館發起的全球永續性計劃正在加速對碳中和、逆向物流和循環材料解決方案的需求。
- 市場限制因素
- 國際空運和海運價格的持續波動給活動物流預算帶來了壓力。
- 跨多個司法管轄區的海關清關、ATA單證冊和安全合規的複雜性正在延長前置作業時間並增加行政成本。
- 疫情後熟練的現場後勤人員短缺,使得確保世界各地大型活動的成功舉辦變得充滿挑戰。
- 對活動碳足跡和廢棄物流的監測力度加大,導致合規成本上升,並限制了傳統的物流方式。
- 價值供應鏈分析
- 市場中的技術進步
- 政府法規和政策
- 波特五力分析
- 地緣政治事件對市場的影響
第5章 市場規模與成長預測
- 按服務
- 運輸
- 路
- 鐵路
- 海上運輸
- 航空
- 倉儲、物流和庫存管理
- 其他服務
- 運輸
- 透過使用
- 娛樂媒體
- 體育賽事
- 展覽會/展覽會
- 企業活動
- 其他用途
- 按地區
- 北美洲
- 美國
- 加拿大
- 墨西哥
- 南美洲
- 巴西
- 秘魯
- 智利
- 阿根廷
- 其他南美國家
- 亞太地區
- 印度
- 中國
- 日本
- 澳洲
- 韓國
- 東南亞(新加坡、馬來西亞、泰國、印尼、越南、菲律賓)
- 其他亞太國家
- 歐洲
- 英國
- 德國
- 法國
- 西班牙
- 義大利
- 比荷盧經濟聯盟(比利時、荷蘭、盧森堡)
- 北歐國家(丹麥、芬蘭、冰島、挪威、瑞典)
- 其他歐洲國家
- 中東和非洲
- 阿拉伯聯合大公國
- 沙烏地阿拉伯
- 土耳其
- 南非
- 奈及利亞
- 其他中東和非洲國家
- 北美洲
第6章 競爭情勢
- 市場集中度
- 策略趨勢
- 市佔率分析
- 公司簡介
- DHL Supply Chain & Global Forwarding
- Kuehne+Nagel International AG
- UPS Supply Chain Solutions
- DSV A/S
- Nippon Express
- FedEx Logistics
- CH Robinson Worldwide
- Sinotrans Ltd.
- Expeditors International
- CEVA Logistics
- GAC Group
- GEODIS
- Kerry Logistics Network
- Rock-it Cargo
- SOS Global Express
- Freeman Company
- EFI Logistics
- GES(Global Experience Specialists)
- Rhenus Sports & Events Logistics
- CTS Event Logistics
- Messe Frankfurt Exhibition Logistics(Mefex)
第7章 市場機會與未來展望
According to Mordor Intelligence, the event logistics market size was valued at USD 75.16 billion in 2025 and estimated to grow from USD 79.33 billion in 2026 to reach USD 103.89 billion by 2031, at a CAGR of 5.55% during the forecast period (2026-2031).
This report is Segmented by Service (Transportation, Warehousing, Distribution & Inventory Management and More), by Application (Entertainment & Media, Sports Events, Trade Fairs & Exhibitions, Corporate Events, and Other Applications), by Geography (North America, South America, Asia-Pacific, Europe, Middle East and Africa). The Market Forecasts are Provided in Terms of Value (USD).
Global Event Logistics Market Trends and Insights
Escalation of Mega-Events and Hybrid Formats Expanding Worldwide Demand
Hybrid events now demand parallel orchestration of freight flows and digital infrastructure. During the Paris 2024 Olympics, CEVA Logistics handled 170,000 pallets across three hubs totaling 80,000 m2 while coordinating broadcast equipment distribution, illustrating the dual-stream model reshaping service portfolios. The same requirement is surfacing in corporate conferences where booth construction and cloud-streaming kits must arrive together, prompting providers to build specialized multimedia teams that manage fibre connectivity, display rigs, and on-site technicians in a single work order.
Continuous Growth in International Sports and Cultural Touring Calendars
Touring schedules have lengthened and globalized, raising customs-handling complexity and carnet administration. Cross-border truck traffic between the US, Canada, and Mexico topped 320,000 movements in 2024, helped by USMCA provisions that simplify re-entry for equipment bound for consecutive tour stops. Stadium show promoters now require providers to stage spare lighting rigs and rigging hardware at transshipment depots near major crossings, lowering exposure to last-minute border delays.
Persistently Volatile International Air and Ocean Freight Rates
Air freight spot prices can double within weeks, forcing organizers to expand contingency budgets or negotiate early block bookings. Border truck rates rose 50-75% in 2024 amid tariff disruptions, adding margin pressure on already tight event budgets. Providers are experimenting with hedging contracts and multimodal routing to cushion customers against swings.
Other drivers and restraints analyzed in the detailed report include:
- Surge in Experiential Brand-Marketing Events Boosting Outsourced Logistics Spend
- Rising Organizer Preference for Single-Point End-to-End Logistics Outsourcing
- Multi-Jurisdictional Customs and Security Compliance Complexities
For complete list of drivers and restraints, kindly check the Table Of Contents.
Segment Analysis
Transportation contributed 77.60% of the event logistics market in 2025, underlining its role as the backbone for specialized equipment movement. Despite rate volatility, premium demand persists for air freight lanes that guarantee climate-controlled cabins for musical instruments and broadcast gear requiring shock attenuation. Integrated IoT sensors now track location, humidity, and vibration, reducing insurance claims and reinforcing trust between shippers and organizers. Warehousing, distribution & inventory management is projected to post a 6.72% CAGR, reflecting customer insistence on forward-stocking assets near venue clusters. Automated retrieval systems and RFID portals inside regional hubs cut pick-and-pack time by 22%, enabling overnight redeployments between back-to-back tour dates. As a result, the event logistics market size for warehousing solutions is anticipated to rise steadily through 2031.
Road transport continues to dominate last-mile moves thanks to flexible routing, yet faces constraints from driver shortages, especially in North America. Rail corridors in China and the EU attract bulk staging loads that can tolerate longer lead times while lowering emissions. Sea freight remains the option for non-critical booth infrastructure, offering cost-down benefits that align with sustainability pledges. Air lift retains its niche for time-critical gear and has grown for interactive digital sets that lose value rapidly if delayed. The event logistics industry is therefore investing in blended multimodal plans that match cargo sensitivity with the most reliable, low-carbon path available.
Complete Report Scope:
- By Service
- Transportation
- Road
- Rail
- Sea/Ocean
- Air
- Warehousing, Distribution & Inventory Management
- Other Services
- Transportation
- By Application
- Entertainment & Media
- Sports Events
- Trade Fairs & Exhibitions
- Corporate Events
- Other Applications
- By Geography
- North America
- United States
- Canada
- Mexico
- South America
- Brazil
- Peru
- Chile
- Argentina
- Rest of South America
- Asia-Pacific
- India
- China
- Japan
- Australia
- South Korea
- South East Asia (Singapore, Malaysia, Thailand, Indonesia, Vietnam, Philippines)
- Rest of Asia-Pacific
- Europe
- United Kingdom
- Germany
- France
- Spain
- Italy
- BENELUX (Belgium, Netherlands, Luxembourg)
- NORDICS (Denmark, Finland, Iceland, Norway, Sweden)
- Rest of Europe
- Middle East and Africa
- United Arab Emirates
- Saudi Arabia
- Turkey
- South Africa
- Nigeria
- Rest of Middle East and Africa
- North America
Geography Analysis
North America retained 37.75% of the event logistics market in 2025, benefiting from a dense network of venues in Las Vegas, Chicago, and Toronto that double as logistics marshalling points. USMCA streamlining and mature 3PL ecosystems deliver reliable cross-border flows; nevertheless, fuel-price spikes and driver shortages continue to test margins. The region's corporate event sector, backed by resilient marketing budgets, sustains year-round baseline volumes that cushion providers against seasonality. Mexico's ascent as the largest United States trading partner at USD 475.6 billion in imports unlocks near-shoring opportunities that tighten haul lengths and reduce dwell times.
Asia-Pacific represents the fastest-growing region with a 6.98% CAGR through 2031. Rising business travel spend, forecast to reach USD 800 billion by 2027, and accelerated infrastructure upgrades underpin the expansion. China's robust domestic trade-fair circuit, covering technology, automotive, and manufacturing themes, fuels demand for specialized on-site handling crews conversant in complex booth assembly. India's convention-center pipeline, from Hyderabad to Mumbai, widens the runway for multi-city touring packages, while Japan's investment in smart-venue technology sparks demand for IoT-integrated logistics solutions. As a result, the event logistics market size in Asia-Pacific continues to rise swiftly.
Europe sustains a balanced outlook. The ICS2 regime raises compliance overhead, yet the continent's dense calendar-ranging from Hannover Messe to Milan Fashion Week-maintains consistent cargo flows. Providers able to certify ISO 20121 compliance gain an edge as sponsors enforce carbon reporting at every segment of the supply chain. Beyond the tri-core regions, the Middle East and Africa showcase green-field opportunities tied to Expo-style projects and entertainment city build-outs, though infrastructure gaps still restrain immediate volume scaling.
- DHL Supply Chain & Global Forwarding
- Kuehne + Nagel International AG
- UPS Supply Chain Solutions
- DSV A/S
- Nippon Express
- FedEx Logistics
- C.H. Robinson Worldwide
- Sinotrans Ltd.
- Expeditors International
- CEVA Logistics
- GAC Group
- GEODIS
- Kerry Logistics Network
- Rock-it Cargo
- SOS Global Express
- Freeman Company
- EFI Logistics
- GES (Global Experience Specialists)
- Rhenus Sports & Events Logistics
- CTS Event Logistics
- Messe Frankfurt Exhibition Logistics (Mefex)
Additional Benefits:
- The market estimate (ME) sheet in Excel format
- 3 months of analyst support
TABLE OF CONTENTS
1 Introduction
- 1.1 Study Assumptions & Market Definition
- 1.2 Scope of the Study
2 Research Methodology
3 Executive Summary
4 Market Landscape
- 4.1 Market Overview
- 4.2 Market Drivers
- 4.2.1 Escalation of mega-events and hybrid (in-person + virtual) formats, expanding worldwide demand for integrated event logistics solutions.
- 4.2.2 Continuous growth in international sports, concert and cultural touring calendars, driving time-critical, cross-border freight movements.
- 4.2.3 Surge in experiential brand-marketing events across sectors, boosting outsourced logistics spend for rapid set-up and teardown cycles.
- 4.2.4 Rising organiser preference for single-point, end-to-end logistics outsourcing to control cost and execution risk.
- 4.2.5 Heightened attendee and organiser expectations for real-time shipment visibility enabled by IoT/RFID, pushing adoption of advanced logistics services.
- 4.2.6 Global sustainability pledges from sponsors and venues, accelerating demand for carbon-neutral, reverse-logistics and circular-material solutions
- 4.3 Market Restraints
- 4.3.1 Persistently volatile international air- and ocean-freight rates, squeezing event budget allocations for logistics.
- 4.3.2 Multi-jurisdictional customs, carnet and security compliance complexities that extend lead-times and add administrative cost.
- 4.3.3 Post-pandemic shortage of skilled on-site logistics labour, challenging reliable execution for large-scale events worldwide.
- 4.3.4 Increasing scrutiny of event carbon footprints and waste streams, elevating compliance costs and limiting traditional logistics practices.
- 4.4 Value / Supply-Chain Analysis
- 4.5 Technological Advancement in the Market
- 4.6 Government Regulations and Policies
- 4.7 Porter's Five Forces Analysis
- 4.7.1 Threat of New Entrants
- 4.7.2 Bargaining Power of Buyers
- 4.7.3 Bargaining Power of Suppliers
- 4.7.4 Threat of Substitutes
- 4.7.5 Competitive Rivalry
- 4.8 Impact of Geopolitical Events on the Market
5 Market Size & Growth Forecasts (Value)
- 5.1 By Service
- 5.1.1 Transportation
- 5.1.1.1 Road
- 5.1.1.2 Rail
- 5.1.1.3 Sea/Ocean
- 5.1.1.4 Air
- 5.1.2 Warehousing, Distribution & Inventory Management
- 5.1.3 Other Services
- 5.1.1 Transportation
- 5.2 By Application
- 5.2.1 Entertainment & Media
- 5.2.2 Sports Events
- 5.2.3 Trade Fairs & Exhibitions
- 5.2.4 Corporate Events
- 5.2.5 Other Applications
- 5.3 By Geography
- 5.3.1 North America
- 5.3.1.1 United States
- 5.3.1.2 Canada
- 5.3.1.3 Mexico
- 5.3.2 South America
- 5.3.2.1 Brazil
- 5.3.2.2 Peru
- 5.3.2.3 Chile
- 5.3.2.4 Argentina
- 5.3.2.5 Rest of South America
- 5.3.3 Asia-Pacific
- 5.3.3.1 India
- 5.3.3.2 China
- 5.3.3.3 Japan
- 5.3.3.4 Australia
- 5.3.3.5 South Korea
- 5.3.3.6 South East Asia (Singapore, Malaysia, Thailand, Indonesia, Vietnam, Philippines)
- 5.3.3.7 Rest of Asia-Pacific
- 5.3.4 Europe
- 5.3.4.1 United Kingdom
- 5.3.4.2 Germany
- 5.3.4.3 France
- 5.3.4.4 Spain
- 5.3.4.5 Italy
- 5.3.4.6 BENELUX (Belgium, Netherlands, Luxembourg)
- 5.3.4.7 NORDICS (Denmark, Finland, Iceland, Norway, Sweden)
- 5.3.4.8 Rest of Europe
- 5.3.5 Middle East and Africa
- 5.3.5.1 United Arab Emirates
- 5.3.5.2 Saudi Arabia
- 5.3.5.3 Turkey
- 5.3.5.4 South Africa
- 5.3.5.5 Nigeria
- 5.3.5.6 Rest of Middle East and Africa
- 5.3.1 North America
6 Competitive Landscape
- 6.1 Market Concentration
- 6.2 Strategic Moves
- 6.3 Market Share Analysis
- 6.4 Company Profiles (includes Global level Overview, Market level overview, Core Segments, Financials as available, Strategic Information, Market Rank/Share, Products & Services, Recent Developments)
- 6.4.1 DHL Supply Chain & Global Forwarding
- 6.4.2 Kuehne + Nagel International AG
- 6.4.3 UPS Supply Chain Solutions
- 6.4.4 DSV A/S
- 6.4.5 Nippon Express
- 6.4.6 FedEx Logistics
- 6.4.7 C.H. Robinson Worldwide
- 6.4.8 Sinotrans Ltd.
- 6.4.9 Expeditors International
- 6.4.10 CEVA Logistics
- 6.4.11 GAC Group
- 6.4.12 GEODIS
- 6.4.13 Kerry Logistics Network
- 6.4.14 Rock-it Cargo
- 6.4.15 SOS Global Express
- 6.4.16 Freeman Company
- 6.4.17 EFI Logistics
- 6.4.18 GES (Global Experience Specialists)
- 6.4.19 Rhenus Sports & Events Logistics
- 6.4.20 CTS Event Logistics
- 6.4.21 Messe Frankfurt Exhibition Logistics (Mefex)
7 Market Opportunities & Future Outlook

 活動物流市場分析及至2035年預測:類型、產品類型、服務、技術、組件、應用、最終用戶、形式、階段
 2026-2030年全球活動物流市場
 活動物流市場機會、成長要素、產業趨勢分析及預測(2026-2035年)
 全球活動物流市場:市場規模、佔有率、趨勢分析(按類型、應用和地區)、展望和預測(2025-2032年)
 亞太活動物流:市場佔有率分析、產業趨勢與成長預測(2025-2030 年)
 亞太地區活動物流市場預測至 2031 年 - 區域分析 - 按類型和最終用戶
 北美活動物流市場預測至 2031 年 - 區域分析 - 按類型和最終用戶
 歐洲活動物流市場預測至 2031 年 - 區域分析 - 按類型和最終用戶
 活動物流市場規模、佔有率、趨勢分析報告:按類型、按應用、按地區、細分市場預測,2024-2030 年