


 |
市場調查報告書
商品編碼
1928999
活動物流市場機會、成長要素、產業趨勢分析及預測(2026-2035年)Event Logistics Market Opportunity, Growth Drivers, Industry Trend Analysis, and Forecast 2026 - 2035 |
||||||
全球活動物流市場預計到 2025 年將達到 775 億美元,到 2035 年將達到 1,349 億美元,年複合成長率為 5.9%。
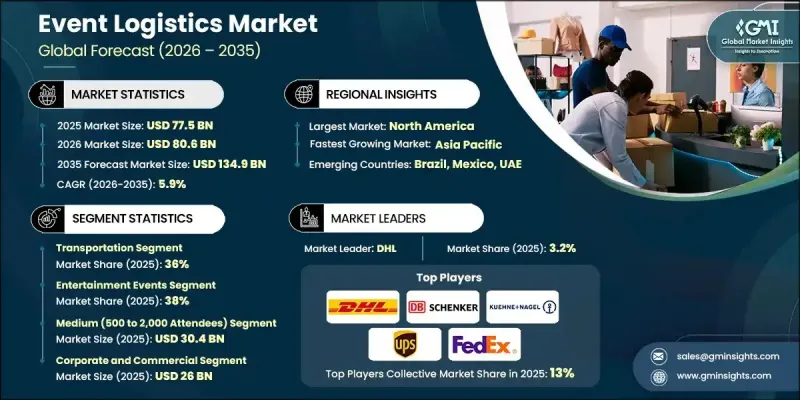
全球大型活動日益頻繁,以及對高度協調、時效性強的物流服務需求不斷成長,推動了市場擴張。活動組織者越來越重視複雜供應鏈的精準性、可靠性和成本控制,以確保營運順暢,並為與會者帶來正面的體驗。隨著活動日益複雜化和地理分散,對能夠實現嚴格日程管理、最大限度降低營運風險並確保從策劃到後續營運無縫協調的物流解決方案的需求也日益成長。此外,數位轉型的廣泛應用也推動了市場發展,物流供應商採用先進技術,提高了透明度、準確性和應對力速度。即時可見性和數據驅動的決策對於滿足不斷變化的客戶期望至關重要。向整合式端到端物流模式的轉變,提高了資源利用率、擴充性和跨多個活動場地的一致性。這些發展趨勢正在強化專業活動物流供應商作為策略夥伴而非僅僅是供應商的角色。
| 市場覆蓋範圍 | |
|---|---|
| 開始年份 | 2025 |
| 預測年份 | 2026-2035 |
| 起始值 | 775億美元 |
| 預測金額 | 1349億美元 |
| 複合年成長率 | 5.9% |
2025年,運輸環節佔比達36%,預計2026年至2035年將以4.6%的複合年成長率成長。此環節佔據核心地位,因為它負責確保活動相關資產的及時運輸。數位追蹤、連網監控系統和智慧路線規劃平台的日益普及,正在提升交付的準確性和準時性。
預計到 2025 年,娛樂活動領域將佔 38% 的市場佔有率,從 2026 年到 2035 年,年複合成長率將達到 7.1%。高營運強度和複雜的協調要求推動了該領域對技術賦能型物流解決方案的強烈依賴,從而鞏固了其主導地位。
預計到 2025 年,美國活動物流市場規模將達到 230 億美元,佔全球市場佔有率的 83%。該地區的主導地位得益於先進的基礎設施和對數位化物流平台的早期採用,這些平台提高了效率、監控和協調能力。
目錄
第1章調查方法和範圍
第2章執行摘要
第3章業界考察
- 生態系分析
- 供應商情況
- 利潤率
- 成本結構
- 每個階段的附加價值
- 影響價值鏈的因素
- 中斷
- 產業影響因素
- 促進要素
- 全球事件數量不斷增加
- 對準時可靠交貨的需求
- 採用數位化和智慧物流技術
- 企業品牌和體驗式行銷的成長
- 產業潛在風險與挑戰
- 操作複雜度高且風險大
- 利潤空間有限,成本敏感度高。
- 市場機遇
- 拓展混合式、虛擬式和全球性活動
- 永續且環保的活動物流解決方案
- 擴展基於雲端的整合平台
- 推出利用人工智慧和機器學習的物流解決方案
- 促進要素
- 成長潛力分析
- 監管環境
- 北美洲
- 美國:OSHA 和聯邦活動安全指南
- 加拿大:運輸部和職業安全與健康指南
- 歐洲
- 德國:BMVI 和 DGUV 法規
- 法國:DGME 和 CNES 指南
- 英國:海事和海洋事務部 (MCA) 和健康與安全執行局 (HSE) 的相關規定
- 義大利:ENAC 和 INAIL 指南
- 亞太地區
- 中國:運輸部和活動安全法規
- 日本:JCAB 和國土交通省指南
- 韓國:國土交通旅遊部安全指南
- 印度:航運部和碼頭安全規則
- 拉丁美洲
- 巴西:ANTAQ 和基礎設施部指南
- 墨西哥:SEMAR 和 DGPM 法規
- 中東和非洲
- 阿拉伯聯合大公國:能源和基礎設施部法規
- 沙烏地阿拉伯:沙烏地阿拉伯港務局指南
- 北美洲
- 波特分析
- PESTEL 分析
- 科技與創新趨勢
- 當前技術趨勢
- 新興技術
- 價格趨勢
- 按地區
- 依產品
- 成本細分分析
- 專利分析
- 永續性和環境方面
- 永續努力
- 減少廢棄物策略
- 生產中的能源效率
- 環保舉措
- 碳足跡考量
- 使用案例場景
- 定價、商業和收入模式分析
- 需求面購買行為與決策框架
第4章 競爭情勢
- 介紹
- 公司市佔率分析
- 北美洲
- 歐洲
- 亞太地區
- 拉丁美洲
- 中東和非洲
- 主要市場公司的競爭分析
- 競爭定位矩陣
- 戰略展望矩陣
- 重大進展
- 併購
- 夥伴關係與合作
- 新產品發布
- 企業擴張計畫和資金籌措
第5章 按服務分類的市場估算與預測,2022-2035年
- 運輸
- 倉儲服務
- 庫存管理
- 現場安裝和拆卸
- 物流規劃與協調
- 其他
第6章 依活動規模分類的市場估計與預測,2022-2035年
- 小規模(最多500人)
- 中等規模(500至2000人)
- 大型(2000 至 10000 人)
- 超大規模(超過10,000人)
第7章 按應用領域分類的市場估算與預測,2022-2035年
- 企業活動
- 體育賽事
- 娛樂活動
- 公共活動
- 私人活動
第8章 依最終用途分類的市場估算與預測,2022-2035年
- 公司及商業
- 娛樂與媒體
- 運動的
- 政府/公共部門
- 教育機構
第9章 2022-2035年各地區市場估算與預測
- 北美洲
- 美國
- 加拿大
- 歐洲
- 英國
- 德國
- 法國
- 義大利
- 西班牙
- 比利時
- 荷蘭
- 瑞典
- 亞太地區
- 中國
- 印度
- 日本
- 澳洲
- 新加坡
- 韓國
- 越南
- 印尼
- 拉丁美洲
- 巴西
- 墨西哥
- 阿根廷
- 中東和非洲
- 阿拉伯聯合大公國
- 南非
- 沙烏地阿拉伯
第10章:公司簡介
- Global Player
- CH Robinson
- CEVA Logistics
- DB Schenker
- DHL
- DSV Panalpina
- FedEx
- Kuehne+Nagel
- Nippon Express
- UPS
- XPO Logistics
- Regional Player
- Agility Logistics
- Bollore Logistics
- DB Cargo Logistics
- GEFCO
- Geodis
- Hellmann Worldwide Logistics
- Kerry Logistics
- Mainfreight
- Rhenus Logistics
- TVS Supply Chain Solutions
- 新興企業
- Flexport
- Locus Logistics
- OnTime Logistics
- Senpex
- ShipMonk
The Global Event Logistics Market was valued at USD 77.5 billion in 2025 and is estimated to grow at a CAGR of 5.9% to reach USD 134.9 billion by 2035.
Market expansion is supported by the rising frequency of large-scale events worldwide and the growing need for highly coordinated, time-sensitive logistics services. Event organizers are increasingly prioritizing precision, reliability, and cost control across complex supply chains to ensure smooth execution and positive participant experiences. As events become more sophisticated and geographically dispersed, demand is increasing for logistics solutions that can manage tight schedules, minimize operational risks, and deliver seamless coordination from planning through post-event operations. The market is also benefiting from widespread digital transformation, as logistics providers adopt advanced technologies to enhance transparency, accuracy, and responsiveness. Real-time visibility and data-driven decision-making are becoming essential to meet evolving client expectations. The shift toward integrated, end-to-end logistics models is enabling better resource utilization, scalability, and consistency across multiple event locations. These developments are reinforcing the role of specialized event logistics providers as strategic partners rather than basic service vendors.
| Market Scope | |
|---|---|
| Start Year | 2025 |
| Forecast Year | 2026-2035 |
| Start Value | $77.5 Billion |
| Forecast Value | $134.9 Billion |
| CAGR | 5.9% |
The transportation segment held 36% share in 2025 and is expected to grow at a CAGR of 4.6% from 2026 to 2035. This segment holds a central position due to its responsibility for ensuring the timely movement of event-related assets. Increased use of digital tracking, connected monitoring systems, and intelligent routing platforms is improving delivery accuracy and schedule adherence.
The entertainment events segment accounted for 38% share in 2025 and is projected to grow at a CAGR of 7.1% from 2026 to 2035. High operational intensity and complex coordination requirements are driving strong reliance on technology-enabled logistics solutions within this segment, supporting its leading position.
United States Event Logistics Market held 83% share and generated USD 23 billion in 2025. Regional leadership is supported by advanced infrastructure and early adoption of digital logistics platforms that enhance efficiency, monitoring, and coordination.
Key companies operating in the Global Event Logistics Market include DHL, UPS, FedEx, Kuehne + Nagel, DB Schenker, C.H. Robinson, XPO Logistics, CEVA Logistics, Nippon Express, and DSV Panalpina. Companies in the Global Event Logistics Market are strengthening their competitive position through technology integration, service diversification, and global network expansion. Many providers are investing in digital platforms that enable real-time visibility, predictive planning, and centralized coordination across event supply chains. Expanding end-to-end service offerings allows companies to manage transportation, storage, on-site handling, and reverse logistics more efficiently. Strategic partnerships with event organizers and venue operators help secure long-term contracts. Firms are also enhancing sustainability initiatives by optimizing routes and reducing emissions.
Table of Contents
Chapter 1 Methodology & Scope
- 1.1 Market scope and definition
- 1.2 Research design
- 1.2.1 Research approach
- 1.2.2 Data collection methods
- 1.3 Data mining sources
- 1.3.1 Global
- 1.3.2 Regional/Country
- 1.4 Base estimates and calculations
- 1.4.1 Base year calculation
- 1.4.2 Key trends for market estimation
- 1.5 Primary research and validation
- 1.5.1 Primary sources
- 1.6 Forecast
- 1.7 Research assumptions and limitations
Chapter 2 Executive Summary
- 2.1 Industry 360° synopsis, 2022 - 2035
- 2.2 Key market trends
- 2.2.1 Regional
- 2.2.2 Service
- 2.2.3 Event Size
- 2.2.4 Application
- 2.2.5 End Use
- 2.3 TAM Analysis, 2026-2035
- 2.4 CXO perspectives: Strategic imperatives
- 2.4.1 Executive decision points
- 2.4.2 Critical success factors
- 2.5 Future outlook and strategic recommendations
Chapter 3 Industry Insights
- 3.1 Industry ecosystem analysis
- 3.1.1 Supplier Landscape
- 3.1.2 Profit Margin
- 3.1.3 Cost structure
- 3.1.4 Value addition at each stage
- 3.1.5 Factor affecting the value chain
- 3.1.6 Disruptions
- 3.2 Industry impact forces
- 3.2.1 Growth drivers
- 3.2.1.1 Rising Number of Global Events
- 3.2.1.2 Need for Time-Critical & Reliable Delivery
- 3.2.1.3 Adoption of Digital & Smart Logistics Technologies
- 3.2.1.4 Growth of Corporate Branding & Experiential Marketing
- 3.2.2 Industry pitfalls and challenges
- 3.2.2.1 High Operational Complexity & Risk
- 3.2.2.2 Limited Margins & High-Cost Sensitivity
- 3.2.3 Market opportunities
- 3.2.3.1 Expansion of hybrid, virtual & global events
- 3.2.3.2 Sustainable & green event logistics solutions
- 3.2.3.3 Expansion of cloud-based and integrated platforms
- 3.2.3.4 Adoption of AI- and ML-driven logistics solutions
- 3.2.1 Growth drivers
- 3.3 Growth potential analysis
- 3.4 Regulatory landscape
- 3.4.1 North America
- 3.4.1.1 U.S.: OSHA & Federal Event Safety Guidelines
- 3.4.1.2 Canada: Transport Canada & WorkSafe Guidelines
- 3.4.2 Europe
- 3.4.2.1 Germany: BMVI & DGUV Regulations
- 3.4.2.2 France: DGME & CNES Guidelines
- 3.4.2.3 UK: MCA & HSE Regulations
- 3.4.2.4 Italy: ENAC & INAIL Guidelines
- 3.4.3 Asia Pacific
- 3.4.3.1 China: Ministry of Transport & Event Safety Regulations
- 3.4.3.2 Japan: JCAB & MLIT Guidelines
- 3.4.3.3 South Korea: MOLIT & Safety Guidelines
- 3.4.3.4 India: Ministry of Shipping & Dock Safety Rules
- 3.4.4 Latin America
- 3.4.4.1 Brazil: ANTAQ & Ministry of Infrastructure Guidelines
- 3.4.4.2 Mexico: SEMAR & DGPM Regulations
- 3.4.5 Middle East and Africa
- 3.4.5.1 UAE: Ministry of Energy & Infrastructure Regulations
- 3.4.5.2 Saudi Arabia: Saudi Ports Authority Guidelines
- 3.4.1 North America
- 3.5 Porter';s analysis
- 3.6 PESTEL analysis
- 3.7 Technology and Innovation Landscape
- 3.7.1 Current technological trends
- 3.7.2 Emerging technologies
- 3.8 Price trends
- 3.8.1 By region
- 3.8.2 By product
- 3.9 Cost breakdown analysis
- 3.10 Patent analysis
- 3.11 Sustainability and Environmental Aspects
- 3.11.1 Sustainable practices
- 3.11.2 Waste reduction strategies
- 3.11.3 Energy efficiency in production
- 3.11.4 Eco-friendly initiatives
- 3.11.5 Carbon footprint considerations
- 3.12 Use case scenarios
- 3.13 Pricing, Commercial & Revenue Model Analysis
- 3.14 Demand-Side Buying Behavior & Decision Framework
Chapter 4 Competitive Landscape, 2025
- 4.1 Introduction
- 4.2 Company market share analysis
- 4.2.1 North America
- 4.2.2 Europe
- 4.2.3 Asia Pacific
- 4.2.4 Latin America
- 4.2.5 Middle East & Africa
- 4.3 Competitive analysis of major market players
- 4.4 Competitive positioning matrix
- 4.5 Strategic outlook matrix
- 4.6 Key developments
- 4.6.1 Mergers & acquisitions
- 4.6.2 Partnerships & collaborations
- 4.6.3 New product launches
- 4.6.4 Expansion plans and funding
Chapter 5 Market Estimates & Forecast, By Service, 2022 - 2035 ($ Bn)
- 5.1 Key trends
- 5.2 Transportation
- 5.3 Warehousing and storage
- 5.4 Inventory management
- 5.5 On-site setup and dismantling
- 5.6 Logistics planning and Coordination
- 5.7 Others
Chapter 6 Market Estimates & Forecast, By Event Size, 2022 - 2035 ($ Bn)
- 6.1 Key trends
- 6.2 Small (up to 500 attendees)
- 6.3 Medium (500 to 2,000 attendees)
- 6.4 Large (2,000 to 10,000 attendees)
- 6.5 Mega (over 10,000 attendees)
Chapter 7 Market Estimates & Forecast, By Application, 2022 - 2035 ($ Bn)
- 7.1 Key trends
- 7.2 Corporate Events
- 7.3 Sports Events
- 7.4 Entertainment Events
- 7.5 Public Events
- 7.6 Private Events
Chapter 8 Market Estimates & Forecast, By End Use, 2022 - 2035 ($ Bn)
- 8.1 Key trends
- 8.2 Corporate and commercial
- 8.3 Entertainment & media
- 8.4 Sports
- 8.5 Government & public sector
- 8.6 Educational institutions
Chapter 9 Market Estimates & Forecast, By Region, 2022 - 2035 ($ Bn)
- 9.1 Key trends
- 9.2 North America
- 9.2.1 US
- 9.2.2 Canada
- 9.3 Europe
- 9.3.1 UK
- 9.3.2 Germany
- 9.3.3 France
- 9.3.4 Italy
- 9.3.5 Spain
- 9.3.6 Belgium
- 9.3.7 Netherlands
- 9.3.8 Sweden
- 9.4 Asia Pacific
- 9.4.1 China
- 9.4.2 India
- 9.4.3 Japan
- 9.4.4 Australia
- 9.4.5 Singapore
- 9.4.6 South Korea
- 9.4.7 Vietnam
- 9.4.8 Indonesia
- 9.5 Latin America
- 9.5.1 Brazil
- 9.5.2 Mexico
- 9.5.3 Argentina
- 9.6 MEA
- 9.6.1 UAE
- 9.6.2 South Africa
- 9.6.3 Saudi Arabia
Chapter 10 Company Profiles
- 10.1 Global Player
- 10.1.1 C.H. Robinson
- 10.1.2 CEVA Logistics
- 10.1.3 DB Schenker
- 10.1.4 DHL
- 10.1.5 DSV Panalpina
- 10.1.6 FedEx
- 10.1.7 Kuehne + Nagel
- 10.1.8 Nippon Express
- 10.1.9 UPS
- 10.1.10 XPO Logistics
- 10.2 Regional Player
- 10.2.1 Agility Logistics
- 10.2.2 Bollore Logistics
- 10.2.3 DB Cargo Logistics
- 10.2.4 GEFCO
- 10.2.5 Geodis
- 10.2.6 Hellmann Worldwide Logistics
- 10.2.7 Kerry Logistics
- 10.2.8 Mainfreight
- 10.2.9 Rhenus Logistics
- 10.2.10 TVS Supply Chain Solutions
- 10.3 Emerging Players
- 10.3.1 Flexport
- 10.3.2 Locus Logistics
- 10.3.3 OnTime Logistics
- 10.3.4 Senpex
- 10.3.5 ShipMonk
 2026-2030年全球活動物流市場
 全球活動物流市場:市場規模、佔有率、趨勢分析(按類型、應用和地區)、展望和預測(2025-2032年)
 活動物流市場分析及預測至 2033 年:依類型、產品、服務、技術、組件、應用、流程、最終用戶、解決方案、階段
 亞太活動物流:市場佔有率分析、產業趨勢與成長預測(2025-2030 年)
 亞太地區活動物流市場預測至 2031 年 - 區域分析 - 按類型和最終用戶
 北美活動物流市場預測至 2031 年 - 區域分析 - 按類型和最終用戶
 歐洲活動物流市場預測至 2031 年 - 區域分析 - 按類型和最終用戶
 活動物流市場規模、佔有率、趨勢分析報告:按類型、按應用、按地區、細分市場預測,2024-2030 年
 活動物流市場規模和預測、全球和區域佔有率、趨勢和成長機會分析報告範圍:按類型、最終用戶和地理位置