

 |
市場調查報告書
商品編碼
2066763
混合動力汽車電池:市場佔有率分析、產業趨勢與統計及成長預測(2026-2031)Hybrid Electric Vehicle Battery - Market Share Analysis, Industry Trends & Statistics, Growth Forecasts (2026 - 2031) |
||||||
※ 本網頁內容可能與最新版本有所差異。詳細情況請與我們聯繫。
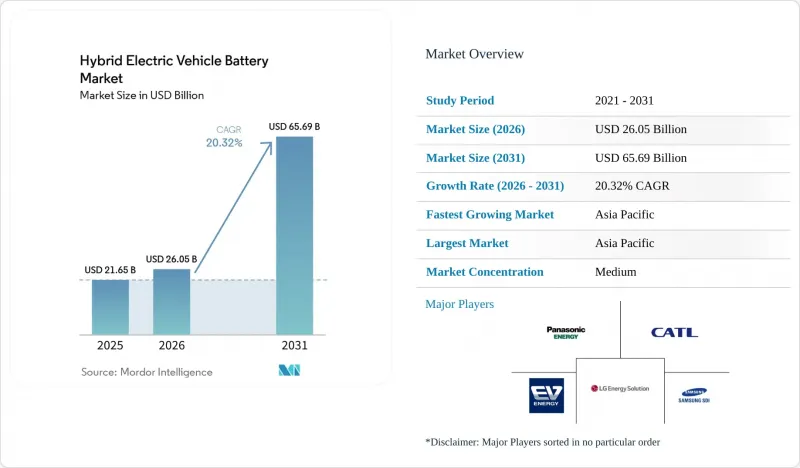
據 Mordor Intelligence 稱,混合動力電動車電池的市場規模預計在 2026 年達到 260.5 億美元,高於 2025 年的 216.5 億美元,預計到 2031 年將達到 656.9 億美元。
預計從 2026 年到 2031 年,其複合年成長率將達到 20.32%。
本報告按電池化學成分(鋰離子電池、鎳氫電池、鉛酸電池等)、混合程度(輕度混合動力、完全混合動力等)、電壓等級(60V 或以下、60-200V、200-400V、400V 或以上)、南美車輛類別(乘用車、商用車、摩托車和三輪地區分類車、北美地區(乘用車、歐洲地區分類車等)。
全球混合動力汽車電池市場趨勢及洞察
在二氧化碳排放法規的約束下,混合動力汽車的生產正在擴大。
歐盟、中國和加州的二氧化碳排放法規正促使汽車製造商擴大混合動力汽車的生產,以彌補實現100%零排放銷售目標的差距。每輛車二氧化碳排放超標將被處以95歐元的罰款,這無疑為混合動力汽車的發展提供了明確的經濟誘因。豐田與Panasonic簽訂的40GWh鋰離子電池採購合約以及Stellantis公司120萬輛混合動力汽車的產能,都是這一趨勢的典型例證。中國的雙軌制進一步激勵了長續航里程插電式混合動力汽車的發展,鼓勵汽車製造商使用更大容量的電池組。這些政策的共同作用,正在加速許多主流品牌推出混合動力汽車的步伐。
鋰離子電池每千瓦時價格大幅下降,能量密度增加。
隨著澳洲和智利新增礦產產能的擴大緩解了碳酸鋰供不應求,2024年鋰離子電池組價格年減20%,至每千瓦時115美元,這是自2017年以來的最大降幅。根據成本學習曲線,預計累積產量每加倍,價格將下降約25%。寧德時代(CATL)的「麒麟」設計(從電芯到電池包)將能量密度提升至255瓦時/公斤,使插電式混合動力汽車的純電續航里程達到100公里,而無需對電池組進行過度設計。在中國,磷酸鐵鋰電池的價格已降至每千瓦時100美元以下,為進入先前由鉛酸電池主導的輕度混合動力車和摩托車市場創造了機會。
電動車競爭中關鍵金屬的供應風險
到2030年,鋰需求量可能達到330萬噸,是2022年的六倍。此外,純電動車(BEV)的鋰消耗量是混合動力汽車的3到5倍。鈷供應仍集中在剛果民主共和國(DRC),而鎳加工則主要由印尼主導。價格波動使長期供應合約變得複雜。碳酸鋰的價格已從2022年的每噸8萬美元暴跌至2024年底的每噸1萬美元,阻礙了新的採礦投資。雖然混合動力汽車電池組的小型化降低了絕對風險,但簽訂多年合約的純電動車製造商仍然容易受到現貨價格波動的影響。
細分市場分析
預計到2025年,在混合動力汽車電池市場,鋰離子電池將佔據75.12%的市場佔有率,而固態電池和鈉離子電池預計到2031年將以每年34.1%的速度成長。鋰離子電池供應商不斷改進NMC和LFP配方,減少鈷的使用量並提高體積效率。豐田和日產計劃在2028年開始商業化全固態電池,目標是實現500 Wh/kg的電芯,從而在不增加電池組尺寸的情況下將純電動續航里程提高一倍。寧德時代的鈉離子電池原型已實現160 Wh/kg的能量密度,並在低溫環境下表現出優異的能量維持性能,預計將應用於寒冷氣候地區的入門級混合動力汽車。鎳氫電池目前主要在東南亞和其他一些地區使用,在這些地區,成本績效和熱穩定性比能量密度更為重要。鉛酸電池則僅限於輔助12V系統。預計到總合,以鋰離子電池為主導的混合動力電動車電池市場規模將達到近 468 億美元,而新興的化學電池預計同年將超過 73.5 億美元。
激烈的專利環境正在重塑競爭格局。豐田擁有超過1,300項固態固態電池相關專利,而寧德時代和比亞迪則掌控著從電芯到電池組的關鍵設計。對於希望避免訴訟的後進企業,專利授權正成為可行的選擇。總體而言,混合動力汽車電池產業預計將出現多種化學體系共存的局面。鋰離子電池在銷售方面仍將保持主導,但隨著固態電池固態電池規模的擴大,其在利潤率方面的主導可能會被超越。
到2025年,輕度混合動力車將佔總銷售量的43.12%,成為車隊營運商快速達到二氧化碳排放目標的最低成本合規選擇。預計到2031年,輕度混合動力汽車電池市場規模將超過222.4億美元,年複合成長率達22.6%。全混合動力車在日本和北美仍然很受歡迎,這得益於20年的可靠性數據。插電式混合動力汽車在歐洲受益於企業車隊的稅收優惠,但在快速充電網路不發達的新興市場則面臨挑戰。以理想汽車為首的增程器系統在中國等地已廣泛應用,但其全球前景取決於排放的處理方式。汽車製造商在混合動力車型中採用相同的電池規格以確保規模經濟,但軟體標定方面存在顯著差異,這增加了工程複雜性,並使垂直整合的供應商更具優勢。
插電式混合動力汽車(PHEV)的成長將取決於監管機構是否會在下一階段的標準中繼續認可低二氧化碳排放測試循環評估。在德國,2024年購車補貼的逐步取消導致PHEV註冊量減半,顯示市場對政策變化十分敏感。在新興市場,配備無需充電且容量較小的電池組的傳統混合動力汽車仍然是實現電氣化的實用入門選擇。
區域分析
預計到2025年,亞太地區將佔全球電池銷售額的47.35%,並在2031年之前維持22.3%的複合年成長率。這主要得益於中國75%的電池產量以及寧德時代(CATL)37.5%的廠商市場佔有率佔有率。韓國和日本供應商正將生產轉移到美國和歐洲以規避地緣政治壁壘,但仍繼續從國內工廠出口高價值的電極和隔膜。印度快速成長的摩托車市場依賴進口電芯,並計劃透過一項24億美元的生產連結獎勵計畫計畫來填補供應缺口。
預計到2025年,歐洲將佔全球銷售量的28.15%。補貼的結束嚴重打擊了插電式混合動力車的需求,但由於稅收優惠,插電式混合動力車在企業用車領域仍然很受歡迎。歐盟電池法規強制要求揭露碳足跡並制定回收標準,迫使超級工廠營運商轉型為閉合迴路模式。 Northvolt的倒閉凸顯了來自亞洲進口的成本壓力,但LG能源解決方案公司和三星SDI正在波蘭和匈牙利推進大型項目,以維持區域供應。
預計到2025年,北美將佔全球銷售額的17.65%。由於《通膨控制法案》及其對零件原產地的規定,LG能源解決方案公司、三星SDI和Panasonic宣布將聯合投資115億美元用於電池領域。墨西哥正尋求透過在新萊昂州推廣免稅電池組組裝,來確立其作為近岸外包替代方案的地位。南美洲和中東/非洲合計佔全球市場佔有率的6.85%。巴西在乙醇混合動力汽車的努力以及阿拉伯聯合大公國引入電動公車,都清楚地展現了各地區正在採取的不同策略。
其他好處:
- Excel格式的市場預測(ME)表
- 3個月的分析師支持
目錄
第1章:引言
- 研究假設和市場定義
- 調查範圍
第2章:調查方法
第3章執行摘要
第4章 市場狀況
- 市場概覽
- 市場促進因素
- 二氧化碳排放法規下混合動力汽車產量增加
- 鋰離子電池每千瓦時價格大幅下降,能量密度增加。
- 原始設備製造商從鎳氫電池過渡到鋰離子電池
- 48V 微型混合動力電池的蓬勃發展催生了對低成本鋰離子電池的需求。
- 強制回收產生的再生金屬供應
- 透過人工智慧驅動的雲端電池管理系統延長電池保固期
- 市場限制因素
- 電動車競爭中關鍵金屬的供應風險
- 新興國家插電式混合動力汽車快速充電基礎設施不足
- 小型電池組熱失控的設計問題
- 對中國電池智慧財產權的地緣政治監視
- 供應鏈分析
- 監理情勢
- 技術展望
- 波特五力模型
第5章 市場規模與成長預測
- 電池化學成分
- 鋰離子電池(NMC、NCA、LFP、LTO)
- 鎳氫電池(NiMH)
- 鉛酸
- 新興的固態電池/鈉離子電池
- 按雜交程度
- 輕度混合動力(48V MHEV)
- 全混合動力(HEV)
- 插電式混合動力車(PHEV)
- 有效距離式混合動力汽車
- 電壓等級
- 60伏特或以下
- 60~200 V
- 200~400 V
- 400伏特或以上
- 按車輛類型
- 搭乘用車
- 商用車輛
- 兩輪/三輪車
- 非公路及特殊用途
- 按地區
- 北美洲
- 美國
- 加拿大
- 墨西哥
- 歐洲
- 德國
- 英國
- 法國
- 義大利
- 西班牙
- 荷蘭
- 挪威
- 俄羅斯
- 其他歐洲國家
- 亞太地區
- 中國
- 印度
- 日本
- 韓國
- 東南亞國協
- 澳洲和紐西蘭
- 其他亞太國家
- 南美洲
- 巴西
- 阿根廷
- 哥倫比亞
- 其他南美國家
- 中東和非洲
- 沙烏地阿拉伯
- 阿拉伯聯合大公國
- 南非
- 埃及
- 其他中東和非洲國家
- 北美洲
第6章 競爭情勢
- 市場集中度
- 策略趨勢(併購、聯盟、購電協議)
- 市場佔有率分析(主要公司的市場排名和佔有率)
- 公司簡介
- Primearth EV Energy(PEVE)
- Panasonic Energy Co.
- LG Energy Solution
- Contemporary Amperex Technology(CATL)
- Samsung SDI
- BYD Company Ltd
- AESC(Envision)
- Gotion High-Tech
- SK On
- EnerSys
- Saft Groupe SA
- Exide Industries
- East Penn Manufacturing
- Hitachi Astemo
- Amperex Technology Ltd(ATL)
- Amte Power
- Clarios
- Microvast
- Farasis Energy
- Romeo Power
第7章 市場機會與未來展望
According to Mordor Intelligence, hybrid electric vehicle battery market size in 2026 is estimated at USD 26.05 billion, growing from 2025 value of USD 21.65 billion with 2031 projections showing USD 65.69 billion, growing at 20.32% CAGR over 2026-2031.
This report is Segmented by Battery Chemistry (Lithium-Ion, Nickel-Metal Hydride, Lead-Acid, and More), Degree of Hybridization (Mild Hybrid, Full Hybrid, and More), Voltage Class (Up To 60V, 60 To 200V, 200 To 400V, and Above 400V), Vehicle Class (Passenger Cars, Commercial Vehicles, Two-/Three-Wheelers, and More), and Geography (North America, Europe, Asia-Pacific, South America, and More).
Global Hybrid Electric Vehicle Battery Market Trends and Insights
Escalating HEV Production Volumes Under CO2 Mandates
CO2 regulations in the European Union, China, and California are prompting automakers to scale hybrid output to bridge the gap to 100% zero-emission sales targets. Non-compliance fines that hit EUR 95 per gram of CO2 overshoot per vehicle create a clear economic case for hybrids. Toyota's 40 GWh lithium-ion sourcing deal with Panasonic and Stellantis's 1.2 million-unit hybrid capacity are emblematic responses. China's dual-credit regime further rewards long-range plug-in hybrids, nudging OEMs to enlarge battery packs. These converging policies have raised hybrid launch velocity at most mainstream brands.
Rapid Fall in Li-ion $/kWh & Higher Energy Density
Lithium-ion pack prices fell 20% year over year to USD 115 per kWh in 2024, the sharpest decline since 2017, as new mining capacity in Australia and Chile relieved lithium carbonate shortages. Cost learning curves show that each doubling of cumulative output trims prices by roughly 25%. CATL's cell-to-pack Qilin design lifts energy density to 255 Wh/kg and demonstrates 100 km electric-only range in plug-in hybrids without oversizing the pack. LFP cells have slipped below USD 100 per kWh in China, opening mild-hybrid and two-wheeler opportunities previously reserved for lead-acid units.
Critical-Metal Supply Risk Amid BEV Competition
Lithium demand could hit 3.3 million t by 2030, six times 2022 usage, and BEVs consume three to five times more per vehicle than hybrids. Cobalt remains heavily concentrated in the DRC, while Indonesia dominates nickel processing. Price volatility complicates long-term supply deals; lithium carbonate plunged from USD 80,000/t in 2022 to USD 10,000/t in late 2024, deterring fresh mine investment. Smaller hybrid packs reduce absolute exposure but do not escape spot-price swings when BEV makers lock in multi-year contracts.
Other drivers and restraints analyzed in the detailed report include:
- OEM Migration From NiMH to Li-ion Chemistries
- 48 V Micro-Hybrid Boom Creating Low-Cost Li-ion Demand
- Sparse PHEV Fast-Charge Infrastructure in Emerging Markets
For complete list of drivers and restraints, kindly check the Table Of Contents.
Segment Analysis
Lithium-ion technologies captured 75.12% of 2025 revenue for the hybrid electric vehicle battery market, yet solid-state and sodium-ion batteries are forecast to grow 34.1% annually to 2031. Lithium-ion vendors continue to refine NMC and LFP blends, cutting cobalt usage and improving volumetric efficiency. Toyota and Nissan plan solid-state commercial launches before 2028, targeting 500 Wh/kg cells that could double electric-only range without enlarging packs. Sodium-ion prototypes from CATL already deliver 160 Wh/kg and superior cold-weather retention, positioning the chemistry for entry-level hybrids in colder climates. Nickel-metal hydride endures where affordability and thermal stability trump energy density, chiefly in Southeast Asia. Lead-acid is relegated to auxiliary 12 V systems. The hybrid electric vehicle battery market size attributable to lithium-ion is expected to approach USD 46.8 billion by 2031, while emerging chemistries will jointly exceed USD 7.35 billion that year.
A tightening patent landscape is shaping competitive behavior. Toyota holds more than 1,300 solid-state-related patents, whereas CATL and BYD control key cell-to-pack designs. Licensing is becoming a realistic path for latecomers wishing to avoid litigation. Overall, the hybrid electric vehicle battery industry anticipates a multi-chemistry coexistence, with lithium-ion retaining volume leadership but ceding margin leadership to solid-state once scale materializes.
Mild hybrids achieved 43.12% unit volume in 2025, delivering the lowest-cost compliance option for fleets that must hit CO2 targets quickly. The hybrid electric vehicle battery market size generated by mild hybrids is projected to surpass USD 22.24 billion in 2031, rising at a 22.6% CAGR. Full hybrids remain popular in Japan and North America thanks to two decades of reliability data. Plug-in hybrids enjoy corporate-fleet tax benefits in Europe but struggle in emerging markets that lack fast-charging networks. Range-extender architectures thrive mainly in China, led by Li Auto, though their global prospects hinge on emissions-credit treatment. Automakers are bundling identical cell formats across hybrid types to secure scale economies, yet software calibration differs markedly, increasing engineering complexity and favoring vertically integrated suppliers.
PHEV growth will depend on whether regulators continue to count their low CO2 test-cycle ratings in the next phase of standards. Germany's phase-out of purchase rebates in 2024 cut PHEV registrations by half, showing sensitivity to policy shifts. In emerging economies, conventional hybrids with no charging requirement and low-kWh packs remain the practical electrification entry point.
Geography Analysis
Asia-Pacific accounted for 47.35% of 2025 revenue and is forecast to register a 22.3% CAGR through 2031, propelled by China's 75% cell-production share and CATL's 37.5% vendor position. Korean and Japanese suppliers are localizing output in the United States and Europe to evade geopolitical barriers, yet they continue to ship high-value electrodes and separators from domestic plants. India's fast-growing two-wheeler segment relies on imported cells, and its USD 2.4 billion production-linked incentive scheme seeks to fill that supply gap.
Europe held 28.15% of 2025 revenue. Subsidy withdrawals hurt plug-in demand, but corporate fleets still favor PHEVs for tax advantages. The EU Battery Regulation now obliges carbon-footprint declarations and recycling thresholds, pushing gigafactory operators into closed-loop models. Northvolt's insolvency underlines cost pressure from Asian imports, while LG Energy Solution and Samsung SDI advance large projects in Poland and Hungary to maintain regional supply.
North America generated 17.65% of 2025 sales. The Inflation Reduction Act's component-origin rules are drawing USD 11.5 billion of announced battery investment from LG Energy Solution, Samsung SDI, and Panasonic. Mexico is positioning itself as a near-shoring alternative by promoting duty-free pack assembly in Nuevo Leon. South America and the Middle East-Africa combined held 6.85% share; Brazil's ethanol-hybrid initiatives and the UAE's electric-bus rollouts illustrate diverse regional strategies.
- Primearth EV Energy (PEVE)
- Panasonic Energy Co.
- LG Energy Solution
- Contemporary Amperex Technology (CATL)
- Samsung SDI
- BYD Company Ltd
- AESC (Envision)
- Gotion High-Tech
- SK On
- EnerSys
- Saft Groupe SA
- Exide Industries
- East Penn Manufacturing
- Hitachi Astemo
- Amperex Technology Ltd (ATL)
- Amte Power
- Clarios
- Microvast
- Farasis Energy
- Romeo Power
Additional Benefits:
- The market estimate (ME) sheet in Excel format
- 3 months of analyst support
TABLE OF CONTENTS
1 Introduction
- 1.1 Study Assumptions & Market Definition
- 1.2 Scope of the Study
2 Research Methodology
3 Executive Summary
4 Market Landscape
- 4.1 Market Overview
- 4.2 Market Drivers
- 4.2.1 Escalating HEV production volumes under CO2 mandates
- 4.2.2 Rapid fall in Li-ion $/kWh & higher energy density
- 4.2.3 OEM migration from NiMH to Li-ion chemistries
- 4.2.4 48 V micro-hybrid boom creating low-cost Li-ion demand
- 4.2.5 Recycling-mandate-driven secondary metals supply
- 4.2.6 AI-enabled cloud BMS extending battery warranties
- 4.3 Market Restraints
- 4.3.1 Critical-metal supply risk amid BEV competition
- 4.3.2 Sparse PHEV fast-charge infrastructure in EMs
- 4.3.3 Thermal-runaway design concerns in compact packs
- 4.3.4 Geopolitical scrutiny of Chinese battery IP
- 4.4 Supply-Chain Analysis
- 4.5 Regulatory Landscape
- 4.6 Technological Outlook
- 4.7 Porter's Five Forces
- 4.7.1 Bargaining Power of Suppliers
- 4.7.2 Bargaining Power of Buyers
- 4.7.3 Threat of New Entrants
- 4.7.4 Threat of Substitutes
- 4.7.5 Competitive Rivalry
5 Market Size & Growth Forecasts
- 5.1 By Battery Chemistry
- 5.1.1 Lithium-ion (NMC, NCA, LFP, LTO)
- 5.1.2 Nickel-Metal Hydride (NiMH)
- 5.1.3 Lead-acid
- 5.1.4 Emerging Solid-State/Sodium-ion
- 5.2 By Degree of Hybridization
- 5.2.1 Mild Hybrid (48 V MHEV)
- 5.2.2 Full Hybrid (HEV)
- 5.2.3 Plug-in Hybrid (PHEV)
- 5.2.4 Range-Extender Hybrid
- 5.3 By Voltage Class
- 5.3.1 Up to 60 V
- 5.3.2 60 to 200 V
- 5.3.3 200 to 400 V
- 5.3.4 Above 400 V
- 5.4 By Vehicle Class
- 5.4.1 Passenger Cars
- 5.4.2 Commercial Vehicles
- 5.4.3 Two-/Three-Wheelers
- 5.4.4 Off-Highway and Specialty
- 5.5 By Geography
- 5.5.1 North America
- 5.5.1.1 United States
- 5.5.1.2 Canada
- 5.5.1.3 Mexico
- 5.5.2 Europe
- 5.5.2.1 Germany
- 5.5.2.2 United Kingdom
- 5.5.2.3 France
- 5.5.2.4 Italy
- 5.5.2.5 Spain
- 5.5.2.6 Netherlands
- 5.5.2.7 Norway
- 5.5.2.8 Russia
- 5.5.2.9 Rest of Europe
- 5.5.3 Asia-Pacific
- 5.5.3.1 China
- 5.5.3.2 India
- 5.5.3.3 Japan
- 5.5.3.4 South Korea
- 5.5.3.5 ASEAN Countries
- 5.5.3.6 Australia and New Zealand
- 5.5.3.7 Rest of Asia Pacific
- 5.5.4 South America
- 5.5.4.1 Brazil
- 5.5.4.2 Argentina
- 5.5.4.3 Colombia
- 5.5.4.4 Rest of South America
- 5.5.5 Middle East and Africa
- 5.5.5.1 Saudi Arabia
- 5.5.5.2 United Arab Emirates
- 5.5.5.3 South Africa
- 5.5.5.4 Egypt
- 5.5.5.5 Rest of Middle East and Africa
- 5.5.1 North America
6 Competitive Landscape
- 6.1 Market Concentration
- 6.2 Strategic Moves (M&A, Partnerships, PPAs)
- 6.3 Market Share Analysis (Market Rank/Share for key companies)
- 6.4 Company Profiles (includes Global level Overview, Market level overview, Core Segments, Financials as available, Strategic Information, Products & Services, and Recent Developments)
- 6.4.1 Primearth EV Energy (PEVE)
- 6.4.2 Panasonic Energy Co.
- 6.4.3 LG Energy Solution
- 6.4.4 Contemporary Amperex Technology (CATL)
- 6.4.5 Samsung SDI
- 6.4.6 BYD Company Ltd
- 6.4.7 AESC (Envision)
- 6.4.8 Gotion High-Tech
- 6.4.9 SK On
- 6.4.10 EnerSys
- 6.4.11 Saft Groupe SA
- 6.4.12 Exide Industries
- 6.4.13 East Penn Manufacturing
- 6.4.14 Hitachi Astemo
- 6.4.15 Amperex Technology Ltd (ATL)
- 6.4.16 Amte Power
- 6.4.17 Clarios
- 6.4.18 Microvast
- 6.4.19 Farasis Energy
- 6.4.20 Romeo Power
7 Market Opportunities & Future Outlook
- 7.1 White-space & Unmet-Need Assessment
 歐洲混合動力電動車電池:市場佔有率分析、行業趨勢和統計數據以及成長預測(2026-2031 年)
 混合動力電動車電池市場規模、佔有率和成長分析(按電池類型、車輛類型、推進方式、製造方式和地區分類)—產業預測(2026-2033 年)中國混合動力汽車電池市場:佔有率分析、產業趨勢/統計、成長預測(2025-2030)中東和非洲混合動力電動車電池市場佔有率分析、產業趨勢、統計和成長預測(2025-2030)亞太地區混合電動汽車電池 -市場佔有率分析、產業趨勢、成長預測(2025-2030)北美混合電動汽車電池:市場佔有率分析、行業趨勢和成長預測(2025-2030)南美混合電動汽車電池:市場佔有率分析、行業趨勢和成長預測(2025-2030)印度混合電動汽車電池 -市場佔有率分析、行業趨勢和統計、成長預測(2025-2030)德國混合動力電動車電池:市場佔有率分析、產業趨勢、成長預測(2025-2030)東南亞國協混合動力汽車電池:市場佔有率分析、產業趨勢與成長預測(2025-2030)