

 |
市場調查報告書
商品編碼
2066718
電池製造設備:市場佔有率分析、產業趨勢與統計、成長預測(2026-2031)Battery Manufacturing Equipment - Market Share Analysis, Industry Trends & Statistics, Growth Forecasts (2026 - 2031) |
||||||
※ 本網頁內容可能與最新版本有所差異。詳細情況請與我們聯繫。
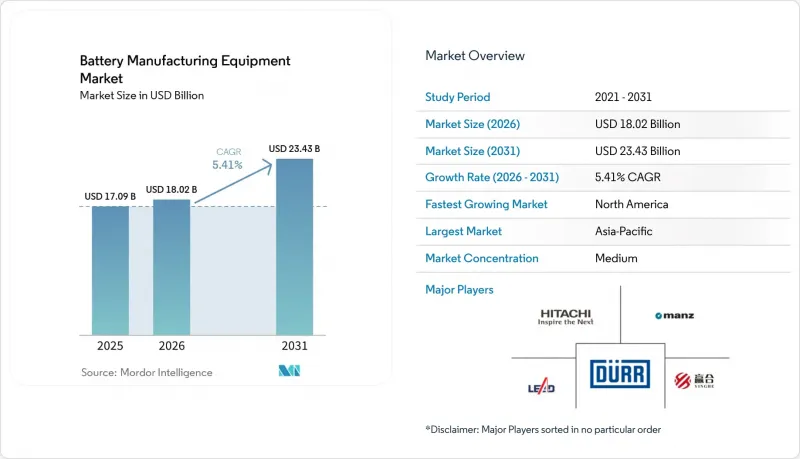
根據 Mordor Intelligence 預測,電池製造設備市場規模將從 2025 年的 170.9 億美元成長到 2026 年的 180.2 億美元,然後在 2031 年達到 234.3 億美元,2026 年至 2031 年的複合年成長率為 5.41%。
本報告按電池化學成分(鋰離子電池、全固體等)、機器類型(塗覆和乾燥系統、成型和測試線等)、自動化水平(全自動、人工智慧監督下的「無人值守」生產線等)、最終用戶(汽車原始設備製造商和一級供應商、能源儲存系統整合商等)和地區(北美、歐洲、亞太地區等)進行分類。
全球電池製造設備市場趨勢與洞察
擴大電動車產能的計畫正在迅速增加
在地緣政治風險的背景下,汽車製造商正擴大將電池生產轉移到內部,以確保供應。他們宣布,2024年鋰離子電池產能將達到1.2太瓦時(TWh),是2023年產能的三倍。福特汽車位於密西根州、投資35億美元的磷酸鋰鐵鋰電池工廠,到2026年將需要35吉瓦時(GWh)的塗層、層壓和成型設備,要求供應商能夠快速交付。通用汽車(GM)的合資企業Ultium Cells訂購了一條12吉瓦時的模組化生產線,能夠處理軟包和棱柱形電池,這表明該公司重視柔軟性,以應對未來電池化學領域的不確定性。中國巨頭寧德時代(CATL)、比亞迪和易維能源(EVE Energy)在2024年共競標了180吉瓦時的設備,但其中15%至20%的合約包含條款,允許在鋰價跌破每噸12,000美元時延遲交付,從而將商品價格納入了設備合約。大眾汽車旗下的PowerCo公司設定目標,在瓦倫西亞工廠運作後的六個月內實現95%的OEE(整體設備效率),這意味著將淘汰那些不具備即時製程控制演算法的供應商。特斯拉計劃在2024年中期前投資18億美元用於4680乾電極技術,這表明,雖然下一代電池技術有望降低每千瓦時電池的成本,但也可能使每條生產線的資本需求翻倍。
政府補貼和個人退休帳戶推動國內資金匯回
根據《通貨膨脹控制法案》(IRA) 的規定,電池可享受「先進製造生產稅額扣抵」(45 美元/千瓦時),這支撐了北美超級工廠的獲利能力,儘管其人事費用比亞洲高出 40% 至 60%。Panasonic在堪薩斯州投資 40 億美元的計畫正是依賴這項稅額扣抵。同時,LG 能源解決方案公司和 SK 安理國際公司分別申請了 12 億美元的稅收抵免,目前正在尋求無錫勵訊集團和曼茲工業公司的擔保,以確保使用美國製造的零件。歐洲的《淨零排放產業法案》提供高達資本投資 40% 的投資稅額扣抵抵免,但截至 2024 年底,成員國僅支付了 80 億歐元累計中的 21 億歐元,導致訂單延遲。加拿大向Stellantis LGES和大眾動力公司提供的13億加幣(9.62億美元)津貼60%的本地採購率,這將使丟勒和安德里茨能夠將閒置的塗料廠設備改造成電池生產線。日本2024年提供的3,500億日圓(23億美元)撥款優先用於建設全固態電池試點生產線,並配備國產真空沉澱設備,從而保護日立高新技術公司和Wurbach等企業。
承包工程項目資本投資成本高,投資回收期長。
一條年產能10GWh的全自動鋰離子電池生產線需要6.5億至8.5億美元,以目前的電池價格(每千瓦時90至110美元)計算,投資回收期為7至9年,這對缺乏雄厚財力的二線買家來說構成了一道障礙。 Northvolt公司於2024年11月破產,原因是其高達58億美元的設備債務、未結清的貸款以及企劃案融資合約條款的收緊。印度的Reliance New Energy公司在未能獲得25億美元的融資後推遲了模具訂單,這凸顯了資金籌措風險如何導致電動車銷售趨勢與機械需求脫鉤。 Manz公司2024年第三季的訂單下降了23%,因為客戶逐步停止採購,轉而購買塗層套件,同時推遲了對成型設備的投資。美國能源局(DOE) 2024 年僅批准了 170 億美元電池計畫申請中的 11 億美元。這意味著供應商只能拿到一些有條件的訂單,而這些訂單最終可能無法轉換為實際訂單。由 Durr 和 Buhler 首創的租賃模式雖然可以降低 60% 的前期成本,但也使供應商的投資回報率 (ROIC) 降至 10% 以下,從而降低了他們進行長期投資的意願。
細分市場分析
預計到2025年,鋰離子電池將佔總銷售量的83.42%,鞏固在電動車和消費性電子產品領域的強勢地位。同時,在真空沉澱設備和惰性氣氛堆垛機等相關生態系統的推動下,固態電池生產線預計將以30.2%的複合年成長率快速成長,而這些相關設備的成本幾乎是鋰離子電池的三倍(每吉瓦時)。豐田指出,硫化物電解液套件所需的資本是同等鋰離子電池的2.8倍。 Solid Power與布勒公司簽署的價值6,200萬美元的試點訂單凸顯了市場對含水量低於5ppm的環保電池日益成長的初期需求。鈉離子電池目前仍屬於小眾產品,但其規格柔軟性、性能穩定,可望在固定式儲能領域得到更廣泛的應用。傳統的鉛酸電池和鎳基電池預計將以-2.28%的複合年成長率萎縮,但其可回收性在價格敏感型市場仍然具有吸引力。
固態電池模具價格上漲,擴大了高能量密度電池製造設備的市場,促使供應商將目光轉向日本真空技術專家。這些高利潤模組,結合硫化物處理技術,彌補了成熟鋰離子電池產品線成長放緩的影響。隨著新創公司與電池開發公司直接合作開發設備,競爭格局日益激烈,設計週期也正在縮短。同時,有關回收材料含量的監管要求推動了對可與鋰離子和鈉離子電池生產線整合的回收模組的早期投資,從而實現了承包工程中化學成分的更加多樣化。
到2025年,塗覆和乾燥系統將佔據最大的銷售佔有率,達到18.84%,這反映了它們在電極品質和資本密集度方面發揮的重要作用。然而,由於下一代電池需要更長、更複雜的預處理週期,成型和測試設備的年複合成長率預計將達到12.5%。在三星SDI的第五代棱柱形電池專案中,由於需要更嚴格的壓延壽命目標,成型設備的規模擴大了一倍並安裝了額外的腔室,因此量產啟動被推遲。由於高鎳正極材料需要極高的壓緊壓力,壓延機的年複合成長率為6.05%,但分切和雷射切割領域正面臨來自中國競爭對手的價格壓力。
隨著電池停留時間的增加,超級工廠正在將預算重新分配到下游設備,擴大其在電池製造設備市場(如成型腔和人工智慧監控測試架)的佔有率。能夠將預測性維護和腔體設計相結合的供應商正在獲得定價權。同時,乾電極的採用對現有的濕塗覆製造商構成了威脅,同時也推動了對高精度壓延和真空脫氣系統的需求。這種轉變導致大量資金湧入回收和黑塊處理相關設備,因為工廠需要提前整合其報廢電池處理流程以滿足歐盟法規的要求,從而擴大了承包訂單中可供選擇的設備範圍。
區域分析
預計到2025年,亞太地區將佔全球電動車銷售額的54.73%,主要得益於中國480吉瓦時的裝置容量以及韓國的出口導向策略。然而,隨著國內電動車市場的成熟,該地區的成長率預計將放緩至3.98%的複合年成長率。中國目前佔全球訂單的38.1%,但鋰價波動導致訂單延遲交付,暴露出過度依賴國內需求的供應商的脆弱性。日本和韓國正在政府補貼的支持下加速推進固態電池試驗計畫,從而提升總合的市場佔有率。
到2025年,北美將佔全球投資的19.12%,並以12.2%的複合年成長率(CAGR)成長,成長速度居全球之首。儘管勞動成本不斷上漲,但由於《通貨膨脹控制法案》(IRA)的稅額扣抵降低了新增產能的風險,北美仍保持著這一成長動能。在美國,已宣布的2030年專案總裝置容量為320吉瓦時(GWh)。在加拿大,這一數字正以14.35%的複合年成長率成長,主要得益於Stellantis與LG能源解決方案公司(LGES)以及大眾汽車與PowerCo的合資企業。墨西哥緊隨其後,複合年成長率為9.42%,其核心是特斯拉位於新萊昂州的工廠,但基礎設施建設的延誤預計將使其運作時間推遲至多9個月。到2025年,歐洲將佔全球銷售額的21.83%,並在《淨零排放產業法案》90吉瓦時目標的推動下,以8.55%的複合年成長率成長。德國仍是歐洲的中心,佔8.4%的全球市場佔有率,但由於補貼政策尚未明確,訂單已被推遲至2025-2026年。法國和西班牙在該地區處於領先地位,汽車電池公司(Automotive Cells Company)和大眾汽車(Volkswagen)均獲得了津貼。同時,北歐國家的成長勢頭有所放緩,Nordbolt的破產導致12億歐元的未履行合約面臨不確定性。儘管資源型企業因補貼不足而尋求整合到下游產業,但南美洲(2.22%)以及中東和非洲(2.10%)的成長僅為個位數中段。
其他好處:
- Excel格式的市場預測(ME)表
- 3個月的分析師支持
目錄
第1章:引言
- 研究假設和市場定義
- 調查範圍
第2章:調查方法
第3章執行摘要
第4章 市場狀況
- 市場概覽
- 市場促進因素
- 擴大電動車產能的計畫激增
- 政府補貼和基於IRA的在岸投資
- 超級工廠每吉瓦時資本投資減少
- 開發需要高吞吐量線路的電網級儲能系統。
- 採用乾電極和無溶劑塗層
- AI 驅動的線上偵測可提高 OEE(停機執行率)。
- 市場限制因素
- 承包工程項目資本投資成本高,投資回收期長。
- 原物料價格波動導致訂單減少。
- 單元組裝自動化工程師短缺
- 加強溶劑使用法規(NMP、VOC)
- 供應鏈分析
- 監理情勢
- 技術展望
- 波特五力模型
第5章 市場規模與成長預測
- 按電池化學成分
- 鋰離子
- 固態電池
- 鈉離子
- 鉛酸
- 鎳基
- 液流電池(鋅溴電池、釩電池等)
- 按機器類型
- 塗層和乾燥系統
- 日曆出版社
- 攪拌機和均質機
- 分切機
- 雷射開槽和切割
- 電極堆疊
- 真空乾燥和脫氣
- 電解填充
- 組裝和運輸機器人
- 成型和測試線
- 包裝和密封
- 回收和黑物質處理設備
- 按自動化級別
- 手排/實驗室規模
- 半自動
- 全自動
- AI監督的「熄燈」線路
- 最終用戶
- 汽車製造商和一級供應商
- 能源儲存系統系統整合商
- 家用電子產品
- 工業和電動工具
- 航太/國防
- 其他最終用戶
- 按地區
- 北美洲
- 美國
- 加拿大
- 墨西哥
- 歐洲
- 德國
- 英國
- 法國
- 義大利
- 西班牙
- 北歐國家
- 俄羅斯
- 其他歐洲國家
- 亞太地區
- 中國
- 印度
- 日本
- 韓國
- 東南亞國協
- 澳洲和紐西蘭
- 其他亞太國家
- 南美洲
- 巴西
- 阿根廷
- 其他南美國家
- 中東和非洲
- 沙烏地阿拉伯
- 南非
- 其他中東和非洲國家
- 北美洲
第6章 競爭情勢
- 市場集中度
- 策略趨勢(併購、聯盟、購電協議)
- 市場佔有率分析(主要公司的市場排名和佔有率)
- 公司簡介
- Durr AG
- Wuxi Lead Intelligent Equipment Co., Ltd.
- Yinghe Technology Co., Ltd.
- Manz AG
- Hitachi High-Tech Corp.
- Schuler AG
- Andritz AG
- Sovema Group SpA
- Komori Corp.
- Buhler Group
- Hanwha Machinery
- PNT Group
- ABB Ltd.
- Siemens AG
- IPG Photonics Corp.
- TMAX(Xiamen Tmax Battery Equipments)
- TOB New Energy Technology Co.
- ACEY New Energy Technology
- Festo AG
- Honeywell International Inc.
第7章 市場機會與未來展望
According to Mordor Intelligence, the battery manufacturing equipment market size is expected to grow from USD 17.09 billion in 2025 to USD 18.02 billion in 2026 and is forecast to reach USD 23.43 billion by 2031 at 5.41% CAGR over 2026-2031.
This report is Segmented by Battery Chemistry (Lithium-Ion, Solid-State, and More), Machine Type (Coating and Drying Systems, Formation and Testing Lines, and More), Automation Level (Fully-Automatic, AI-Supervised "lights-Out" Lines, and More), End-User (Automotive OEMs and Tier-1s, Energy Storage System Integrators, and More), and Geography (North America, Europe, Asia-Pacific, and More).
Global Battery Manufacturing Equipment Market Trends and Insights
Surging EV Production Capacity Expansion Plans
Automakers announced 1.2 TWh of new lithium-ion capacity during 2024, triple the 2023 level, as companies bring cell production in-house to secure supply amid geopolitical risk. Ford's USD 3.5 billion lithium-iron-phosphate plant in Michigan requires 35 GWh of coating, stacking, and formation equipment by 2026, pressuring vendors for quick delivery. General Motors' Ultium Cells venture ordered 12 GWh of modular lines capable of both pouch and prismatic formats, signaling a preference for flexibility under future-chemistry uncertainty. Chinese majors CATL, BYD, and EVE Energy tendered 180 GWh of kit in 2024, yet 15-20% of contracts include clauses permitting deferral if lithium prices fall below USD 12,000 t, baking commodity risk into equipment deals. Volkswagen's PowerCo set a 95% OEE target within six months of commissioning at its Valencia plant, filtering out suppliers lacking real-time process-control algorithms. Tesla's USD 1.8 billion 4680 dry-electrode spend through mid-2024 shows that next-generation formats can double per-line capital needs even as they promise lower per-kWh cell costs.
Government Subsidies & IRA-Driven On-Shoring
The IRA's Advanced Manufacturing Production Credit of USD 45 kWh for cells underpins North American gigafactory economics despite 40-60% labor premiums over Asia. Panasonic's USD 4 billion Kansas project depends on these credits, while LG Energy Solution and SK On filed for USD 1.2 billion each and now demand U.S. content guarantees from Wuxi Lead and Manz. Europe's Net-Zero Industry Act offers investment tax credits up to 40% of equipment outlay, but member states disbursed just EUR 2.1 billion of an earmarked EUR 8 billion by late 2024, delaying orders. Canada's CAD 1.3 billion (USD 962 million) award to Stellantis-LGES and Volkswagen-PowerCo requires 60% regional content, prompting Durr and Andritz to convert idle paint-shop assets into battery-equipment lines. Japan's JPY 350 billion (USD 2.3 billion) 2024 subsidy tranche ring-fences solid-state pilot-line spend for domestic vacuum-deposition tools, protecting Hitachi High-Tech and Ulvac.
High Capex & Long Payback of Turnkey Lines
A 10 GWh fully automated lithium-ion line needs USD 650-850 million, stretching payback to 7-9 years at prevailing cell prices of USD 90-110 kWh, which deters second-tier buyers lacking robust balance sheets. Northvolt's November 2024 bankruptcy, tied to USD 5.8 billion in equipment debt, spooked lenders and tightened project-finance covenants. India's Reliance New Energy postponed tooling orders after failing to secure a USD 2.5 billion loan, underlining how finance risk decouples machinery demand from EV sales trajectories. Manz saw Q3 2024 order intake slide 23% as customers phased purchases, buying coating kits now and deferring formation spend. The U.S. DOE approved just USD 1.1 billion of the USD 17 billion requested for battery projects in 2024, leaving suppliers with conditional orders that may never convert. Leasing models pioneered by Durr and Buhler cut upfront cash by 60% but cap supplier ROIC below 10%, dampening long-term investment appetite.
Other drivers and restraints analyzed in the detailed report include:
- Grid-Scale ESS Build-Out Needing High-Throughput Lines
- Dry-Electrode & Solvent-Free Coating Adoption
- Raw-Material Price Volatility Dampening Orders
For complete list of drivers and restraints, kindly check the Table Of Contents.
Segment Analysis
Lithium-ion accounted for 83.42% of 2025 revenue, underscoring its entrenched role in EVs and consumer devices. Solid-state lines, however, are projected to surge at 30.2% CAGR, driving a parallel ecosystem of vacuum-deposition coaters and inert-atmosphere stackers that cost almost triple per GWh. Toyota indicated that the sulfide-electrolyte kit requires 2.8X the capital of lithium-ion equivalents. Solid Power's USD 62 million pilot order with Buhler highlights early demand for sub-5 ppm moisture environments. Sodium-ion remains niche but offers format flexibility that may lift adoption in stationary storage once performance stabilizes. Legacy lead-acid and nickel systems are expected to erode at -2.28% CAGR, though price-sensitive markets still value their recyclability.
The rising premium of solid-state tooling enlarges the Battery manufacturing equipment market size for niche high-energy systems and shifts supplier focus toward Japanese vacuum specialists. These high-margin modules, bundled with sulfide-handling options, offset slower growth in mature lithium-ion lines. The competitive set expands as startups co-develop equipment directly with cell innovators, shortening design cycles. Meanwhile, regulatory recycled-content mandates spur early investment in recycling modules that can be integrated alongside lithium-ion and sodium-ion primary lines, broadening the chemistry mix within turnkey packages.
Coating and drying systems captured the largest 18.84% revenue share in 2025, reflecting their role in electrode quality and capital intensity. Still, formation and testing equipment is set to expand at a 12.5% CAGR because next-generation cells require longer, more complex conditioning cycles. Samsung SDI's Gen5 prismatic program doubled its formation footprint amid tighter calendar-life targets, delaying ramp schedules until extra chambers arrived. Calendaring presses grow at a 6.05% CAGR as high-nickel cathodes demand extreme nip pressure, while slitting and laser-notching segments face price erosion from Chinese challengers.
As dwell times lengthen, gigafactories re-allocate budgets toward downstream assets, increasing the Battery manufacturing equipment market share of formation chambers and AI-supervised test racks. Suppliers able to combine predictive maintenance with chamber design gain pricing power. Simultaneously, dry-electrode adoption threatens wet-coating incumbents but lifts demand for high-precision calendaring and vacuum-degassing systems. The shift pulls capital into recycling and black-mass equipment as plants pre-integrate end-of-life flows to satisfy EU rules, widening the machine-type spread within turnkey orders.
Geography Analysis
Asia-Pacific generated 54.73% of 2025 revenue, led by China's 480 GWh installed capacity and South Korea's export orientation, though regional growth moderates to 3.98% CAGR as the domestic EV boom matures. China alone delivered 38.1% of global orders, yet lithium-price swings triggered deferrals, exposing suppliers over-reliant on local demand. Japan and South Korea accelerate solid-state pilot programs backed by government subsidies, nudging up their collective share.
North America accounted for 19.12% of 2025 spend and is advancing at a 12.2% CAGR, the fastest worldwide, as IRA credits de-risk new capacity despite higher labor costs. U.S. projects total 320 GWh announced through 2030, while Canada grows 14.35% CAGR on the back of Stellantis-LGES and Volkswagen-PowerCo ventures. Mexico follows with 9.42% CAGR, anchored by Tesla's Nuevo Leon site, though infrastructure delays extend commissioning by up to nine months. Europe secured 21.83% of 2025 revenue, expanding 8.55% CAGR under the Net-Zero Industry Act's 90 GWh target. Germany remains Europe's core at 8.4% global share, but orders back-load to 2025-2026 pending subsidy clarity. France and Spain outpace the region as Automotive Cells Company and Volkswagen unlock grants. Nordic momentum slows after Northvolt's bankruptcy clouds EUR 1.2 billion in open contracts. South America (2.22%) and Middle East & Africa (2.10%) post mid-single-digit growth as resource players eye downstream integration but lack subsidy depth.
- Durr AG
- Wuxi Lead Intelligent Equipment Co., Ltd.
- Yinghe Technology Co., Ltd.
- Manz AG
- Hitachi High-Tech Corp.
- Schuler AG
- Andritz AG
- Sovema Group S.p.A.
- Komori Corp.
- Buhler Group
- Hanwha Machinery
- PNT Group
- ABB Ltd.
- Siemens AG
- IPG Photonics Corp.
- TMAX (Xiamen Tmax Battery Equipments)
- TOB New Energy Technology Co.
- ACEY New Energy Technology
- Festo AG
- Honeywell International Inc.
Additional Benefits:
- The market estimate (ME) sheet in Excel format
- 3 months of analyst support
TABLE OF CONTENTS
1 Introduction
- 1.1 Study Assumptions & Market Definition
- 1.2 Scope of the Study
2 Research Methodology
3 Executive Summary
4 Market Landscape
- 4.1 Market Overview
- 4.2 Market Drivers
- 4.2.1 Surging EV production capacity expansion plans
- 4.2.2 Government subsidies & IRA-driven on-shoring
- 4.2.3 Falling $/GWh gigafactory CAPEX
- 4.2.4 Grid-scale ESS build-out needing high-throughput lines
- 4.2.5 Dry-electrode & solvent-free coating adoption
- 4.2.6 AI-enabled inline inspection boosting OEE
- 4.3 Market Restraints
- 4.3.1 High capex & long payback of turnkey lines
- 4.3.2 Raw-material price volatility dampening orders
- 4.3.3 Shortage of cell-assembly automation engineers
- 4.3.4 Tightening solvent-use rules (NMP, VOC)
- 4.4 Supply-Chain Analysis
- 4.5 Regulatory Landscape
- 4.6 Technological Outlook
- 4.7 Porter's Five Forces
- 4.7.1 Bargaining Power of Suppliers
- 4.7.2 Bargaining Power of Buyers
- 4.7.3 Threat of New Entrants
- 4.7.4 Threat of Substitutes
- 4.7.5 Intensity of Rivalry
5 Market Size & Growth Forecasts
- 5.1 By Battery Chemistry
- 5.1.1 Lithium-ion
- 5.1.2 Solid-state
- 5.1.3 Sodium-ion
- 5.1.4 Lead-acid
- 5.1.5 Nickel-based
- 5.1.6 Flow Batteries (Zn-Br, Vanadium etc.)
- 5.2 By Machine Type
- 5.2.1 Coating and Drying Systems
- 5.2.2 Calendaring Presses
- 5.2.3 Mixing and Homogenizers
- 5.2.4 Slitting Machines
- 5.2.5 Laser Notching and Cutting
- 5.2.6 Electrode Stacking
- 5.2.7 Vacuum Drying and Degassing
- 5.2.8 Electro-lyte Filling
- 5.2.9 Assembly and Handling Robots
- 5.2.10 Formation and Testing Lines
- 5.2.11 Packaging and Sealing
- 5.2.12 Recycling and Black-mass Processing Equipment
- 5.3 By Automation Level
- 5.3.1 Manual/Lab-scale
- 5.3.2 Semi-automatic
- 5.3.3 Fully-automatic
- 5.3.4 AI-supervised "lights-out" lines
- 5.4 By End-User
- 5.4.1 Automotive OEMs and Tier-1s
- 5.4.2 Energy Storage System Integrators
- 5.4.3 Consumer Electronics
- 5.4.4 Industrial and Power Tools
- 5.4.5 Aerospace and Defense
- 5.4.6 Other End Users
- 5.5 By Geography
- 5.5.1 North America
- 5.5.1.1 United States
- 5.5.1.2 Canada
- 5.5.1.3 Mexico
- 5.5.2 Europe
- 5.5.2.1 Germany
- 5.5.2.2 United Kingdom
- 5.5.2.3 France
- 5.5.2.4 Italy
- 5.5.2.5 Spain
- 5.5.2.6 NORDIC Countries
- 5.5.2.7 Russia
- 5.5.2.8 Rest of Europe
- 5.5.3 Asia-Pacific
- 5.5.3.1 China
- 5.5.3.2 India
- 5.5.3.3 Japan
- 5.5.3.4 South Korea
- 5.5.3.5 ASEAN Countries
- 5.5.3.6 Australia and New Zealand
- 5.5.3.7 Rest of Asia Pacific
- 5.5.4 South America
- 5.5.4.1 Brazil
- 5.5.4.2 Argentina
- 5.5.4.3 Rest of South America
- 5.5.5 Middle East and Africa
- 5.5.5.1 Saudi Arabia
- 5.5.5.2 South Africa
- 5.5.5.3 Rest of Middle East and Africa
- 5.5.1 North America
6 Competitive Landscape
- 6.1 Market Concentration
- 6.2 Strategic Moves (M&A, Partnerships, PPAs)
- 6.3 Market Share Analysis (Market Rank/Share for key companies)
- 6.4 Company Profiles (includes Global level Overview, Market level overview, Core Segments, Financials as available, Strategic Information, Products & Services, and Recent Developments)
- 6.4.1 Durr AG
- 6.4.2 Wuxi Lead Intelligent Equipment Co., Ltd.
- 6.4.3 Yinghe Technology Co., Ltd.
- 6.4.4 Manz AG
- 6.4.5 Hitachi High-Tech Corp.
- 6.4.6 Schuler AG
- 6.4.7 Andritz AG
- 6.4.8 Sovema Group S.p.A.
- 6.4.9 Komori Corp.
- 6.4.10 Buhler Group
- 6.4.11 Hanwha Machinery
- 6.4.12 PNT Group
- 6.4.13 ABB Ltd.
- 6.4.14 Siemens AG
- 6.4.15 IPG Photonics Corp.
- 6.4.16 TMAX (Xiamen Tmax Battery Equipments)
- 6.4.17 TOB New Energy Technology Co.
- 6.4.18 ACEY New Energy Technology
- 6.4.19 Festo AG
- 6.4.20 Honeywell International Inc.
7 Market Opportunities & Future Outlook
- 7.1 White-space & Unmet-Need Assessment
 全球電池製造設備市場規模、佔有率、趨勢和成長分析報告(2026-2034年)
 全球鋰電池製造設備市場規模、製造商、供應鏈、銷售管道與客戶:2021-2032年
 電池製造設備市場:按設備類型、技術、製造流程/階段和最終用戶產業分類-2026-2032年全球預測電池製造設備市場:依設備類型、電池類型、電芯形狀、產能、自動化程度及終端用戶產業分類-2026-2032年全球市場預測鋰電池滾動設備市場:按設備類型、電池化學成分、電池容量範圍、充電方式、應用、終端用戶產業分類,全球預測(2026-2032年)
 二次電池電極製造設備市場規模、佔有率及成長分析:按設備類型、應用、材料類型及地區分類-2026-2033年產業預測
 電池超級工廠市場分析及預測(至2035年):類型、產品、服務、技術、組件、應用、材料類型、製程與最終用戶
 2026年全球電池製造設備市場報告2026年全球電池製造設備市場報告全自動蛋糕糊機市場:依產品類型、容量、馬達功率、價格範圍、最終用戶和銷售管道分類-2026-2032年全球預測