


 |
市場調查報告書
商品編碼
2066714
亞太地區海洋地震探勘服務:市場佔有率分析、產業趨勢與統計及成長預測(2026-2031 年)Asia Pacific Offshore Seismic Services - Market Share Analysis, Industry Trends & Statistics, Growth Forecasts (2026 - 2031) |
||||||

※ 本網頁內容可能與最新版本有所差異。詳細情況請與我們聯繫。
根據 Mordor Intelligence 預測,亞太地區海洋地震探勘服務市場預計將從 2025 年的 8.3 億美元成長到 2026 年的 9.4 億美元,到 2031 年達到 15.5 億美元,2026 年至 2031 年的複合年預計成長率為 10.52%。
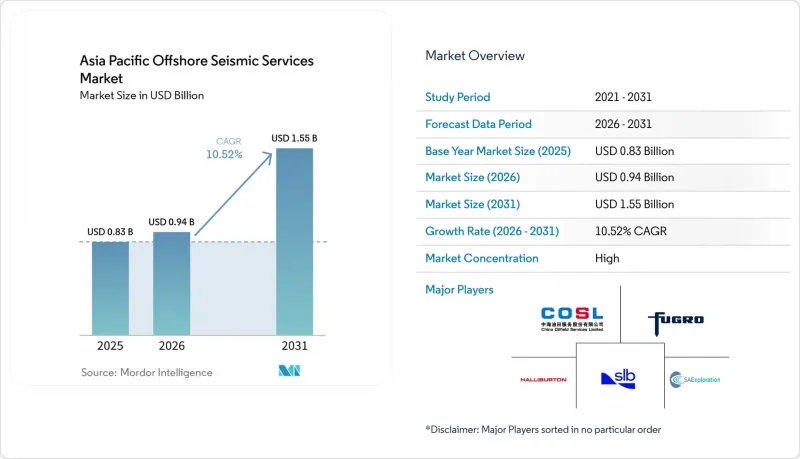
本報告按服務(資料收集及其他)、地震探勘技術(2D、3D及其他)、水深(淺水至500公尺及其他)、應用領域(石油天然氣、海洋能源及其他)和地區(中國、印度、日本、韓國、東協及其他亞太國家)進行分類。市場預測以美元計價。
亞太地區海洋地震探勘服務市場趨勢及洞察。
擴大對深海探勘與生產(E&P)的投資
國內外業者正增加500公尺及以下深度目標的探勘預算,從而持續推動對寬頻拖纜和海底節點勘測的需求。中海油惠州19-6油田在完成高密度資料擷取和全波形反演(FWI)處理後,確認蘊藏量超過1億噸油當量。富格羅(Fugro)和穆巴達拉能源(Mubadala Energy)啟動了一項價值1億美元的東南亞天然氣成像項目,預計將於2025年完成。馬來西亞國家石油公司(PETRONAS)委託PXGEO進行一項為期多年的勘測項目,該項目運作兩艘船舶,直至2027年。深水蘊藏量與成熟的淺水資產形成互補,這不僅推高了日租金,也支持了亞太地區海洋地震探勘服務市場的船舶長期運轉率。
政府主導的海上租賃輪次
快速授予採礦權縮短了從中標到首次測深的時間。在印度的OALP-X和OALP-XI專案中,85個區塊於2025年交付,從而促進了2D探勘和3D評估調查的即時開展。澳洲重新開放了奧特威盆地礦區,但在國家海洋和海洋環境保護局(NOPSEMA)駁回CGG公司的計畫後,同時加強了野生動物保護合規要求。這表明,高度透明的財務條款與更嚴格的環境審查可以並存。韓國、紐西蘭和東協成員國也正在效仿這一模式,顯著確保了亞太海洋地震探勘服務市場多年的訂單儲備。
專案核准流程漫長
監管審查可能導致調查啟動前12至18個月的延誤。 2025年,NOPSEMA駁回了CGG的奧特威項目,導致該項目需要進行全面修訂,額外支付了1,500萬美元的待命費用。在印度,如果需要與沿海社區進行磋商,環境影響評估(EIA)程序可能需要長達18個月的時間。船舶閒置時間會擠壓利潤空間,並給亞太地區海洋地震探勘服務市場的中小型承包商帶來沉重負擔。
細分市場分析
數據處理和解釋市場正以12.3%的複合年成長率快速擴張,超過了數據採集行業的成長速度(預計到2025年,數據採集市場將佔73.8%)。營運商正在授權使用經過重新處理的多客戶軟體包,例如DUG和Searcher合作的4.5萬平方英里沙撈越項目,以降低基礎設施附近探勘目標的風險並控制探勘預算。儘管資料收集仍然是核心業務,但由於船舶供應過剩,日租金正受到擠壓;而人工智慧驅動的反演分析服務則確保了高利潤率,並為亞太地區海洋地震探勘服務市場的綜合承包商的利潤成長奠定了基礎。
處理操作整合了地震波反轉、岩石學和模擬技術。在中海油的北部海灣計畫中,船上地震儀(OBC)數據和歷史拖纜數據被融合用於探測殘餘油,凸顯了跨學科解釋的價值。 TG與雪佛龍簽訂了一份為期三年的契約,透過船上預處理服務,確保了船舶運作能力並鞏固了收入前景。因此,在亞太海洋地震探勘服務市場,能夠提供涵蓋整個專案從頭到尾的工作流程的公司更受青睞。
儘管到2025年3D成像仍佔市場佔有率的45.3%,但隨著油田的成熟,4D/時移地震探勘預計將以13.1%的複合年成長率成長。中國WZ油田的時移地震探勘將不可採蘊藏量(NRMS)降低至12%,指南了加密鑽井,並有助於提高採收率。 TGS在Usan油田展示了4D分箱和協同降噪技術,目前已向亞太地區的客戶提供此技術。在資產壽命監測需求不斷成長的推動下,預計到2031年,4D服務將在亞太海洋地震探勘服務市場超越以探勘為主的2D地震探勘。
節點技術進一步提升了4D可重複性。 Shearwater的OBN工具包支援沙巴盆地時移測量序列中儲存分級的定位,從而改進了油藏管理。隨著速度模型更新對高溫高壓油氣資產至關重要,技術差異化成為贏得合約的關鍵因素。
其他好處:
- Excel格式的市場預測(ME)表
- 3個月的分析師支持
目錄
第1章:引言
- 研究假設和市場定義
- 調查範圍
第2章:調查方法
第3章執行摘要
第4章 市場狀況
- 市場概覽
- 市場促進因素
- 加大對深海探勘與生產(E&P)的投資
- 政府主導的海上租賃競標
- 為確保國內液化天然氣安全所做的努力
- 捕碳封存(CCS)位置測量的興起
- 向高密度節點採集過渡
- 市場限制因素
- 此項目的授權流程需要時間。
- 低原油價格情境導致資本投資收緊
- 環境保護活動導致地震探勘延誤
- 供應鏈分析
- 監理情勢
- 技術展望
- 波特五力模型
第5章 市場規模與成長預測
- 按服務
- 數據收集
- 數據處理與解釋
- 透過地震探勘技術
- 2D地震探勘
- 3D地震探勘
- 4D/延時地震探勘
- 海底節點(OBN)地震探勘
- 按水深
- 淺水區(小於500公尺)
- 深海(500-1500公尺)
- 超深海(超過1500公尺)
- 透過使用
- 石油和天然氣
- 海洋能源與船舶
- 二氧化碳捕集、利用與儲存(CCUS)
- 採礦和礦產探勘
- 地熱能
- 土木工程和基礎設施
- 其他(自然災害評估、環境調查、學術研究)
- 按地區
- 中國
- 印度
- 日本
- 韓國
- 東南亞國協
- 澳洲和紐西蘭
- 其他亞太國家
第6章 競爭情勢
- 市場集中度
- 策略趨勢(併購、聯盟、購電協議)
- 市場佔有率分析(主要公司的市場排名和佔有率)
- 公司簡介
- Schlumberger Limited
- Viridien SA
- PGS ASA
- TGS ASA
- Fugro NV
- China Oilfield Services Ltd(COSL)
- SAExploration Holdings Inc
- BGP Inc.
- Ion Geophysical Corp.
- Shearwater GeoServices
- EMGS
- Spectrum Geo
- Dolphin Geophysical
- GeoEx
第7章 市場機會與未來展望
According to Mordor Intelligence, the asia pacific offshore seismic services market size is expected to increase from USD 0.83 billion in 2025 to USD 0.94 billion in 2026 and reach USD 1.55 billion by 2031, growing at a CAGR of 10.52% over 2026-2031.
This report is Segmented by Service (Data Acquisition, Others), Seismic Technology (2D, 3D, Others), Water Depth (Shallow-Water Up To 500m, Others), Application (Oil and Gas, Offshore Energy and Marine, Others), and Geography (China, India, Japan, South Korea, Association of Southeast Asian Nations, Rest of Asia-Pacific). The Market Forecasts are Provided in Terms of Value (USD).
Asia Pacific Offshore Seismic Services Market Trends and Insights
Rising Deep-Water E&P Investments
National and international operators are scaling exploration budgets for prospects below 500 m, creating persistent demand for broadband streamer and ocean-bottom node surveys. CNOOC's Huizhou 19-6 discovery exceeded 100 million tonnes of oil equivalent after high-density acquisition and FWI processing. Fugro and Mubadala Energy commenced a Southeast Asian gas imaging program in 2025 valued at USD 100 million. PETRONAS entrusted PXGEO with a multi-year campaign that keeps two vessels active to 2027. Deep-water reserves offset mature shallow assets, justifying higher day rates and undergirding long-term vessel utilization across the Asia Pacific offshore seismic services market.
Government-Backed Offshore Leasing Rounds
Fast-tracked acreage releases shorten the lag between award and first shoot. India's OALP-X and OALP-XI offered 85 blocks in 2025, catalyzing immediate 2D reconnaissance and 3D appraisal commitments. Australia reopened Otway Basin acreage but simultaneously heightened wildlife compliance after NOPSEMA rejected CGG's plan, illustrating that transparent fiscal terms coexist with stricter environmental tests. South Korea, New Zealand, and ASEAN members mirror this model, ensuring a visible multiyear backlog for the Asia Pacific offshore seismic services market.
Lengthy Project Permitting Timelines
Regulatory reviews add 12-18 months to survey starts. NOPSEMA's 2025 rejection of CGG's Otway plan required a full redesign, costing an extra USD 15 million in standby fees. India's EIA pathway stretches to 18 months when coastal consultations are mandatory. Vessel idle time erodes margins, pressuring small contractors in the Asia Pacific offshore seismic services market.
Other drivers and restraints analyzed in the detailed report include:
- Push for Domestic LNG Security
- Emergence of Carbon-Capture Storage (CCS) Site Surveys
- Environmental Activism Delaying Seismic Shoots
For complete list of drivers and restraints, kindly check the Table Of Contents.
Segment Analysis
Data processing and interpretation will grow at 12.3% CAGR, faster than acquisition's dominant 73.8% 2025 share. Operators license reprocessed multi-client packages, such as the 45,000 km2 Sarawak project by DUG and Searcher, to de-risk near-infrastructure prospects and control exploration budgets. Acquisition remains core, yet vessel oversupply squeezes day rates, while AI-driven inversion services command premium margins, anchoring an expanded profit pool for integrated contractors within the Asia Pacific offshore seismic services market.
Processing workloads integrate seismic inversion, rock-physics, and simulation. CNOOC's Beibu Gulf program fused OBC and historic streamer data to detect residual oil, underscoring the value of multi-disciplinary interpretation. TGS secures vessel capacity under three-year Chevron deals, locking revenue visibility and bundling onboard preprocessing. The Asia Pacific offshore seismic services market thus rewards firms that offer cradle-to-grave workflows.
3D imaging retained 45.3% value in 2025, yet 4D/time-lapse seismic is set for 13.1% CAGR as fields mature. Time-lapse campaigns in China's WZ oilfield cut NRMS to 12%, guiding infill drilling and boosting recoveries. TGS demonstrated 4D binning and curvelet-domain co-denoise in the Usan field, a template now marketed to Asia Pacific clients. Growing asset-life surveillance ensures that 4D services eclipse reconnaissance-focused 2D surveys within the Asia Pacific offshore seismic services market by 2031.
Node technology further enhances 4D repeatability. Shearwater's OBN toolkit supports centimeter-scale positioning for Sabah Basin time-lapse sequences, bolstering reservoir management. As velocity-model updates prove essential for HPHT assets, technology differentiation becomes decisive in contract awards.
List of Companies Covered in this Report:
- Schlumberger Limited
- Viridien SA
- PGS ASA
- TGS ASA
- Fugro NV
- China Oilfield Services Ltd (COSL)
- SAExploration Holdings Inc
- BGP Inc.
- Ion Geophysical Corp.
- Shearwater GeoServices
- EMGS
- Spectrum Geo
- Dolphin Geophysical
- GeoEx
Additional Benefits:
- The market estimate (ME) sheet in Excel format
- 3 months of analyst support
TABLE OF CONTENTS
1 Introduction
- 1.1 Study Assumptions & Market Definition
- 1.2 Scope of the Study
2 Research Methodology
3 Executive Summary
4 Market Landscape
- 4.1 Market Overview
- 4.2 Market Drivers
- 4.2.1 Rising deep-water E&P investments
- 4.2.2 Government-backed offshore leasing rounds
- 4.2.3 Push for domestic LNG security
- 4.2.4 Emergence of carbon-capture storage (CCS) site surveys
- 4.2.5 Transition to high-density nodal acquisition
- 4.3 Market Restraints
- 4.3.1 Lengthy project permitting timelines
- 4.3.2 Cap-ex squeeze from low oil-price scenarios
- 4.3.3 Environmental activism delaying seismic shoots
- 4.4 Supply-Chain Analysis
- 4.5 Regulatory Landscape
- 4.6 Technological Outlook
- 4.7 Porter's Five Forces
- 4.7.1 Threat of New Entrants
- 4.7.2 Bargaining Power of Suppliers
- 4.7.3 Bargaining Power of Buyers
- 4.7.4 Threat of Substitutes
- 4.7.5 Competitive Rivalry
5 Market Size & Growth Forecasts
- 5.1 By Service
- 5.1.1 Data Acquisition
- 5.1.2 Data Processing and Interpretation
- 5.2 By Seismic Technology
- 5.2.1 2D Seismic
- 5.2.2 3D Seismic
- 5.2.3 4D/Time-Lapse Seismic
- 5.2.4 Ocean-Bottom Node (OBN) Seismic
- 5.3 By Water Depth
- 5.3.1 Shallow-water (Up to 500 m)
- 5.3.2 Deep-water (500 to 1500 m)
- 5.3.3 Ultra-deep-water (Over 1500 m)
- 5.4 By Application
- 5.4.1 Oil and Gas
- 5.4.2 Offshore Energy and Marine
- 5.4.3 Carbon Capture, Utilization and Storage (CCUS)
- 5.4.4 Mining and Mineral Exploration
- 5.4.5 Geothermal Energy
- 5.4.6 Civil Engineering and Infrastructure
- 5.4.7 Others (Natural Hazard Assessment, Environmental Studies, and Academic & Research)
- 5.5 By Geography
- 5.5.1 China
- 5.5.2 India
- 5.5.3 Japan
- 5.5.4 South Korea
- 5.5.5 ASEAN Countries
- 5.5.6 Australia and New Zealand
- 5.5.7 Rest of Asia-Pacific
6 Competitive Landscape
- 6.1 Market Concentration
- 6.2 Strategic Moves (M&A, Partnerships, PPAs)
- 6.3 Market Share Analysis (Market Rank/Share for key companies)
- 6.4 Company Profiles (includes Global level Overview, Market level overview, Core Segments, Financials as available, Strategic Information, Products & Services, and Recent Developments)
- 6.4.1 Schlumberger Limited
- 6.4.2 Viridien SA
- 6.4.3 PGS ASA
- 6.4.4 TGS ASA
- 6.4.5 Fugro NV
- 6.4.6 China Oilfield Services Ltd (COSL)
- 6.4.7 SAExploration Holdings Inc
- 6.4.8 BGP Inc.
- 6.4.9 Ion Geophysical Corp.
- 6.4.10 Shearwater GeoServices
- 6.4.11 EMGS
- 6.4.12 Spectrum Geo
- 6.4.13 Dolphin Geophysical
- 6.4.14 GeoEx
7 Market Opportunities & Future Outlook
- 7.1 White-space & Unmet-Need Assessment

 海上油氣地震測量設備及採集解決方案市場-全球產業規模、佔有率、趨勢、機會、預測:按類型、尺寸、服務類型、地區和競爭格局分類,2021-2031年
 地震探勘服務:市場佔有率分析、產業趨勢與統計、成長預測(2026-2031)
 2026年全球太空葬服務市場報告
 海底水下掩埋服務市場:按服務類型、掩埋方法、水深、計劃類型、設備類型和最終用戶分類,全球預測,2026-2032年
 地震觀測服務市場規模、佔有率、趨勢和預測:按類型、技術、部署地點、應用和地區分類,2026-2034 年地震服務市場-全球產業規模、佔有率、趨勢、機會及預測(依服務、技術、部署地點、應用、地區及競爭格局分類,2021-2031年)全球海洋地震探勘設備市場(按設備類型、探勘類型、技術和應用分類)預測(2026-2032年)沿海樁基服務市場(按樁型、服務類型、計劃規模和應用分類)-全球預測,2026-2032年海底打樁服務市場按設備類型、服務類型、安裝方法、應用和最終用戶分類,全球預測(2026-2032)海洋地震探勘設備市場:按設備類型、技術、模式、探勘類型、深度、應用和最終用戶分類的全球預測(2026-2032年)