


 |
市場調查報告書
商品編碼
2061582
地震探勘服務:市場佔有率分析、產業趨勢與統計、成長預測(2026-2031)Seismic Services - Market Share Analysis, Industry Trends & Statistics, Growth Forecasts (2026 - 2031) |
||||||

※ 本網頁內容可能與最新版本有所差異。詳細情況請與我們聯繫。
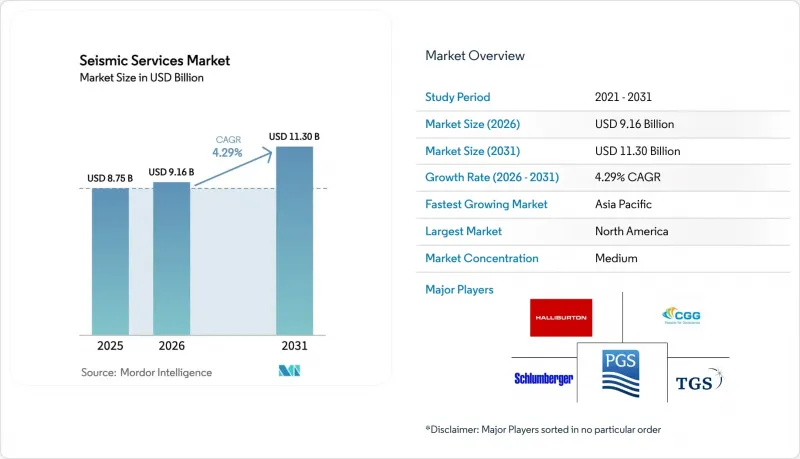
根據 Mordor Intelligence 預測,地震探勘服務市場預計將從 2025 年的 87.5 億美元成長到 2026 年的 91.6 億美元,到 2031 年達到 113 億美元,2026 年至 2031 年的複合年成長率預計為 4.29%。
本報告按服務(資料收集、資料處理和解釋)、地震探勘技術(2D地震探勘、3D地震探勘、四維/延時地震探勘、海底節點地震探勘)、部署地點(陸上和海上)、應用(石油和天然氣、海洋能源和海洋、碳捕獲、利用與封存、採礦和礦產探勘等)以及地區(北美、歐洲、亞太地區等)進行分類。
全球地震探勘服務市場趨勢及洞察
海上探勘與生產(E&P)支出復甦
2025年全球上游支出預計將達到約5,700億美元,但油氣總支出下降6%證實,只有高利潤的深水油田才能吸引額外資本。沙烏地阿美在傑夫拉傳統天然氣開展的1.7萬平方公里3D探勘計畫以及阿布達比國家石油公司(ADNOC)的鹽構造成像勘測,標誌著探勘方向正轉向複雜、高價值的儲存。由於許多探勘船仍局限於墨西哥灣和北海,服務公司不得不擴大將船隊重新部署到中東和亞太地區,這增加了重新部署的成本和實施風險。這種地理集中加劇了對能夠在後勤條件惡劣的水域獲取廣方位角、長偏移距資料的作業人員的競爭。因此,地震探勘服務市場呈現兩極化,高性能設備日租金高昂,而老舊船舶則閒置運作。
4D時移地震探勘簡介
2024年12月,國際油氣生產商協會(IOGP)發布了新的可重複性指南,降低了資料收集的不確定性,並促進了永久性監測陣列的採用。 BP在雷霆馬油田安裝的海底基準(OBN)以及北海二氧化碳捕集與儲存(CCS)項目的監管監測表明,4D成像技術如今已成為油氣最佳化和碳儲存保障的常規手段。 2025年,TGS和Shearwater GeoServices簽署了一項多年框架協議,進行基準和監測調查,從而確保了永續的收入來源,使其受經濟波動的影響小於探勘宣傳活動。即使一個年產量10億桶的油田產量僅成長2%,也足以覆蓋價值1億美元的節點陣列的成本,但由於與評估鑽井的資金競爭激烈,這種陣列在前沿地區的部署仍然有限。隨著更多CCS中心投入運作,強制性的年度3D測量或兩年一次的4D測量有望鞏固長期契約,並穩定數據所有者的收入狀況。
重新配置可再生能源領域的資本投資
殼牌、BP和道達爾能源均已將其2025年上游預算的20%以上分配給可再生能源資產。此舉直接導致其歐洲投資組合中與地震探勘相關的預算項目減少。 Equinor在北海和美國大西洋投資了23億美元用於離岸風力發電,重新分配了先前分配給其北海4D計畫的資金。投資者積極行動和監管機構對脫碳的要求正在加速這項資本轉移,甚至一些國有石油公司也在考慮投資氫能。因此,可自由支配的探勘總支出正在減少,新的多客戶專案的潛在規模正在下降,對前期資金籌措的依賴性正在增加。雖然亞洲和中東的國有石油公司在一定程度上抵消了這種下降趨勢,但地域性重新配置正在增加外匯風險,並延長資料庫所有者的銷售週期。
細分市場分析
到2025年,資料收集將佔地震探勘服務市場收入的65.8%,凸顯了拖纜陣列、陸上作業團隊和船上導航設備(OBN)船隊的高資本密集度。在巴西、中國和沙烏地阿拉伯開展的多年期資料收集項目,使得配備一流船員的船舶運轉率高達80%,從而保證了穩定的訂單儲備。然而,在CGG的GeoSoftware和SLB的Delfi等雲端平台的推動下,資料處理和解釋領域預計到2031年將以5.3%的複合年成長率成長。這些雲端平台縮短了交付時間,並整合了人工智慧驅動的屬性擷取功能。營運商擴大訂購包含數據採集和分析的整合契約,並優先選擇能夠提供端到端工作流程的供應商。隨著客戶對即時專案儀錶板、自動化品管以及基於機器學習的層析成像技術的需求不斷成長,缺乏雲端能力的小規模資料處理商面臨著被市場淘汰的風險。傳統資料庫的持續擴展進一步擴大了地震探勘服務市場在資料再處理、儲存表徵和碳儲存可行性研究方面的規模。
服務供應商正將其收入模式從基於專案的收費轉向持續軟體服務,並專注於彈性運算、容器化演算法和訂閱式授權。歐洲和中東的資料居住法要求建立區域資料中心,這推動了與超大規模雲端公司的合作。隨著基於機器學習的反演分析、岩性分析和自動斷層檢測技術的日益成熟,價值創造正向更高層級轉移,資料收集的利潤率被壓縮,而軟體的毛利率則不斷提高。這些因素共同推動著地震探勘服務市場向數位化服務領域緩慢但不可逆轉的轉型。
到2025年,3D地震探勘將佔據地震探勘服務市場41.3%的佔有率,對於鹽層、玄武岩和複雜覆蓋層下的深海域成像仍然至關重要。在巴西桑托斯盆地和圭亞那斯塔布羅克區塊的新項目中,寬方位角配置和長偏移距正逐漸成為主流。同時,四維/時移地震探勘正經歷最快的成長,預計到2031年將以7.1%的複合年成長率成長。這主要是由於必須監測北海和墨西哥灣沿岸儲存設施中二氧化碳羽流的移動。電池壽命超過180天的海底節點可同時支援3D基準探勘和四維監測探勘,從而有效地建構了一個單一的技術生態系統,有助於最佳化生產和減少排放。這種整合提高了擁有大量高適應性海底節點(OBN)的承包商的資本效率,進一步擴大了目標收入。
儘管2D地震探勘在北極巴倫支海等前沿地區仍然十分重要(Geoex計劃於2025年完成該地區的區域探勘建設),但其在總支出中所佔的佔有率卻持續下降。監管機構目前要求在許可證申請中提交更高解析度的數據,這加速了從2D到3D或稀疏海底節點(OBN)設計的轉變。更嚴格的監管、日益複雜的深海作業以及對二氧化碳捕集與儲存(CCS)技術的監管,都在推動技術格局向高密度陣列轉變,從而確保地震探勘服務市場的長期成長。
區域分析
2025年,北美地區在地震探勘服務市場收入中佔36.7%。這主要得益於墨西哥灣深海開發和加拿大沿亞伯達沿岸的探勘項目,儘管美國頁岩氣開發許可數量有所下降。美國《通膨控制法案》推動了墨西哥灣沿岸新的碳捕獲與封存(CCS)調查,而加拿大的《無污染燃料標準》則促進了針對阿爾伯塔省鹹水含水層的地震探勘計畫。儘管由於美國國家海洋和大氣管理局(NOAA)更嚴格的聲學標準導致合規成本上升,但該地區憑藉其豐富的現有基礎設施和先進的處理設施,仍然是綜合承包商的理想市場。雲端連接和資料居住要求正在推動地震探勘公司與超大規模雲端服務供應商之間的合作,從而擴大數位處理在地震探勘服務市場中的佔有率。
預計到2031年,亞太地區的複合年成長率將達到9.9%,成為全球成長最快的地區。中海油在渤海灣的探勘活動、印度石油天然氣公司在克里希納-戈達瓦里河流域的作業以及伍德賽德公司的斯卡伯勒天然氣項目,都確保了對長偏移距成像技術的持續需求。東南亞各國政府正重新開放礦區競標,以期從天然氣轉向電力,這導致2D探勘和3D評估項目激增。雖然管理體制不如歐洲嚴格,但在地採購和環境要求日益嚴格,這有利於與當地工人成立合資企業。中國新成立的探勘船隊正在擴大整體產能,並創造具有競爭力的日租金,儘管這加劇了區域內的競爭,但也推動了地震探勘服務市場的擴張。
儘管歐洲技術發展日趨成熟,但其技術水準仍領先。挪威和英國正積極推動現有油田和二氧化碳捕集與儲存(CCS)叢集採用4D和OBN(離岸節點)技術,而丹麥和德國則在離岸風力發電部署淺海地震探勘。歐盟的噪音和二氧化碳監測法規正在延長高階物理探勘的運作週期。在南美洲,巴西石油公司(Petrobras)對鹽層下下層的持續投資以及埃克森美孚在圭亞那的持續項目正在推動這一趨勢,這兩項投資都依賴高密度節點探勘。雖然資金問題有時會阻礙許可證競標,但國際石油公司(IOC)和國家石油公司(NOC)的多年承諾維持了基準的需求。在中東和非洲地區,在沙烏地阿美、阿布達比國家石油公司(ADNOC)以及奈米比亞新發現的推動下,大規模、跨季的數據收集宣傳活動正在進行中。政府對國內處理能力和資料主權的義務正在促進合資企業的發展,地震探勘服務市場正在透過本地化的價值鏈不斷擴大。
其他好處:
- Excel格式的市場預測(ME)表
- 3個月的分析師支持
目錄
第1章:引言
- 研究假設和市場定義
- 調查範圍
第2章:調查方法
第3章執行摘要
第4章 市場狀況
- 市場概覽
- 市場促進因素
- 海洋探勘開發投資的回收
- 4D時移地震探勘簡介
- NOC向深海領域的擴張
- 對離岸風力發電位置評估的需求
- 用於連續監測的光纖分散式天線系統
- CCS專案監測要求
- 市場限制因素
- 重新配置可再生能源領域的資本投資
- 對船舶噪音有嚴格的規定
- 多客戶資金池縮水
- 船東的巨額債務
- 供應鏈分析
- 監理情勢
- 技術展望
- 波特五力模型
第5章 市場規模與成長預測
- 按服務
- 數據收集
- 數據處理與解釋
- 地震探勘技術
- 2D地震探勘
- 3D地震探勘
- 4D/延時地震探勘
- 海底節點(OBN)地震探勘
- 按部署位置
- 陸上
- 離岸
- 透過使用
- 石油和天然氣
- 海洋能源與船舶
- 二氧化碳捕集、利用與儲存(CCUS)
- 採礦和礦產探勘
- 地熱能
- 土木工程和基礎設施
- 其他(自然災害評估、環境調查、學術研究)
- 按地區
- 北美洲
- 歐洲
- 亞太地區
- 南美洲
- 中東和非洲
第6章 競爭情勢
- 市場集中度
- 策略趨勢(併購、聯盟、購電協議)
- 市場佔有率分析(主要公司的市場排名和佔有率)
- 公司簡介
- Schlumberger NV
- Halliburton Company
- CGG SA
- PGS ASA
- TGS ASA
- Shearwater GeoServices Holding AS
- China Oilfield Services Ltd(COSL)
- BGP Inc. CNPC
- SAExploration Holdings Inc.
- SeaBird Exploration PLC
- Fugro NV
- Magseis Fairfield ASA
- ION Geophysical Corp.
- PXGEO
- STRYDE Ltd.
- INOVA Geophysical
- Sercel(CGG Group)
- Fairfield Geotechnologies
- Geoex Ltd.
- WesternGeco(SLB)
第7章 市場機會與未來展望
According to Mordor Intelligence, the seismic services market size is expected to increase from USD 8.75 billion in 2025 to USD 9.16 billion in 2026 and reach USD 11.30 billion by 2031, growing at a CAGR of 4.29% over 2026-2031.
This report is Segmented by Service (Data Acquisition and Data Processing and Interpretation), Seismic Technology (2D Seismic, 3D Seismic, 4D/Time-Lapse Seismic, and Ocean-Bottom Node Seismic), Deployment Location (Onshore and Offshore), Application (Oil and Gas, Offshore Energy and Marine, CCUS, Mining and Mineral Exploration, and More), and Geography (North America, Europe, Asia-Pacific, and More).
Global Seismic Services Market Trends and Insights
Rebound in Offshore E&P Spending
Global upstream outlays touched roughly USD 570 billion in 2025, yet the 6% reduction in overall oil spending confirms that only the highest-margin deepwater prospects received incremental capital. Saudi Aramco's 17,000 square-kilometer 3D program over the Jafurah unconventional gas field and ADNOC's salt-structure imaging campaigns typify the pivot toward complex, high-value reservoirs. Because many vessels remain tethered to the Gulf of Mexico and North Sea, service companies must increasingly redeploy fleets into the Middle East and Asia-Pacific, raising repositioning costs and execution risk. This geographic concentration intensifies competition for crews capable of acquiring wide-azimuth, long-offset data in logistically challenging waters. The outcome is a bifurcated seismic services market where premium assets earn strong day rates while older vessels stay cold-stacked.
Deployment of 4D Time-Lapse Seismic
The International Association of Oil & Gas Producers released new repeatability guidelines in December 2024 that reduced acquisition uncertainty and catalyzed wider adoption of permanent monitoring arrays. BP's Thunder Horse OBN installation and regulator-mandated monitoring at North Sea CCS sites demonstrate that 4D imaging is now routine for both hydrocarbon optimization and carbon storage assurance. TGS and Shearwater GeoServices secured multi-year frame agreements in 2025 to execute baseline and monitor surveys, ensuring recurring revenue streams that are less cyclical than exploration campaigns. Incremental recovery of just 2% across a 1 billion-barrel field can finance node arrays costing USD 100 million, yet adoption remains limited in frontier provinces where appraisal drilling competes for funds. As more CCS hubs enter the operational phase, mandatory annual 3D or biennial 4D surveys are set to lock in long-term contracts, smoothing the revenue profile for data owners.
Capex Reallocation to Renewables
Shell, BP, and TotalEnergies each shifted more than 20% of their 2025 upstream budgets toward renewable assets, a move that directly reduced seismic line items across European portfolios. Equinor spent USD 2.3 billion on offshore wind in the North Sea and U.S. Atlantic, diverting funds that traditionally financed North Sea 4D programs. Investor activism and regulatory decarbonization mandates are amplifying this migration of capital, and even some national oil companies are evaluating hydrogen investments. The consequence is a smaller pool of discretionary exploration spending, lowering the potential size of new multi-client programs and increasing reliance on pre-funding. Asian and Middle Eastern NOCs partially offset the reduction, yet the geographic rebalancing raises currency risk and lengthens sales cycles for data library owners.
Other drivers and restraints analyzed in the detailed report include:
- NOC Expansion into Deepwater Frontiers
- Offshore Wind Site Assessment Demand
- Strict Marine Noise Regulations
For complete list of drivers and restraints, kindly check the Table Of Contents.
Segment Analysis
Data Acquisition accounted for 65.8% of 2025 revenue within the seismic services market, illustrating the capital intensity of streamer spreads, land crews, and OBN fleets. Multi-year acquisition projects in Brazil, China, and Saudi Arabia keep vessel utilization above 80% for modern crews, supporting a stable backlog. Yet Data Processing and Interpretation is forecast to grow at a 5.3% CAGR through 2031, propelled by cloud platforms such as CGG's GeoSoftware and SLB's Delfi that shorten delivery cycles and embed AI-driven attribute extraction. Operators increasingly award integrated contracts that bundle acquisition with analytics, favoring providers capable of delivering end-to-end workflows. Small-scale processing houses without cloud capabilities risk marginalization as clients insist on real-time project dashboards, automated quality control, and machine-learning tomography. The continuous expansion of legacy data libraries further enlarges the seismic services market size for reprocessing, reservoir characterization, and carbon storage feasibility studies.
Providers emphasize elastic compute, containerized algorithms, and subscription licenses to shift revenue models from project billing toward recurring software services. Data residency laws in Europe and the Middle East require regional data centers, prompting alliances with hyperscale cloud firms. As machine-learning inversion, facies classification, and automated fault picking mature, value capture migrates up the stack, compressing acquisition margins but elevating software gross profit. The combined effect is a gradual but irreversible redistribution of the seismic services market toward digital services.
3D Seismic held 41.3% of the seismic services market share in 2025, remaining indispensable for deepwater imaging beneath salt, basalt, and complex overburden. Wide-azimuth configurations and longer offsets dominate new programs in Brazil's Santos Basin and Guyana's Stabroek block. Meanwhile, 4D/Time-Lapse Seismic exhibits the fastest expansion, at a projected 7.1% CAGR to 2031, underpinned by mandatory surveillance of CO2 plume migration at North Sea and Gulf Coast storage sites. Ocean-bottom nodes with battery lives surpassing 180 days support both 3D baseline and 4D monitor acquisitions, effectively creating a single technology ecosystem that serves production optimization and emission mitigation. The convergence heightens capital efficiency for contractors owning adaptable OBN inventories, further enlarging addressable revenue.
2D Seismic retains relevance for reconnaissance in frontier provinces such as the Arctic Barents Sea, where Geoex completed a regional grid in 2025, but its share of overall spend continues to shrink. Regulators now expect higher-resolution submissions in licensing applications, accelerating the shift from 2D to 3D or sparse OBN designs. The combination of rising regulation, deepwater complexity, and CCS oversight reshapes the technology mix in favor of high-density arrays, securing long-term growth for the seismic services market.
Geography Analysis
North America held 36.7% of the seismic services market revenue in 2025, propelled by Gulf of Mexico deepwater developments and Canadian Atlantic prospects, despite a drop in U.S. shale permitting. The U.S. Inflation Reduction Act incentivized new CCS surveys along the Gulf Coast, while Canada's Clean Fuel Standard attracted seismic programs targeting saline aquifers in Alberta. NOAA's stricter acoustic criteria elevated compliance costs, yet the abundance of existing infrastructure and advanced processing hubs keeps the region attractive for integrated contractors. Cloud connectivity and data residency requirements have encouraged partnerships between seismic firms and hyperscale cloud providers, bolstering digital processing share within the seismic services market.
Asia-Pacific is projected to log a 9.9% CAGR to 2031, the fastest globally. CNOOC's Bohai Bay initiatives, ONGC's Krishna-Godavari campaigns, and Woodside's Scarborough gas project ensure continuous demand for long-offset imaging. Southeast Asian governments are reviving acreage offerings with gas-to-power ambitions, producing a pipeline of 2D reconnaissance and 3D appraisal work. Regulatory regimes remain less prescriptive than in Europe, but local content and environmental requirements are tightening, making joint ventures with domestic crews advantageous. A young fleet of Chinese-owned vessels increases regional competition yet broadens overall capacity, fostering competitive day rates that nevertheless sustain the expansion of the seismic services market.
Europe maintains a mature yet technologically advanced landscape: Norway and the UK drive 4D and OBN uptake for legacy fields and CCS clusters, while Denmark and Germany mobilize shallow-water seismic for offshore wind. EU noise directives and CO2 monitoring regulations extend the operational runway for high-end geophysics. South America benefits from Petrobras's sustained pre-salt investment and ExxonMobil's ongoing Guyana program, both reliant on high-density node surveys. Fiscal instability occasionally stalls licensing rounds, but multiyear commitments from IOCs and NOCs maintain baseline demand. The Middle East and Africa, powered by Saudi Aramco, ADNOC, and emerging Namibia discoveries, deliver large, multi-season acquisition campaigns. Government mandates for domestic processing capacity and data sovereignty encourage joint ventures, expanding the seismic services market through localized value chains.
- Schlumberger NV
- Halliburton Company
- CGG SA
- PGS ASA
- TGS ASA
- Shearwater GeoServices Holding AS
- China Oilfield Services Ltd (COSL)
- BGP Inc. CNPC
- SAExploration Holdings Inc.
- SeaBird Exploration PLC
- Fugro NV
- Magseis Fairfield ASA
- ION Geophysical Corp.
- PXGEO
- STRYDE Ltd.
- INOVA Geophysical
- Sercel (CGG Group)
- Fairfield Geotechnologies
- Geoex Ltd.
- WesternGeco (SLB)
Additional Benefits:
- The market estimate (ME) sheet in Excel format
- 3 months of analyst support
TABLE OF CONTENTS
1 Introduction
- 1.1 Study Assumptions & Market Definition
- 1.2 Scope of the Study
2 Research Methodology
3 Executive Summary
4 Market Landscape
- 4.1 Market Overview
- 4.2 Market Drivers
- 4.2.1 Rebound in offshore E&P spending
- 4.2.2 Deployment of 4D time-lapse seismic
- 4.2.3 NOC expansion into deep-water frontiers
- 4.2.4 Offshore-wind site assessment demand
- 4.2.5 Fiber-optic DAS for permanent monitoring
- 4.2.6 CCS project surveillance requirements
- 4.3 Market Restraints
- 4.3.1 Capex re-allocation to renewables
- 4.3.2 Strict marine-noise regulations
- 4.3.3 Shrinking multi-client funding pool
- 4.3.4 High debt load of vessel owners
- 4.4 Supply-Chain Analysis
- 4.5 Regulatory Landscape
- 4.6 Technological Outlook
- 4.7 Porter's Five Forces
- 4.7.1 Bargaining Power of Suppliers
- 4.7.2 Bargaining Power of Buyers
- 4.7.3 Threat of New Entrants
- 4.7.4 Threat of Substitutes
- 4.7.5 Intensity of Rivalry
5 Market Size & Growth Forecasts
- 5.1 By Service
- 5.1.1 Data Acquisition
- 5.1.2 Data Processing and Interpretation
- 5.2 By Seismic Technology
- 5.2.1 2D Seismic
- 5.2.2 3D Seismic
- 5.2.3 4D/Time-Lapse Seismic
- 5.2.4 Ocean-Bottom Node (OBN) Seismic
- 5.3 By Deployment Location
- 5.3.1 Onshore
- 5.3.2 Offshore
- 5.4 By Application
- 5.4.1 Oil and Gas
- 5.4.2 Offshore Energy and Marine
- 5.4.3 Carbon Capture, Utilization and Storage (CCUS)
- 5.4.4 Mining and Mineral Exploration
- 5.4.5 Geothermal Energy
- 5.4.6 Civil Engineering and Infrastructure
- 5.4.7 Others (Natural Hazard Assessment, Environmental Studies, and Academic & Research)
- 5.5 By Geography
- 5.5.1 North America
- 5.5.2 Europe
- 5.5.3 Asia-Pacific
- 5.5.4 South America
- 5.5.5 Middle East and Africa
6 Competitive Landscape
- 6.1 Market Concentration
- 6.2 Strategic Moves (M&A, Partnerships, PPAs)
- 6.3 Market Share Analysis (Market Rank/Share for key companies)
- 6.4 Company Profiles (includes Global level Overview, Market level overview, Core Segments, Financials as available, Strategic Information, Products & Services, and Recent Developments)
- 6.4.1 Schlumberger NV
- 6.4.2 Halliburton Company
- 6.4.3 CGG SA
- 6.4.4 PGS ASA
- 6.4.5 TGS ASA
- 6.4.6 Shearwater GeoServices Holding AS
- 6.4.7 China Oilfield Services Ltd (COSL)
- 6.4.8 BGP Inc. CNPC
- 6.4.9 SAExploration Holdings Inc.
- 6.4.10 SeaBird Exploration PLC
- 6.4.11 Fugro NV
- 6.4.12 Magseis Fairfield ASA
- 6.4.13 ION Geophysical Corp.
- 6.4.14 PXGEO
- 6.4.15 STRYDE Ltd.
- 6.4.16 INOVA Geophysical
- 6.4.17 Sercel (CGG Group)
- 6.4.18 Fairfield Geotechnologies
- 6.4.19 Geoex Ltd.
- 6.4.20 WesternGeco (SLB)
7 Market Opportunities & Future Outlook
- 7.1 White-space & Unmet-Need Assessment

 亞太地區海洋地震探勘服務:市場佔有率分析、產業趨勢與統計及成長預測(2026-2031 年)
 海上油氣地震測量設備及採集解決方案市場-全球產業規模、佔有率、趨勢、機會、預測:按類型、尺寸、服務類型、地區和競爭格局分類,2021-2031年
 2026年全球太空葬服務市場報告
 海底水下掩埋服務市場:按服務類型、掩埋方法、水深、計劃類型、設備類型和最終用戶分類,全球預測,2026-2032年
 地震觀測服務市場規模、佔有率、趨勢和預測:按類型、技術、部署地點、應用和地區分類,2026-2034 年地震服務市場-全球產業規模、佔有率、趨勢、機會及預測(依服務、技術、部署地點、應用、地區及競爭格局分類,2021-2031年)全球海洋地震探勘設備市場(按設備類型、探勘類型、技術和應用分類)預測(2026-2032年)沿海樁基服務市場(按樁型、服務類型、計劃規模和應用分類)-全球預測,2026-2032年海底打樁服務市場按設備類型、服務類型、安裝方法、應用和最終用戶分類,全球預測(2026-2032)海洋地震探勘設備市場:按設備類型、技術、模式、探勘類型、深度、應用和最終用戶分類的全球預測(2026-2032年)