


 |
市場調查報告書
商品編碼
2066590
自動化3D列印:市場佔有率分析、產業趨勢與統計、成長預測(2026-2031年)Automated 3D Printing - Market Share Analysis, Industry Trends & Statistics, Growth Forecasts (2026 - 2031) |
||||||

※ 本網頁內容可能與最新版本有所差異。詳細情況請與我們聯繫。
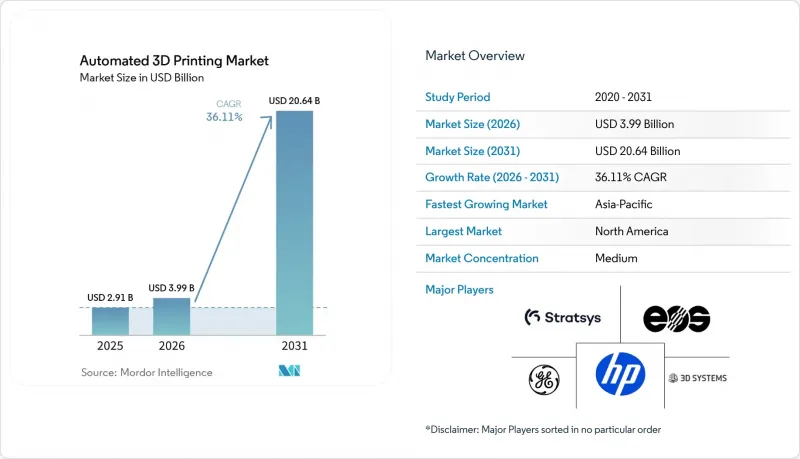
根據 Mordor Intelligence 預測,自動化 3D 列印市場規模將從 2025 年的 29.1 億美元成長到 2026 年的 39.9 億美元,然後在 2031 年達到 186.4 億美元,2026 年至 2031 年的複合年成長率為 36.1%。
本報告按產品(硬體、軟體、服務)、流程(自動化生產、物料輸送、零件搬運等)、終端用戶產業(工業製造、汽車、航太與國防、消費品等)、應用(原型製作、終端組件製造等)和地區進行細分。市場預測以美元計價。
全球自動化3D列印市場趨勢與洞察
軟體、感測器和人工智慧的融合將使「無人工廠」成為可能。
即時熱成像、聲學監測和逐層形狀檢測技術能夠及早發現缺陷,防止其惡化,從而在金屬粉末床系統中減少高達 60% 的廢品率。製造執行系統 (MES) 將設計文件與機器遙測資料和品質記錄整合,無需人工記錄即可產生符合 AS9100 和 ISO 13485 標準的稽核追蹤。配備力矩感測器的協作機器人可在 90 秒內更換建造平台,無需每班配備兩名操作員。美國領先的國防相關企業已強制要求採用基於 CMMC 2.0 的數位線程,從而加速整合軟體堆疊的普及。德國和日本在混合型機器的設計方面處於領先地位,這些機器將積層製造頭整合到多軸平台中,而 IEC 62443 則為中小企業提供了安全標準。
對大規模客製化的需求日益成長
消費品品牌正在利用射出成型無法實現的晶格結構,將產品週期從18個月縮短至6週。完全3D列印的鞋子無需組裝,使微型工廠能夠在幾天內響應當地市場趨勢。在醫療領域,人工智慧平台可在15分鐘內根據電腦斷層掃描產生針對患者最佳化的脊椎融合器,從而縮短手術計畫時間。化妝品製造商正在3D列印晶格結構的施用器,以減少30%的材料浪費,同時實現使用者友善的觸感。由於監管門檻較低,體育用品產業正在加速採用3D列印技術,而醫療設備產業雖然必須滿足ISO 10993和FDA 510(k)的要求,但仍可受惠於積層製造工作流程的柔軟性。
高初始資本投入
工業金屬印表機的價格在 50 萬美元到 500 萬美元之間,這對於無法獲得經濟實惠的租賃協議的中小型企業來說構成了一道障礙。根據安永會計師事務所 (EY) 2024 年的一項調查,62% 的製造商表示資金限制是採用該技術的最大障礙。服務機構正在減輕企業的資產負債表負擔,一家領先的服務商累計,透過按零件收費模式,其在 2024 年第三季額外獲得了 1.275 億美元的收入。提供即時報價的線上市場實現了 18.9% 的同比成長,表明市場對低資產密集型採購的需求日益成長。儘管美國小型企業管理局 (SBA) 和歐洲投資銀行 (EIB) 的貸款計劃降低了利率,但許多企業仍然不了解這些選擇。
細分市場分析
到2025年,硬體將佔自動化3D列印市場銷售額的53.11%,佔最大佔有率。這反映了對多雷射粉末床系統和混合型機器的投資。然而,目前市場對能夠將資本支出(Capex)轉化為營運支出(OpEx)並幫助客戶避免技術過時的服務機構的需求日益成長。領先的按需服務供應商在2024年第三季累計了1.275億美元的積層製造相關銷售額,凸顯了對短交貨期零件日益成長的需求。連接7000家認證供應商和買家的市場平台能夠在幾秒鐘內處理報價,從而縮短採購週期並擴大產能獲取管道。
在將軟體、耗材和預測性維護整合到多年合約中的訂閱套餐的支持下,預計到2031年,服務市場將以37.21%的複合年成長率超越硬體市場。模擬套件可自動產生支撐結構並確定建造方向,從而減少50%的生產前準備。機器供應商擴大整合遠端診斷和即時監控功能,以滿足ISO 9001和AS9100審核要求,同時最大限度地減少文書工作。因此,3D列印服務市場正在穩步擴張,使企業能夠在不給資產負債表造成過重負擔的情況下擴大零件生產規模。
儘管預計到2025年自動化生產將成為主流,市場佔有率將達到38.49%,但隨著混合單元整合積層製造、機械加工、熱處理和檢測等多種製造程序,多工序加工預計將保持強勁成長,年成長率達37.35%。例如,五軸雷射沉積平台可在一次裝夾中完成渦輪葉片的修復,幾乎消除了工序間的等待時間,並將航太領域的模具交付前置作業時間縮短高達60%。此外,緊湊型混合設備擴大將粉末床模組與12000轉/分的主軸結合,顯著提高了射出成型模具中隨形冷卻通道的加工效率。
隨著製造商力求實現一日交貨,機器人零件搬運系統應運而生,能夠自主取代300公斤重的平板,顯著提升營運效率。自動化除塵系統也成為關鍵創新,在高混合生產環境中可將人工操作時間減少高達70%。此外,Hermle的模組化托盤池現已可與混合(積層製造和機械加工)單元無縫整合,延長無人值守運作時間。因此,自動化3D列印市場正在發生變化,隨著工廠在不增加面積的情況下提高生產效率,多工序處理技術日益受到關注。
區域分析
到2025年,北美將佔自動化3D列印市場收入的34.83%。一項價值5億美元的聯邦津貼加速了航太領域的認證進程,將認證週期從三年縮短至18個月。波音和洛克希德馬丁公司已擴大其內部金屬粉末床3D列印機的部署規模,以確保2027年實現70%的國內採購率。加拿大已在蒙特婁投資5,000萬加元(約3,700萬美元)建設叢集,而墨西哥則在積極推進近岸外包,部署可在48小時內交付汽車模具的混合型生產單元。
預計到2031年,亞太地區的複合年成長率將達到36.78%。印度的國家戰略正在資助印度理工學院(IIT)建設鈦和鎳粉生產設施,而韓國的K-AM舉措則投資1.5億美元用於船舶製造的混合動力技術。儘管航太材料供不應求,但預計到2025年,中國原始設備製造商(OEM)仍將佔該地區硬體銷售額的40%。該地區各地的技術應用呈現出多元化的趨勢,例如,日本主要工具機製造商將定向能量沉積(DED)技術與多軸加工相結合,而澳洲國防部隊則部署了野戰印表機用於全部區域維修。
歐洲透過「地平線歐洲」計劃的津貼以及各國自身的專項計劃,繼續保持強大的影響力。德國弗勞恩霍夫研究所正與西門子、EOS和通快公司合作進行數位雙胞胎監測計畫;EOS已在德克薩斯州投資300萬美元,以服務美國客戶。法國的合資企業AddUp供應渦輪機零件,英國的Catapult中心正在加速醫療和能源領域的應用。在中東和非洲,重點是能源和國防零件的在地化生產;南美洲雖然仍處於發展階段,但隨著粉末供應鏈的成熟,汽車和石油產業正在蓬勃發展。
其他好處:
- Excel格式的市場預測(ME)表
- 3個月的分析師支持
目錄
第1章:引言
- 研究假設和市場定義
- 調查範圍
第2章:調查方法
第3章執行摘要
第4章 市場狀況
- 市場概覽
- 市場促進因素
- 增加研發投入
- 擴大機器人在工業自動化領域的應用
- 對大規模客製化的需求日益成長
- 透過軟體、感測器和人工智慧的整合,實現了無人工廠。
- 政府鼓勵本地生產和回流的激勵措施
- 企業對淨零排放的承諾正在推動輕量化零件的採用。
- 市場限制因素
- 高初始資本投入
- 有限認證材料目錄
- 專有平台之間的互通性問題
- 全自動化單元中的網路實體安全風險
- 產業供應鏈分析
- 宏觀經濟因素對市場的影響
- 監理情勢
- 技術展望
- 波特五力分析
第5章 市場規模與成長預測
- 透過提供
- 硬體
- 軟體
- 服務
- 透過流程
- 自動化生產
- 物料輸送
- 零件搬運
- 後處理
- 多處理
- 按最終用戶行業分類
- 工業製造
- 車
- 航太/國防
- 消費品
- 衛生保健
- 能源
- 其他終端用戶產業
- 透過使用
- 原型製作
- 最終用途部件的製造
- 巡迴
- 其他用途
- 按地區
- 北美洲
- 美國
- 加拿大
- 墨西哥
- 南美洲
- 巴西
- 阿根廷
- 其他南美國家
- 歐洲
- 德國
- 英國
- 法國
- 義大利
- 西班牙
- 俄羅斯
- 其他歐洲國家
- 亞太地區
- 中國
- 日本
- 印度
- 韓國
- 澳洲和紐西蘭
- 其他亞太國家
- 中東
- 沙烏地阿拉伯
- 阿拉伯聯合大公國
- 土耳其
- 其他中東國家
- 非洲
- 南非
- 奈及利亞
- 其他非洲國家
- 北美洲
第6章 競爭情勢
- 市場集中度
- 策略趨勢
- 市佔率分析
- 公司簡介
- Stratasys Ltd
- 3D Systems Corporation
- General Electric Company
- EOS GmbH
- HP Inc.
- Desktop Metal Inc.
- SLM Solutions Group AG
- The ExOne Company
- Materialise NV
- Universal Robots AS
- ABB Ltd
- Formlabs Inc.
- PostProcess Technologies Inc.
- Authentise Inc.
- Carbon Inc.
- Renishaw plc
- Siemens AG
- Coobx AG
- DWS Systems
- Additive Industries BV
第7章 市場機會與未來展望
According to Mordor Intelligence, the automated 3D printing market size is expected to grow from USD 2.91 billion in 2025 to USD 3.99 billion in 2026 and is forecast to reach USD 18.64 billion by 2031 at a 36.11% CAGR over 2026-2031.
This report is Segmented by Offering (Hardware, Software, and Services), Process (Automated Production, Material Handling, Part Handling, and More), End-User Vertical (Industrial Manufacturing, Automotive, Aerospace and Defense, Consumer Products, and More), Application (Prototyping, Manufacturing of End-Use Parts, and More), and Geography. The Market Forecasts are Provided in Terms of Value (USD).
Global Automated 3D Printing Market Trends and Insights
Software, Sensor and AI Convergence Enabling Lights-Out Factories
Real-time thermal imaging, acoustic monitoring, and layer-wise geometry checks now flag defects before they propagate, cutting scrap in metal powder-bed systems by up to 60%. Manufacturing execution systems link design files with machine telemetry and quality records, generating audit trails that satisfy AS9100 and ISO 13485 without manual logbooks. Collaborative robots equipped with force-torque sensors swap build plates in under 90 seconds, eliminating the need for two operators per shift. Large U.S. defense contractors already mandate digital-thread compliance under CMMC 2.0, accelerating the adoption of integrated software stacks.Germany and Japan lead hybrid machine design that embeds additive heads into multi-axis platforms, while IEC 62443 provides a security baseline for small and medium enterprises.
Rising Demand for Mass Customization at Scale
Consumer brands exploit lattice geometries that injection molding cannot match, compressing product cycles from 18 months to six weeks. Fully 3D-printed footwear eliminates assembly labor, letting micro-factories respond to regional trends within days. In healthcare, AI platforms generate patient-specific spinal cages from CT scans in 15 minutes, thereby shortening surgical planning time. Cosmetic firms print lattice applicators that reduce material waste by 30% while delivering a tailored tactile feel. Fewer regulatory hurdles in sporting goods speed adoption, whereas medical devices navigate ISO 10993 and FDA 510(k), but still benefit from the flexibility of additive workflows.
High Initial Capital Expenditure
Industrial metal printers cost USD 0.5-5 million, a hurdle for small enterprises that lack affordable leases. EY's 2024 survey found that 62% of manufacturers cited capital constraints as the top barrier to adoption. Service bureaus alleviate balance-sheet pressure; one leading provider booked USD 127.5 million in additional revenue in Q3 2024 on a pay-per-part model. Online marketplaces offering instant quotes posted 18.9% year-over-year sales growth, signaling demand for asset-light procurement. Lending programs from the U.S. Small Business Administration and the European Investment Bank reduce interest rates, yet many firms remain unaware of these options.
Other drivers and restraints analyzed in the detailed report include:
- Growth in Adoption of Robotics for Industrial Automation
- Corporate Net-Zero Commitments Driving Lightweight Parts
- Limited Qualified Materials Catalogue
For complete list of drivers and restraints, kindly check the Table Of Contents.
Segment Analysis
Hardware captured the largest slice of the Automated 3D Printing market revenue at 53.11% in 2025, reflecting investment in multi-laser powder-bed systems and hybrid machines. However, demand now tilts toward service bureaus that convert capex into opex, letting clients avoid technology obsolescence. A leading on-demand provider posted USD 127.5 million in additive sales in Q3 2024, highlighting growing demand for quick-turn parts. Marketplaces that match 7,000 qualified suppliers with buyers process quotes in seconds, shrinking procurement cycles and widening access to capacity.
Services are projected to outpace hardware at a 37.21% CAGR to 2031, underpinned by subscription bundles that wrap software, consumables, and predictive maintenance into multiyear contracts. Simulation suites automate support generation and build orientation, cutting pre-production labor by 50%. Machine vendors increasingly embed remote diagnostics and real-time monitoring, satisfying ISO 9001 and AS9100 audits with minimal paperwork. The Automated 3D Printing market size for services, therefore, expands steadily as firms scale part volumes without heavy balance-sheet exposure.
Automated production dominated in 2025 with a 38.49% share, yet multiprocessing is projected to expand at a robust 37.35% annually as hybrid cells integrate multiple manufacturing processes, including additive, subtractive, heat treatment, and inspection tasks. For instance, a five-axis laser deposition platform is now capable of repairing turbine blades in a single setup, effectively eliminating inter-operation queues and reducing aerospace tooling lead times by up to 60%. Additionally, compact hybrid machines are increasingly combining powder-bed modules with 12,000-rpm spindles, enabling the machining of conformal cooling channels in injection molds with greater efficiency.
As manufacturers strive to achieve one-day tool delivery, robotic part-handling systems are being deployed to autonomously swap 300-kilogram plates, significantly enhancing operational efficiency. Automated depowdering systems have also emerged as a critical innovation, cutting manual touch time by up to 70% in high-mix production environments. Furthermore, Hermle's modular pallet pools now seamlessly interface with hybrid additive-subtractive cells, thereby increasing unmanned operational hours. Consequently, the Automated 3D Printing market is witnessing a shift, with multiprocessing gaining traction as factories aim to boost throughput without expanding their physical footprint.
Complete Report Scope:
- By Offering
- Hardware
- Software
- Services
- By Process
- Automated Production
- Material Handling
- Part Handling
- Post-Processing
- Multiprocessing
- By End-user Vertical
- Industrial Manufacturing
- Automotive
- Aerospace and Defense
- Consumer Products
- Healthcare
- Energy
- Rest of End-user Verticals
- By Application
- Prototyping
- Manufacturing of End-use Parts
- Tooling
- Rest of Applications
- By Geography
- North America
- United States
- Canada
- Mexico
- South America
- Brazil
- Argentina
- Rest of South America
- Europe
- Germany
- United Kingdom
- France
- Italy
- Spain
- Russia
- Rest of Europe
- Asia-Pacific
- China
- Japan
- India
- South Korea
- Australia and New Zealand
- Rest of Asia-Pacific
- Middle East
- Saudi Arabia
- United Arab Emirates
- Turkey
- Rest of Middle East
- Africa
- South Africa
- Nigeria
- Rest of Africa
- North America
Geography Analysis
North America accounted for 34.83% of the Automated 3D Printing market revenue in 2025. Federal grants worth USD 500 million accelerate aerospace qualification, compressing certification cycles from three years to 18 months. Boeing and Lockheed Martin expanded in-house metal powder-bed fleets to ensure 70% domestic sourcing by 2027. Canada invested CAD 50 million (USD 37 million) in a Montreal cluster, while Mexico's nearshoring push installs hybrid cells that deliver automotive tooling within 48 hours.
Asia-Pacific is forecast to grow at 36.78% CAGR through 2031. India's National Strategy funds titanium and nickel powder hubs at IITs, South Korea's K-AM Initiative directs USD 150 million to shipbuilding hybrids, and Chinese OEMs captured 40% of regional hardware sales in 2025 despite aerospace material bottlenecks. Japan's machine-tool giants integrate directed energy deposition with multi-axis machining, and Australian defense units deploy field printers for on-site repairs, illustrating diverse adoption drivers across the region.
Europe maintains a strong footprint through Horizon Europe grants and national programs. German Fraunhofer institutes collaborate with Siemens, EOS, and Trumpf on digital-twin monitoring, while EOS invested USD 3 million in Texas to serve U.S. clients. French joint venture AddUp supplies turbine components, and the United Kingdom's Catapult centers accelerate medical and energy applications. The Middle East and Africa focus on energy and defense spare-parts localization, and South America remains nascent but grows in automotive and oil sectors as powder supply chains mature.
- Stratasys Ltd
- 3D Systems Corporation
- General Electric Company
- EOS GmbH
- HP Inc.
- Desktop Metal Inc.
- SLM Solutions Group AG
- The ExOne Company
- Materialise NV
- Universal Robots AS
- ABB Ltd
- Formlabs Inc.
- PostProcess Technologies Inc.
- Authentise Inc.
- Carbon Inc.
- Renishaw plc
- Siemens AG
- Coobx AG
- DWS Systems
- Additive Industries BV
Additional Benefits:
- The market estimate (ME) sheet in Excel format
- 3 months of analyst support
TABLE OF CONTENTS
1 INTRODUCTION
- 1.1 Study Assumptions and Market Definition
- 1.2 Scope of the Study
2 RESEARCH METHODOLOGY
3 EXECUTIVE SUMMARY
4 MARKET LANDSCAPE
- 4.1 Market Overview
- 4.2 Market Drivers
- 4.2.1 Increasing Investments in R&D
- 4.2.2 Growth in Adoption of Robotics for Industrial Automation
- 4.2.3 Rising Demand for Mass Customisation at Scale
- 4.2.4 Software, Sensor and AI Convergence Enabling Lights-Out Factories
- 4.2.5 Government Incentives for Localised Manufacturing and Reshoring
- 4.2.6 Corporate Net-Zero Commitments Driving Lightweight Parts
- 4.3 Market Restraints
- 4.3.1 High Initial Capital Expenditure
- 4.3.2 Limited Qualified Materials Catalogue
- 4.3.3 Inter-operability Issues Across Proprietary Platforms
- 4.3.4 Cyber-Physical Security Risks in Fully Automated Cells
- 4.4 Industry Supply-Chain Analysis
- 4.5 Impact of Macroeconomic Factors on the Market
- 4.6 Regulatory Landscape
- 4.7 Technological Outlook
- 4.8 Porter's Five Forces Analysis
- 4.8.1 Threat of New Entrants
- 4.8.2 Bargaining Power of Buyers
- 4.8.3 Bargaining Power of Suppliers
- 4.8.4 Threat of Substitute Products
- 4.8.5 Intensity of Competitive Rivalry
5 MARKET SIZE AND GROWTH FORECASTS (VALUE)
- 5.1 By Offering
- 5.1.1 Hardware
- 5.1.2 Software
- 5.1.3 Services
- 5.2 By Process
- 5.2.1 Automated Production
- 5.2.2 Material Handling
- 5.2.3 Part Handling
- 5.2.4 Post-Processing
- 5.2.5 Multiprocessing
- 5.3 By End-user Vertical
- 5.3.1 Industrial Manufacturing
- 5.3.2 Automotive
- 5.3.3 Aerospace and Defense
- 5.3.4 Consumer Products
- 5.3.5 Healthcare
- 5.3.6 Energy
- 5.3.7 Rest of End-user Verticals
- 5.4 By Application
- 5.4.1 Prototyping
- 5.4.2 Manufacturing of End-use Parts
- 5.4.3 Tooling
- 5.4.4 Rest of Applications
- 5.5 By Geography
- 5.5.1 North America
- 5.5.1.1 United States
- 5.5.1.2 Canada
- 5.5.1.3 Mexico
- 5.5.2 South America
- 5.5.2.1 Brazil
- 5.5.2.2 Argentina
- 5.5.2.3 Rest of South America
- 5.5.3 Europe
- 5.5.3.1 Germany
- 5.5.3.2 United Kingdom
- 5.5.3.3 France
- 5.5.3.4 Italy
- 5.5.3.5 Spain
- 5.5.3.6 Russia
- 5.5.3.7 Rest of Europe
- 5.5.4 Asia-Pacific
- 5.5.4.1 China
- 5.5.4.2 Japan
- 5.5.4.3 India
- 5.5.4.4 South Korea
- 5.5.4.5 Australia and New Zealand
- 5.5.4.6 Rest of Asia-Pacific
- 5.5.5 Middle East
- 5.5.5.1 Saudi Arabia
- 5.5.5.2 United Arab Emirates
- 5.5.5.3 Turkey
- 5.5.5.4 Rest of Middle East
- 5.5.6 Africa
- 5.5.6.1 South Africa
- 5.5.6.2 Nigeria
- 5.5.6.3 Rest of Africa
- 5.5.1 North America
6 COMPETITIVE LANDSCAPE
- 6.1 Market Concentration
- 6.2 Strategic Moves
- 6.3 Market Share Analysis
- 6.4 Company Profiles (includes Global Level Overview, Market Level Overview, Core Segments, Financials as available, Strategic Information, Market Rank/Share, Products and Services, Recent Developments)
- 6.4.1 Stratasys Ltd
- 6.4.2 3D Systems Corporation
- 6.4.3 General Electric Company
- 6.4.4 EOS GmbH
- 6.4.5 HP Inc.
- 6.4.6 Desktop Metal Inc.
- 6.4.7 SLM Solutions Group AG
- 6.4.8 The ExOne Company
- 6.4.9 Materialise NV
- 6.4.10 Universal Robots AS
- 6.4.11 ABB Ltd
- 6.4.12 Formlabs Inc.
- 6.4.13 PostProcess Technologies Inc.
- 6.4.14 Authentise Inc.
- 6.4.15 Carbon Inc.
- 6.4.16 Renishaw plc
- 6.4.17 Siemens AG
- 6.4.18 Coobx AG
- 6.4.19 DWS Systems
- 6.4.20 Additive Industries BV
7 MARKET OPPORTUNITIES AND FUTURE OUTLOOK
- 7.1 White-Space and Unmet-need Assessment


