


 |
市場調查報告書
商品編碼
2066574
農業生物製藥:市場佔有率分析、產業趨勢與統計、成長預測(2026-2031)Agricultural Biologicals - Market Share Analysis, Industry Trends & Statistics, Growth Forecasts (2026 - 2031) |
||||||

※ 本網頁內容可能與最新版本有所差異。詳細情況請與我們聯繫。
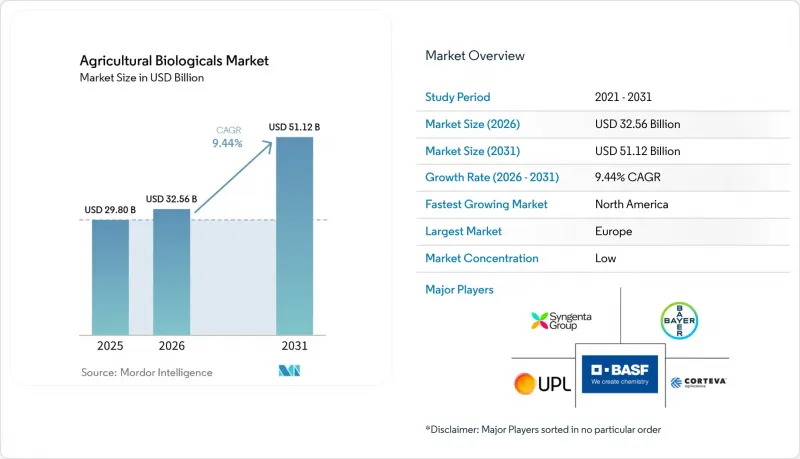
根據 Mordor Intelligence 預測,農業生物製藥市場將從 2025 年的 298 億美元成長到 2026 年的 325.6 億美元,到 2031 年將成長到 511.2 億美元,2026 年至 2031 年的複合年成長率為 9.44%。
本報告按功能(作物營養和作物保護)、作物類型(大田作物、園藝作物、經濟作物)和地區(北美、南美、歐洲、亞太地區以及中東和非洲)進行細分。市場預測以價值(美元)和數量(公噸)表示。
全球農業生物製藥市場趨勢與洞察
有機和無殘留農產品的需求日益成長
隨著有機農業和無殘留農業系統在主要產區的日益普及,農業生物製藥的市場正在成長。根據一項題為《印度有機農業發展》的研究,預計2024年,印度的有機農業面積將達到約730萬公頃。與20年前的50萬公頃相比,這是一個顯著的成長。預計到2024年,印度將擁有超過230萬有機農戶,凸顯了永續農業實踐的快速發展。這種成長推動了對生物來源作物保護和土壤改良產品的需求,這些產品有助於推廣無殘留農業。此外,零售商和加工商的採購要求正在擴大無殘留農產品的供應管道,使其不再局限於有機認證的分銷通路,而生物來源材料也被應用於傳統農業實踐中,進一步擴大了市場需求。
加強合成農藥殘留和成分的監管
農業生物製藥市場正受益於更嚴格的傳統殺蟲劑使用法令遵循和簡化的生技藥品核准流程。在歐洲,歐盟委員會於2025年12月宣布,對生物防治產品進行臨時國家授權,每年可減少開發商因市場准入延遲而造成的2,200萬歐元(2,350萬美元)損失。此舉提高了農業生物製藥市場產品上市的經濟可行性。隨著監管流程效率的提高,預計市場內的投資決策將越來越傾向於那些能夠更快商業化且監管門檻更低的生技藥品項目。
保存期限短和依賴低溫運輸是許多配方產品的常見特徵。
由於許多微生物和生物製劑在不當的儲存和運輸條件下會失去效力,農業生物製藥市場面臨嚴峻的分銷挑戰。發表在《作物健康雜誌》(Journal of Crop Health)2025年的一項研究表明,蚜繭蜂(Aphidius colemani)的孵化率在受控條件下為84.4%,但在冷藏96小時後降至34.8%。同樣,小花蝽(Orius laevigatus)的數量在168小時後也從83.97%迅速下降至22.12%,顯示其存活率快速降低。這個問題在南亞、東南亞和撒哈拉以南非洲等地區尤其嚴重。儘管這些地區具有很高的農業生物製藥市場滲透潛力,但末端低溫運輸基礎設施的不足阻礙了其推廣應用。
細分市場分析
到2025年,作物營養領域將佔據農業生物製藥市場最大的佔有率,達到64.0%。這主要得益於生物肥料、生物促效劑和有機營養管理方案在商業農業系統中的廣泛應用。農民擴大將生物營養素融入傳統的耕作方式中,因為它們無需對耕作方式進行重大調整,即可提高養分吸收效率、土壤微生物活性和非生物脅迫耐受性。作物輪作和園藝生產領域的需求尤其強勁,因為永續的耕作方式和殘茬管理是影響購買決策的關鍵因素。此外,這些產品與現有肥料方案的兼容性也促進了它們在大規模農業生產中的廣泛應用。
預計2026年至2031年間,作物保護領域農業生物製藥的市場規模將以9.5%的最高複合年成長率成長。這主要得益於在需要進行抗藥性管理和考慮殘留因素的作物系統中,生物解決方案的使用日益增多。隨著監管力度的加強以及種植者尋求合成化學品的替代方案,生物殺菌劑、生物殺蟲劑和生物殺線蟲劑正擴大被納入綜合蟲害管理方案中。此外,作物營養和作物保護功能之間的重疊也日益增加,因為一些生物來源產品既能支持植物的防禦反應,也能幫助應對逆境。這種融合正在影響整個農業生物製藥產業的研發策略、產品組合定位和商業性夥伴關係。
區域分析
2025年,歐洲在全球銷售額中佔最大佔有率,達34%。這主要得益於所有農業系統中生技藥品應用的持續加速,而這又受到更嚴格的永續性政策、殘留標準以及對傳統農作物保護產品監管壓力的推動。此外,永續農業目標與食品供應鏈需求的契合也進一步支持了區域需求。 2025年11月,歐洲議會通過一項決議,旨在加速生物防治劑的註冊和推廣,包括簡化核准程序和加強生技藥品的互認框架。這項政策方向正在為生技藥品在歐洲農業領域的商業化創造更多機會。
預計2026年至2031年間,北美將實現11.8%的最高複合年成長率,這主要得益於生技藥品註冊數量的增加、向有機農業舉措以及生技藥品與傳統作物種植方案的整合。美國仍然是該地區最大的貢獻者,農民採用生物來源進行抗性管理、改善土壤健康和減少農藥殘留。此外,尋求與綜合蟲害管理(IPM)系統相容的特種作物和農作物種植者也對生物製劑產生了日益成長的商業性需求。私營部門對發酵基礎設施、製劑技術和大規模生物來源製劑生產的大力投資,進一步加劇了區域市場競爭,並提高了產品供應。
在南美洲,尤其是在巴西和阿根廷,生物來源投入品在大規模農業生產系統中的應用正在不斷擴大並鞏固其地位。巴西仍然是該地區的成長中心,生物來源材料擴大被整合到大豆、玉米、甘蔗和園藝作物種植計畫中。預計到2025年,巴西將批准162種生物來源產品,這將是該國歷史上最高的年度核准數量,凸顯了生物來源解決方案在農業領域的快速商業化進程。接種劑和生物來源農作物保護產品的日益普及,進一步加速了它們在擁有廣袤農田的整個農業系統中的應用。
其他好處:
- Excel格式的市場預測(ME)表
- 3個月的分析師支持
目錄
第1章:引言
- 研究假設和市場定義
- 調查範圍
第2章:調查方法
第3章執行摘要
第4章 市場狀況與主要產業趨勢
- 有機耕作面積
- 人均有機產品支出
- 法律規範
- 阿根廷
- 澳洲
- 巴西
- 加拿大
- 中國
- 埃及
- 法國
- 德國
- 印度
- 印尼
- 義大利
- 日本
- 墨西哥
- 荷蘭
- 奈及利亞
- 菲律賓
- 俄羅斯
- 南非
- 西班牙
- 泰國
- 土耳其
- 英國
- 美國
- 越南
- 價值鏈分析與通路分析
- 市場促進因素
- 有機和無農藥農產品的需求日益成長
- 加強合成農藥殘留和成分的監管
- 擴大生技藥品在綜合蟲害管理的應用
- 獎勵發展再生農業和碳抵消計劃
- 人工智慧(AI)用於發現微生物菌株和最佳化配方。
- 以本地發酵和農場生物投入材料生產為重點的模式。
- 市場限制因素
- 許多配方保存期限短,且依賴低溫運輸運輸。
- 報名手續複雜且不一致
- 假冒仿冒品產品的氾濫
- 海藻和其他生物來源供應的波動
- 技術展望
- 波特五力模型
第5章 市場規模與成長預測
- 按功能
- 作物營養
- 生物肥料
- 固氮螺菌
- 固氮菌
- 菌根
- 磷酸鹽可溶性細菌
- 根瘤菌
- 其他生物肥料
- 生物促效劑
- 胺基酸
- 富裡酸
- 腐植酸
- 蛋白質水解物
- 海藻萃取物
- 其他生物促效劑
- 有機肥料
- 牲畜糞便
- 酒糟基肥料
- 油籽粕
- 其他有機肥料
- 生物肥料
- 作物保護
- 生物防治劑
- 宏觀生物學
- 微生物製劑
- 生物農藥
- 生物殺菌劑
- 生物除草劑
- 生物殺蟲劑
- 其他生物農藥
- 生物防治劑
- 作物營養
- 按作物類型
- 系列
- 園藝作物
- 經濟作物
- 按地區
- 北美洲
- 美國
- 加拿大
- 墨西哥
- 其他北美國家
- 南美洲
- 巴西
- 阿根廷
- 其他南美國家
- 歐洲
- 德國
- 英國
- 法國
- 西班牙
- 義大利
- 荷蘭
- 俄羅斯
- 土耳其
- 其他歐洲國家
- 亞太地區
- 中國
- 印度
- 日本
- 澳洲
- 越南
- 泰國
- 印尼
- 菲律賓
- 其他亞太國家
- 中東
- 伊朗
- 沙烏地阿拉伯
- 其他中東國家
- 非洲
- 南非
- 奈及利亞
- 埃及
- 其他非洲國家
- 北美洲
第6章 競爭情勢
- 市場集中度
- 策略趨勢
- 市佔率分析
- 公司簡介
- Corteva Agriscience
- BASF SE
- Bayer AG
- Syngenta Group
- UPL Limited
- Novonesis A/S
- Koppert Biological Systems BV
- Valent BioSciences LLC
- FMC Corporation
- Rovensa SA
- Certis USA LLC
- Andermatt Biocontrol AG
- Yara International ASA
- Futureco Bioscience SA
- Verdesian Life Sciences LLC
第7章 市場機會與未來展望
According to Mordor Intelligence, the agricultural biologicals market size is projected to grow from USD 29.80 billion in 2025 to USD 32.56 billion in 2026 and USD 51.12 billion by 2031, registering a CAGR of 9.44% from 2026 to 2031.
This report is Segmented by Function (Crop Nutrition and Crop Protection), by Crop Type (Row Crops, Horticultural Crops, and Cash Crops), and by Geography (North America, South America, Europe, Asia-Pacific, Middle East, and Africa). The Market Forecasts are Provided in Value (USD) and Volume (Metric Tons).
Global Agricultural Biologicals Market Trends and Insights
Rising Demand for Organic and Residue-Free Produce
The agricultural biologicals market is growing due to the rising adoption of organic and residue-sensitive farming systems in major production regions. According to the study published in "Growth of Organic Farming in India," the area under organic cultivation in India reached approximately 7.3 million hectares in 2024, compared to 0.5 million hectares two decades ago, and the country had over 2.3 million organic farmers in 2024, highlighting the rapid expansion of sustainable agricultural practices. This growth is driving demand for biological crop protection and soil enhancement products that facilitate residue-free farming. Furthermore, retailer and processor purchasing requirements are extending residue-free sourcing beyond certified organic channels, incorporating biological inputs into conventional farming practices, and broadening market demand.
Stricter Regulations on Synthetic Agrochemical Residues and Ingredients
The agricultural biologicals market is benefiting from stricter compliance regulations on conventional insecticide usage and streamlined approval processes for biological products. In Europe, the European Commission announced in December 2025 that provisional national authorizations for biocontrol products could save developers EUR 22 million (USD 23.5 million) annually in delayed marketing losses . This development enhances the economic feasibility of product launches in the agricultural biologicals market. As these regulatory processes become more efficient, investment decisions within the market are projected to increasingly favor biological pipelines that can be commercialized more rapidly and with reduced regulatory hurdles.
Short Shelf Life and Cold-Chain Dependence of Many Formulations
The agricultural biologicals market faces a notable distribution challenge, as many microbial and living-agent formulations lose effectiveness under suboptimal storage and transportation conditions. Research published in the 2025 Journal of Crop Health indicated that the emergence rates for Aphidius colemani dropped from 84.4% under controlled conditions to 34.8% after 96 hours of refrigeration. Similarly, Orius laevigatus populations declined from 83.97% to 22.12% after 168 hours, demonstrating a rapid loss of viability . This issue is particularly significant in regions such as South Asia, Southeast Asia, and Sub-Saharan Africa, where the agricultural biologicals market has strong adoption potential but is hindered by inadequate cold-chain infrastructure at the last mile.
Other drivers and restraints analyzed in the detailed report include:
- Growing Use of Biologicals in Integrated Pest Management
- Regenerative Agriculture Incentives and Carbon Insetting Programs
- Complex and Non-Harmonized Registration Pathways
For complete list of drivers and restraints, kindly check the Table Of Contents.
Segment Analysis
The agricultural biologicals market share for the crop nutrition segment held the largest 64.0% in 2025, supported by the rising adoption of biofertilizers, biostimulants, and organic nutrient management programs across commercial farming systems. Farmers are increasingly integrating biological nutrition inputs into conventional agronomy practices due to their ability to enhance nutrient uptake efficiency, soil microbial activity, and abiotic stress tolerance without requiring significant operational changes. Demand is particularly robust in row crops and horticultural production, where sustainable farming practices and residue management are key factors influencing purchasing decisions. Additionally, the compatibility of these products with existing fertilizer programs supports their broader acceptance in large-scale farming operations.
The agricultural biologicals market size for the crop protection segment recorded the fastest projected CAGR at 9.5% from 2026 to 2031. driven by expanding use of biological solutions in resistance management and residue-sensitive crop systems. Biological fungicides, bioinsecticides, and bionematicides are increasingly incorporated into integrated pest management programs as growers seek alternatives to synthetic chemistries facing tighter regulatory scrutiny. The overlap between crop nutrition and crop protection functions is also increasing, because several biological products support both plant defense responses and stress management. This convergence is influencing product development strategies, portfolio positioning, and commercial partnerships throughout the agricultural biologicals industry.
Geography Analysis
Europe accounted for the largest 34% share of global revenue in 2025 because stricter sustainability policies, residue standards, and regulatory pressure on conventional crop protection products continue encouraging biological adoption across farming systems. Regional demand is further supported by the alignment between sustainable agriculture objectives and food supply chain requirements. In November 2025, the European Parliament adopted a resolution to accelerate the registration and uptake of biological control agents, including streamlined authorization procedures and enhanced mutual recognition frameworks for biological products. This policy direction is bolstering commercialization opportunities for biological inputs across European agriculture.
North America is projected to achieve the fastest CAGR of 11.8% from 2026 to 2031, supported by expanding biological registrations, organic transition initiatives, and increasing integration of biological products into conventional crop programs. The United States remains the largest contributor in the region, as growers adopt biological inputs for resistance management, soil health improvement, and residue reduction strategies. Commercial demand is also increasing among specialty crop and row crop producers seeking compatibility with integrated pest management systems. Strong private-sector investments in fermentation infrastructure, formulation technologies, and large-scale biological manufacturing are further enhancing regional market competitiveness and product availability.
South America continues to solidify its position through the growing adoption of biological inputs in large-scale agricultural production systems, particularly in Brazil and Argentina. Brazil remains the regional growth hub, with biological inputs increasingly integrated into soybean, corn, sugarcane, and horticultural cultivation programs. In 2025, Brazil approved 162 bio-input products, marking the highest annual level recorded in the country and reinforcing the rapid commercialization of biological solutions in agriculture. The wider use of inoculants and biological crop protection products is further driving adoption across large-acre farming systems.
- Corteva Agriscience
- BASF SE
- Bayer AG
- Syngenta Group
- UPL Limited
- Novonesis A/S
- Koppert Biological Systems B.V.
- Valent BioSciences LLC
- FMC Corporation
- Rovensa S.A.
- Certis USA LLC
- Andermatt Biocontrol AG
- Yara International ASA
- Futureco Bioscience S.A.
- Verdesian Life Sciences LLC
Additional Benefits:
- The market estimate (ME) sheet in Excel format
- 3 months of analyst support
TABLE OF CONTENTS
1 INTRODUCTION
- 1.1 Study Assumptions and Market Definition
- 1.2 Scope of the Study
2 RESEARCH METHODOLOGY
3 EXECUTIVE SUMMARY
4 MARKET LANDSCAPE AND KEY INDUSTRY TRENDS
- 4.1 Area Under Organic Cultivation
- 4.2 Per Capita Spending On Organic Products
- 4.3 Regulatory Framework
- 4.3.1 Argentina
- 4.3.2 Australia
- 4.3.3 Brazil
- 4.3.4 Canada
- 4.3.5 China
- 4.3.6 Egypt
- 4.3.7 France
- 4.3.8 Germany
- 4.3.9 India
- 4.3.10 Indonesia
- 4.3.11 Italy
- 4.3.12 Japan
- 4.3.13 Mexico
- 4.3.14 Netherlands
- 4.3.15 Nigeria
- 4.3.16 Philippines
- 4.3.17 Russia
- 4.3.18 South Africa
- 4.3.19 Spain
- 4.3.20 Thailand
- 4.3.21 Turkey
- 4.3.22 United Kingdom
- 4.3.23 United States
- 4.3.24 Vietnam
- 4.4 Value Chain Analysis and Distribution Channel Analysis
- 4.5 Market Drivers
- 4.5.1 Rising demand for organic and residue-free produce
- 4.5.2 Stricter regulations on synthetic agrochemical residues and ingredients
- 4.5.3 Growing use of biologicals in integrated pest management
- 4.5.4 Regenerative agriculture incentives and carbon insetting programs
- 4.5.5 Artificial intelligence (AI)-enabled microbial strain discovery and formulation optimization
- 4.5.6 Localized fermentation and on-farm bio-input manufacturing models
- 4.6 Market Restraints
- 4.6.1 Short shelf life and cold-chain dependence of many formulations
- 4.6.2 Complex and non-harmonized registration pathways
- 4.6.3 Proliferation of counterfeit and sub-standard products
- 4.6.4 Volatile seaweed and other biological feedstock supply
- 4.7 Technological Outlook
- 4.8 Porter's Five Forces
- 4.8.1 Threat of New Entrants
- 4.8.2 Bargaining Power of Suppliers
- 4.8.3 Bargaining Power of Buyers
- 4.8.4 Threat of Substitutes
- 4.8.5 Intensity of Competitive Rivalry
5 MARKET SIZE AND GROWTH FORECASTS (VALUE AND VOLUME)
- 5.1 By Function
- 5.1.1 Crop Nutrition
- 5.1.1.1 Biofertilizers
- 5.1.1.1.1 Azospirillum
- 5.1.1.1.2 Azotobacter
- 5.1.1.1.3 Mycorrhiza
- 5.1.1.1.4 Phosphate Solubilizing Bacteria
- 5.1.1.1.5 Rhizobium
- 5.1.1.1.6 Other Biofertilizers
- 5.1.1.2 Biostimulants
- 5.1.1.2.1 Amino Acids
- 5.1.1.2.2 Fulvic Acid
- 5.1.1.2.3 Humic Acid
- 5.1.1.2.4 Protein Hydrolysates
- 5.1.1.2.5 Seaweed Extracts
- 5.1.1.2.6 Other Biostimulants
- 5.1.1.3 Organic Fertilizer
- 5.1.1.3.1 Manure
- 5.1.1.3.2 Meal Based Fertilizers
- 5.1.1.3.3 Oilcakes
- 5.1.1.3.4 Other Organic Fertilizers
- 5.1.1.1 Biofertilizers
- 5.1.2 Crop Protection
- 5.1.2.1 Biocontrol Agents
- 5.1.2.1.1 Macrobials
- 5.1.2.1.2 Microbials
- 5.1.2.2 Biopesticides
- 5.1.2.2.1 Biofungicides
- 5.1.2.2.2 Bioherbicides
- 5.1.2.2.3 Bioinsecticides
- 5.1.2.2.4 Other Biopesticides
- 5.1.2.1 Biocontrol Agents
- 5.1.1 Crop Nutrition
- 5.2 By Crop Type
- 5.2.1 Row Crops
- 5.2.2 Horticultural Crops
- 5.2.3 Cash Crops
- 5.3 By Geography
- 5.3.1 North America
- 5.3.1.1 United States
- 5.3.1.2 Canada
- 5.3.1.3 Mexico
- 5.3.1.4 Rest of North America
- 5.3.2 South America
- 5.3.2.1 Brazil
- 5.3.2.2 Argentina
- 5.3.2.3 Rest of South America
- 5.3.3 Europe
- 5.3.3.1 Germany
- 5.3.3.2 United Kingdom
- 5.3.3.3 France
- 5.3.3.4 Spain
- 5.3.3.5 Italy
- 5.3.3.6 Netherlands
- 5.3.3.7 Russia
- 5.3.3.8 Turkey
- 5.3.3.9 Rest of Europe
- 5.3.4 Asia-Pacific
- 5.3.4.1 China
- 5.3.4.2 India
- 5.3.4.3 Japan
- 5.3.4.4 Australia
- 5.3.4.5 Vietnam
- 5.3.4.6 Thailand
- 5.3.4.7 Indonesia
- 5.3.4.8 Philippines
- 5.3.4.9 Rest of Asia-Pacific
- 5.3.5 Middle East
- 5.3.5.1 Iran
- 5.3.5.2 Saudi Arabia
- 5.3.5.3 Rest of Middle East
- 5.3.6 Africa
- 5.3.6.1 South Africa
- 5.3.6.2 Nigeria
- 5.3.6.3 Egypt
- 5.3.6.4 Rest of Africa
- 5.3.1 North America
6 COMPETITIVE LANDSCAPE
- 6.1 Market Concentration
- 6.2 Strategic Moves
- 6.3 Market Share Analysis
- 6.4 Company Profiles (Includes Global Level Overview, Market Level Overview, Core Segments, Financials as Available, Strategic Information, Market Rank/Share for Key Companies, Products and Services, and Recent Developments)
- 6.4.1 Corteva Agriscience
- 6.4.2 BASF SE
- 6.4.3 Bayer AG
- 6.4.4 Syngenta Group
- 6.4.5 UPL Limited
- 6.4.6 Novonesis A/S
- 6.4.7 Koppert Biological Systems B.V.
- 6.4.8 Valent BioSciences LLC
- 6.4.9 FMC Corporation
- 6.4.10 Rovensa S.A.
- 6.4.11 Certis USA LLC
- 6.4.12 Andermatt Biocontrol AG
- 6.4.13 Yara International ASA
- 6.4.14 Futureco Bioscience S.A.
- 6.4.15 Verdesian Life Sciences LLC
7 MARKET OPPORTUNITIES AND FUTURE OUTLOOK

 2026年全球核糖核酸(RNA)農藥市場報告
 生物合理作物保護(BCP)市場規模、佔有率和成長分析:按產品類型、作物類型、應用方法、最終用戶和地區分類-2026-2033年產業預測
 農業生技藥品市場:按產品類型、原料、應用方法、目標作物、地區和主要參與者分類的趨勢和預測(至 2035 年)
 越南農業生技藥品市場:市場佔有率分析、產業趨勢與統計、成長預測(2026-2031年)
 農業生技藥品市場:2026-2032年全球市場預測(按產品類型、應用方法、原料、製劑、製劑形式、功能、最終用戶和分銷管道分類)
 2034年細菌微生物材料市場預測-按產品類型、細菌菌株、應用方法、用途和地區分類的全球分析2034年農業生物製品市場預測-按產品類型、原料、作物類型、功能、配方、最終用戶細分市場和地區分類的全球分析
 農業生技藥品市場規模、佔有率、趨勢和預測:按類型、原料、應用方法、用途和地區分類,2026-2034年
 農業生物技術市場:按產品類型、應用方法、用途和地區分類
 動物微生物組市場規模、佔有率和成長分析:按動物種類、產品類型、原料、形態、應用、最終用戶、通路和地區分類——2026-2033年行業預測