


 |
市場調查報告書
商品編碼
2066502
鋰離子電池回收:市場佔有率分析、行業趨勢和統計數據以及成長預測(2026-2031 年)Lithium-ion Battery Recycling - Market Share Analysis, Industry Trends & Statistics, Growth Forecasts (2026 - 2031) |
||||||

※ 本網頁內容可能與最新版本有所差異。詳細情況請與我們聯繫。
據 Mordor Intelligence 稱,2025 年鋰離子電池回收市場價值為 43.3 億美元,預計到 2031 年將達到 147.9 億美元,而 2026 年為 50.7 億美元,預測期(2026-2031 年)的複合年成長率為 23.87%。
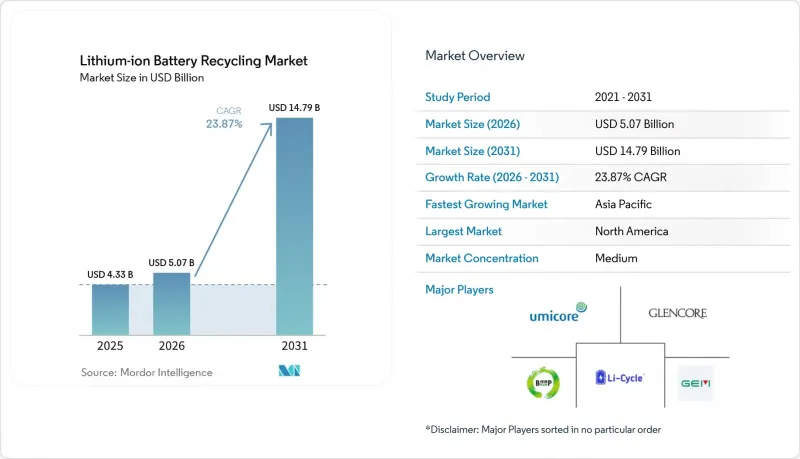
本報告涵蓋了廢棄物的來源(例如汽車電池)、電池化學成分(例如NMC)、回收技術(例如濕冶金)、製程階段(例如機械破碎和分類)、回收材料的應用(例如電池級鋰化合物)、終端用戶產業(例如汽車)以及地區(例如北美和亞太地區)。
全球鋰離子電池回收市場趨勢及洞察
電動車電池報廢浪潮正在加速。
2015年至2018年間銷售的早期大眾市場電動車將於2024年至2025年間陸續結束保固期,預計將有28萬噸電池組進入全球回收系統。 2016年至2018年補貼熱潮期間在中國推出的電動公車和計程車目前已陸續退役,而歐洲的日產聆風和雷諾Zoe等車款也正逐步走向回收。這種轉變使得回收商能夠利用價值更高、富含鈷的電池組,而不是依賴利潤微薄的生產廢棄物。特斯拉報告稱,其4,680電池中關鍵礦物的回收率高達92%,這些礦物可用於製造新電池,從而支持了閉合迴路的經濟可行性。預計2027年至2030年間,隨著2019年至2022年銷售熱潮期間售出的車輛陸續達到使用壽命終點,電池回收量將進一步激增。
加強全球生產者責任延伸制度(EPR)和歐盟電池法規
歐盟電池法規將於2024年2月生效,該法規設定了2027年實現63%、2030年實現73%的回收目標,違規者將面臨最高相當於年銷售額4%的罰款。中國正透過數位化溯源系統,強制要求2025年達到65%動力電池的回收率,韓國則要求2028年達到80%的回收率。因此,汽車製造商必須投資建置逆向物流網路。 2025年3月,福斯汽車撥款2億歐元,用於整合旗下1,200家經銷商及350家第三方回收設施。不斷上漲的合規成本正推動鋰離子電池回收市場走向規模化和垂直整合。
金屬價格波動和高昂的逆向物流成本
2024年3月至2025年12月期間,碳酸鋰價格暴跌85%,導致黑塊鋰的價格跌至每噸6,500美元,迫使部分回收商虧損。逆向物流成本在每噸150至250美元之間。這是因為根據聯合國第3480號條例,電池組被列為危險品,需要防火包裝並檢查充電狀態。每當金屬價格下跌時,這些結構性成本都會擠壓利潤空間。
細分市場分析
預計到2025年,汽車電池組將佔汽車電池總銷量的63.8%,隨著2015年至2020年間生產的車輛陸續報廢,這一比例預計還將進一步上升。同時,生產廢棄物能夠提供即時的電池供應,避免回收瓶頸,進而促進濕式冶煉廠的快速運作。通用汽車的「Ultium」保證等原始設備製造商(OEM)回收計劃減輕了消費者的負擔,並且由於汽車電池的回收目標高於攜帶式電子產品,資源流向也進一步向汽車電池傾斜。汽車鋰離子電池回收市場預計將以25.3%的複合年成長率成長,但由於回收系統分散以及「被遺忘在抽屜裡」的問題,家用電子電器發展落後。
截至2025年,生產廢棄物僅佔總處理量的7%,但它提供了一種化學成分穩定且均一的原料,為直接回收試點計畫提供了支持。隨著超級工廠的初始回收率從2022年的89%提升至2025年的96%,此來源的廢棄物量將趨於穩定。儘管如此,廢料合約中包含的最低數量條款降低了優美科等回收商在新增產能方面的投資風險。
由於NMC在長續航里程電動車市場的主導地位以及其高鈷含量,預計到2025年,NMC將維持50.1%的市場佔有率,這支撐了其強大的經濟可行性。磷酸鐵鋰(LFP)的成長速度最快,特斯拉和比亞迪已在其標準續航里程車型中採用這種化學成分。然而,由於完全不含鈷,LFP的內在價值降低,其黑塊價格比NMC低65%。因此,回收商依靠高處理能力和監管補貼才能從LFP的供應中獲利。
儘管LCO在筆記型電腦和智慧型手機領域仍然盈利,但由於設備小型化,其處理能力卻停滯不前。 NCA、LMO和LTO則在高效能或長壽命應用中扮演著獨特的角色。中國擬將LFP的鋰回收率要求從70%提高到85%,旨在彌補這一價值差距,並有可能進一步擴大LFP回收的經濟可行性。
區域分析
預計到2025年,亞太地區將佔全球銷售額的44.6%,這主要得益於中國65%的電池回收率政策以及Brunp公司12萬噸的處理能力。歐洲將佔28%的市場佔有率,這主要得益於Northvolt公司的「Revolt」工廠以及歐盟嚴格的電池監管目標。北美地區預計到2031年將以27.1%的複合年成長率成長,成為成長最快的地區,這主要得益於《通貨膨脹控制法案》(IRA)將稅額扣抵與基準值掛鉤,並推動了美國能源局(DOE)支持的項目,例如Redwood Materials公司100吉瓦時的正極材料生產設施。
南美洲的市佔率仍為4%,但隨著鋰資源豐富的國家開始進行國內回收示範項目,這一數字呈現上升趨勢。中東和非洲的市佔率為3%,但隨著以新加坡為中心設立的區域中心以及海灣國家引進太陽能和儲能設施的相關獎勵,其市場佔有率可望成長。日本和印度都已宣布補貼計畫和法規草案,但商業性開發仍處於早期階段。
其他好處:
- Excel格式的市場預測(ME)表
- 3個月的分析師支持
目錄
第1章:引言
- 研究假設和市場定義
- 調查範圍
第2章:調查方法
第3章執行摘要
第4章 市場狀況
- 市場概覽
- 市場促進因素
- 電動車電池的處置速度正在加快。
- 全球EPR和歐盟電池法規的要求更加嚴格。
- 原物料價格上漲正在推動循環供應鏈的發展。
- 透過新一代水力發電和直接循環利用技術,產量將大幅提高。
- 透過採用 OEM 設計的可回收電池組來降低拆卸成本。
- 高流動性「黑市」現貨市場的興起
- 市場限制因素
- 金屬價格波動和高昂的逆向物流成本
- 遵守高壓電流收集安全和危險材料法規。
- 區域產能過剩會造成原料短缺的風險。
- 磷酸鐵鋰電池的內在價值較低
- 供應鏈分析
- 監理情勢
- 技術展望
- 波特五力模型
第5章 市場規模與成長預測
- 按處置來源
- 汽車電池
- 家用電子設備電池
- 工業和儲能電池
- 生產廢料
- 電池化學成分
- 鈷酸鋰(LCO)
- 磷酸鋰鐵(LFP)
- 鋰鎳錳鈷(NMC)
- 鋰鎳鈷鋁(NCA)
- 鋰錳氧化物(LMO)
- 鈦酸鋰(LTO)
- 透過回收技術
- 濕式冶金
- 熱冶金法
- 直接/機械
- 混合和新興技術(生物/電化學)
- 依工藝階段
- 收集和物流
- 拆卸/排放
- 機械破碎與分類
- 黑彌撒生產
- 材料淨化與回收
- 利用回收材料
- 正極活性物質
- 負極/石墨
- 用於電池的鋰化合物
- 鈷鹽和鎳鹽
- 錳
- 其他(銅、鋁)
- 按最終用戶行業分類
- 車
- 海上
- 電力和儲能
- 家用電子產品
- 其他
- 按地區
- 北美洲
- 美國
- 加拿大
- 墨西哥
- 歐洲
- 英國
- 德國
- 法國
- 西班牙
- 北歐國家
- 俄羅斯
- 其他歐洲國家
- 亞太地區
- 中國
- 印度
- 日本
- 韓國
- 東南亞國協
- 澳洲和紐西蘭
- 其他亞太國家
- 南美洲
- 巴西
- 阿根廷
- 哥倫比亞
- 其他南美國家
- 中東和非洲
- 沙烏地阿拉伯
- 阿拉伯聯合大公國
- 南非
- 埃及
- 其他中東和非洲國家
- 北美洲
第6章 競爭情勢
- 市場集中度
- 策略趨勢(併購、聯盟、購電協議)
- 市場佔有率分析(主要公司的市場排名和佔有率)
- 公司簡介
- Umicore SA
- Glencore PLC
- Brunp Recycling(CATL)
- GEM Co., Ltd.
- Li-Cycle Holdings Corp.
- Redwood Materials Inc.
- Ascend Elements(Battery Resources)
- Ecobat
- American Battery Technology Co.(ABTC)
- RecycLiCo Battery Materials
- Retriev Technologies Inc.
- Cirba Solutions
- Duesenfeld GmbH
- TES-AMM Pte Ltd.
- Recupyl SAS
- Raw Materials Company Inc.
- Glencore-Li-Cycle Portovesme JV
- Ganfeng Lithium Co., Ltd.
- Eramet-Suez JV(Recyclage Batteries)
- InoBat-Minerals JV
第7章 市場機會與未來展望
According to Mordor Intelligence, the lithium-ion battery recycling market size was valued at USD 4.33 billion in 2025 and is estimated to grow from USD 5.07 billion in 2026 to reach USD 14.79 billion by 2031, at a CAGR of 23.87% during the forecast period (2026-2031).
This report is Segmented by End-Of-Life Source (Automotive Batteries, and More), Battery Chemistry (NMC, and More), Recycling Technology (Hydrometallurgical, and More), Process Stage (Mechanical Shredding/Sorting, and More), Application of Recovered Materials (Battery-Grade Lithium Compound, and More), End-User Industry (Automotive, and More), and Geography (North America, Asia-Pacific, and More)
Global Lithium-ion Battery Recycling Market Trends and Insights
Accelerating wave of EV battery retirements
Early cohorts of mass-market EVs sold between 2015 and 2018 began hitting end-of-warranty in 2024-2025, sending an estimated 280,000 tonnes of packs into global collection systems. China's electric buses and taxis from the 2016-2018 subsidy boom are now retiring, while Europe's Nissan Leaf and Renault Zoe fleets move into recycling channels. The shift means recyclers can tap higher-value cobalt-rich packs instead of relying on lower-margin manufacturing scrap. Tesla reported that 92% of critical minerals in its 4680 cells can be recovered and looped back into new batteries, validating the economic case for closed loops. A subsequent surge in volumes is expected from 2027-2030 as vehicles sold in the 2019-2022 growth spurt reach retirement.
Tightening global EPR & EU Battery Regulation mandates
The EU Battery Regulation, effective February 2024, sets a 63% collection target by 2027 and 73% by 2030, underpinned by fines of up to 4% of annual turnover for non-compliance. China mandates 65% recycling of power batteries by 2025 through a digital traceability system, and South Korea requires 80% collection by 2028. Automakers, therefore, must finance reverse logistics networks; Volkswagen allocated EUR 200 million in March 2025 to integrate 1,200 dealerships and 350 third-party sites. Compliance costs are driving the lithium-ion battery recycling market toward scale and vertical integration.
Volatile Metal Prices & High Reverse-Logistics Costs
Lithium carbonate's 85% crash between March 2024 and December 2025 dragged black-mass prices down to USD 6,500 per tonne, forcing some recyclers into negative margins. Reverse-logistics costs range from USD 150-250 per tonne because packs are hazmat-classified under UN 3480 rules that require fire-resistant packaging and state-of-charge testing. These structural costs compress margins whenever metals fall.
Other drivers and restraints analyzed in the detailed report include:
- Raw-Material Price Inflation Spurring Closed-Loop Supply Chains
- Step-change yields from next-generation hydro & direct recycling
- Regional Over-Capacity Creating Feedstock Scarcity Risk
For complete list of drivers and restraints, kindly check the Table Of Contents.
Segment Analysis
Automotive packs accounted for 63.8% of revenue in 2025, a figure expected to rise as the 2015-2020 vehicle cohort retires. Manufacturing scrap, however, supplies immediate volume, sidestepping collection bottlenecks and enabling rapid ramp-up of hydrometallurgical plants. OEM take-back programs such as GM's Ultium warranty eliminate consumer friction, and higher targets for automotive than portable electronics further tilt flows toward vehicle batteries. The lithium-ion battery recycling market size for automotive sources is set to expand at a 25.3% CAGR, while consumer electronics lags due to fragmented collection and "drawer hoarding."
Manufacturing scrap represented only 7% of tonnage in 2025 but supplied steady, chemistry-homogeneous feedstock that supports direct recycling pilots. As the gigafactories' first-pass yields improve from 89% in 2022 to 96% in 2025, this stream will plateau; nonetheless, minimum-volume clauses in scrap contracts de-risk new capacity investments for recyclers like Umicore.
NMC held a 50.1% share in 2025 thanks to its dominance in long-range EVs and high cobalt content, which sustains favorable economics. LFP is growing fastest as Tesla and BYD deploy the chemistry in standard-range vehicles; however, its zero-cobalt composition erodes intrinsic value, lowering black-mass pricing by 65% relative to NMC. Recyclers, therefore, rely on high throughput and regulatory credits to profit from LFP streams.
LCO remains lucrative in laptops and smartphones, but shrinking device footprints cap tonnage. NCA, LMO, and LTO fill niche roles in high-performance or long-cycle applications. China's draft rule raising the required lithium recovery for LFP from 70% to 85% aims to close the value gap, potentially unlocking a broader economic case for LFP recycling.
Geography Analysis
Asia-Pacific generated 44.6% of global revenue in 2025, buoyed by China's 65% recycling mandate and Brunp's 120,000-tonne capacity. Europe held a 28% share, anchored by Northvolt's Revolt plant and strict EU Battery Regulation targets. North America posted the highest 27.1% CAGR forecast through 2031 as the IRA links tax credits to recycled content thresholds, catalyzing DOE-backed projects such as Redwood Materials' 100 GWh cathode facility.
South America's share sits at 4% but is rising as lithium-rich nations launch domestic recycling pilots. The Middle East and Africa claim 3% but may expand through regional hubs in Singapore and incentives tied to solar-plus-storage installations in Gulf states. Japan and India have announced subsidy programs and draft rules, respectively, yet commercial deployments remain early-stage.
- Umicore SA
- Glencore PLC
- Brunp Recycling (CATL)
- GEM Co., Ltd.
- Li-Cycle Holdings Corp.
- Redwood Materials Inc.
- Ascend Elements (Battery Resources)
- Ecobat
- American Battery Technology Co. (ABTC)
- RecycLiCo Battery Materials
- Retriev Technologies Inc.
- Cirba Solutions
- Duesenfeld GmbH
- TES-AMM Pte Ltd.
- Recupyl SAS
- Raw Materials Company Inc.
- Glencore-Li-Cycle Portovesme JV
- Ganfeng Lithium Co., Ltd.
- Eramet-Suez JV (Recyclage Batteries)
- InoBat-Minerals JV
Additional Benefits:
- The market estimate (ME) sheet in Excel format
- 3 months of analyst support
TABLE OF CONTENTS
1 Introduction
- 1.1 Study Assumptions & Market Definition
- 1.2 Scope of the Study
2 Research Methodology
3 Executive Summary
4 Market Landscape
- 4.1 Market Overview
- 4.2 Market Drivers
- 4.2.1 Accelerating wave of EV battery retirements
- 4.2.2 Tightening global EPR & EU Battery Regulation mandates
- 4.2.3 Raw-material price inflation spurring closed-loop supply chains
- 4.2.4 Step-change yields from next-gen hydro & direct recycling
- 4.2.5 OEM design-for-recycling battery packs reducing dismantling cost
- 4.2.6 Emergence of liquid "black-mass" spot markets
- 4.3 Market Restraints
- 4.3.1 Volatile metal prices & high reverse-logistics costs
- 4.3.2 Safety & haz-mat compliance in high-voltage collection
- 4.3.3 Regional over-capacity creating feedstock scarcity risk
- 4.3.4 Low intrinsic value of LFP chemistries
- 4.4 Supply-Chain Analysis
- 4.5 Regulatory Landscape
- 4.6 Technological Outlook
- 4.7 Porter's Five Forces
- 4.7.1 Bargaining Power of Suppliers
- 4.7.2 Bargaining Power of Buyers
- 4.7.3 Threat of New Entrants
- 4.7.4 Threat of Substitutes
- 4.7.5 Intensity of Competitive Rivalry
5 Market Size & Growth Forecasts
- 5.1 By End-of-Life Source
- 5.1.1 Automotive Batteries
- 5.1.2 Consumer Electronics Batteries
- 5.1.3 Industrial and ESS Batteries
- 5.1.4 Manufacturing Scrap
- 5.2 By Battery Chemistry
- 5.2.1 Lithium Cobalt Oxide (LCO)
- 5.2.2 Lithium Iron Phosphate (LFP)
- 5.2.3 Lithium Nickel Manganese Cobalt (NMC)
- 5.2.4 Lithium Nickel Cobalt Aluminium (NCA)
- 5.2.5 Lithium Manganese Oxide (LMO)
- 5.2.6 Lithium Titanate (LTO)
- 5.3 By Recycling Technology
- 5.3.1 Hydrometallurgical
- 5.3.2 Pyrometallurgical
- 5.3.3 Direct/Mechanical
- 5.3.4 Hybrid and Emerging (Bio/ Electro-chemical)
- 5.4 By Process Stage
- 5.4.1 Collection and Logistics
- 5.4.2 Dismantling and Discharge
- 5.4.3 Mechanical Shredding/Sorting
- 5.4.4 Black-Mass Production
- 5.4.5 Material Refining and Recovery
- 5.5 By Application of Recovered Materials
- 5.5.1 Cathode Active Materials
- 5.5.2 Anode/Graphite
- 5.5.3 Battery-grade Lithium Compounds
- 5.5.4 Cobalt and Nickel Salts
- 5.5.5 Manganese
- 5.5.6 Others (Cu, Al)
- 5.6 By End-user Industry
- 5.6.1 Automotive
- 5.6.2 Marine
- 5.6.3 Power and Energy Storage
- 5.6.4 Consumer Electronics
- 5.6.5 Others
- 5.7 By Geography
- 5.7.1 North America
- 5.7.1.1 United States
- 5.7.1.2 Canada
- 5.7.1.3 Mexico
- 5.7.2 Europe
- 5.7.2.1 United Kingdom
- 5.7.2.2 Germany
- 5.7.2.3 France
- 5.7.2.4 Spain
- 5.7.2.5 NORDIC Countries
- 5.7.2.6 Russia
- 5.7.2.7 Rest of Europe
- 5.7.3 Asia-Pacific
- 5.7.3.1 China
- 5.7.3.2 India
- 5.7.3.3 Japan
- 5.7.3.4 South Korea
- 5.7.3.5 ASEAN Countries
- 5.7.3.6 Australia and New Zealand
- 5.7.3.7 Rest of Asia-Pacific
- 5.7.4 South America
- 5.7.4.1 Brazil
- 5.7.4.2 Argentina
- 5.7.4.3 Colombia
- 5.7.4.4 Rest of South America
- 5.7.5 Middle East and Africa
- 5.7.5.1 Saudi Arabia
- 5.7.5.2 United Arab Emirates
- 5.7.5.3 South Africa
- 5.7.5.4 Egypt
- 5.7.5.5 Rest of Middle East and Africa
- 5.7.1 North America
6 Competitive Landscape
- 6.1 Market Concentration
- 6.2 Strategic Moves (M&A, Partnerships, PPAs)
- 6.3 Market Share Analysis (Market Rank/Share for key companies)
- 6.4 Company Profiles (includes Global level Overview, Market level overview, Core Segments, Financials as available, Strategic Information, Products & Services, and Recent Developments)
- 6.4.1 Umicore SA
- 6.4.2 Glencore PLC
- 6.4.3 Brunp Recycling (CATL)
- 6.4.4 GEM Co., Ltd.
- 6.4.5 Li-Cycle Holdings Corp.
- 6.4.6 Redwood Materials Inc.
- 6.4.7 Ascend Elements (Battery Resources)
- 6.4.8 Ecobat
- 6.4.9 American Battery Technology Co. (ABTC)
- 6.4.10 RecycLiCo Battery Materials
- 6.4.11 Retriev Technologies Inc.
- 6.4.12 Cirba Solutions
- 6.4.13 Duesenfeld GmbH
- 6.4.14 TES-AMM Pte Ltd.
- 6.4.15 Recupyl SAS
- 6.4.16 Raw Materials Company Inc.
- 6.4.17 Glencore-Li-Cycle Portovesme JV
- 6.4.18 Ganfeng Lithium Co., Ltd.
- 6.4.19 Eramet-Suez JV (Recyclage Batteries)
- 6.4.20 InoBat-Minerals JV
7 Market Opportunities & Future Outlook
- 7.1 White-space & Unmet-Need Assessment

 2026年全球鋰離子電池回收市場報告
 鋰離子電池回收市場:2026-2032 年全球市場預測,按電池來源、電池化學成分、回收製程、可回收組件、回收材料類型和最終用途細分。
 全球鋰離子電池回收市場規模、佔有率、趨勢和成長分析報告(2026-2034)
 鋰離子電池回收市場預測至 2034 年—按來源、電池組件、回收流程、電池化學成分、最終用戶和地區進行全球分析。鋰離子電池NMP回收系統市場:依回收方法、電池化學、材料回收、來源、經營模式和應用分類-全球預測,2026-2032年鋰電池NMP回收市場:依製程、電池尺寸、純度等級及應用分類-2026-2032年全球預測鋰電池NMP回收設備市場:按類型、技術、最終用戶、容量、應用和銷售管道分類-2026-2032年全球預測鋰離子電池回收生產線市場:依製程類型、化學成分、回收階段、回收材料和應用分類-全球預測,2026-2032年
 鋰離子電池回收市場機會、成長要素、產業趨勢分析及2026-2035年預測。
 鋰離子電池回收市場規模、佔有率和趨勢分析:按應用、地區和細分市場預測(2026-2033 年)