


 |
市場調查報告書
商品編碼
2065777
印度回收市場:市場佔有率分析、產業趨勢與統計及成長預測(2026-2031)India Recycling - Market Share Analysis, Industry Trends & Statistics, Growth Forecasts (2026 - 2031) |
||||||

※ 本網頁內容可能與最新版本有所差異。詳細情況請與我們聯繫。
據 Mordor Intelligence 稱,2025 年印度回收市場價值 8.9 億美元,預計到 2031 年將從 2026 年的 9.7 億美元成長至 14.5 億美元,預測期(2026-2031 年)複合年成長率為 8.44%。
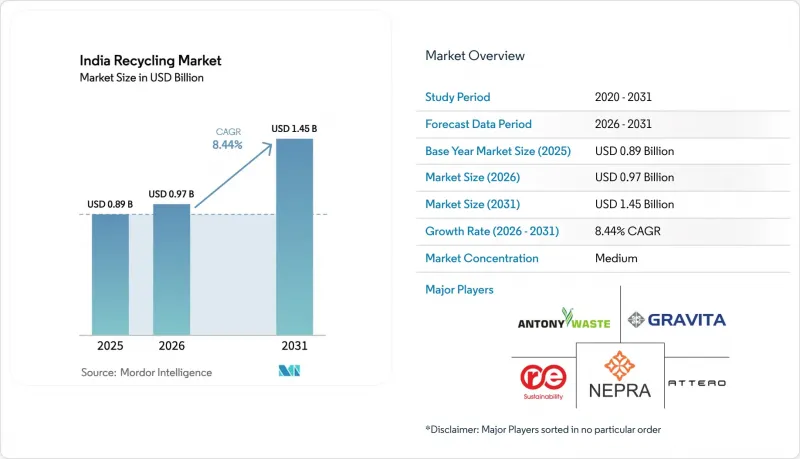
本報告按材料類型(塑膠、金屬、紙張和紙板、玻璃及其他)、來源(城市固體廢棄物、工業廢棄物、醫療廢棄物、建築廢棄物及其他來源)、技術(機械回收、化學回收、生物回收及其他技術)和地區(印度)進行細分。市場預測以美元計價。
印度回收市場趨勢與洞察
塑膠和電子產業的生產者延伸責任(EPR)義務
《2022年塑膠廢棄物管理條例》和《2022年電子廢棄物管理條例》規定,到2025-2026年,電子廢棄物回收率必須達到60%,到2027-2028年必須提高到80%;鋰離子電池的回收率也必須達到70%。環境補償附加稅為每噸5,000至20,000盧比,因此不遵守法規將造成巨大的經濟負擔。回收價格根據聚合物等級和當地供需情況的不同,在每公斤8至25盧比之間波動。馬哈拉斯特拉邦和泰米爾納德邦每季進行一次審核,以鼓勵正規的回收企業過渡到通過ISO 14001認證的收集設施。電池法規要求電動車(EV)原始設備製造商(OEM)建立閉合迴路網路,這正在加速與Attero和Gravita等公司建立逆向物流合作夥伴關係。
都市區一般廢棄物(MSW)數量不斷增加,而掩埋空間卻短缺。
印度每天產生16萬至17萬噸城市固態廢棄物,但在「清潔印度2.0」計畫下,2421個老舊掩埋中僅有474個得到修復。在土地資源匱乏的大都會圈,掩埋成本超過每噸800至1,200盧比,因此回收比掩埋更經濟。至2026年,中央政府已撥款14.16億盧比(約170億美元)用於興建資源回收設施和垃圾焚化發電發電廠。然而,二線城市的垃圾源頭分類率仍低於30%,導致未分類廢棄物的聚合物回收率僅40%至50%,而分類廢棄物的聚合物回收率則高達70%至80%。像「Saahas Zero Waste」這樣的分散式廢棄物管理業者正在部署微型堆肥機來繞過市政瓶頸。
分散且非正式的收藏生態系統
在小規模的城市,60-70%的「首公里」回收工作由遊離於稅法和勞動法以外的非正式回收網路完成。這阻礙了可追溯性,並削弱了品牌所有者所要求的基於ISO 14021標準的自我聲明的可信度。由於非正式仲介業者規避了合規成本,正規回收商需要支付高出15-25%的原料價格。市政試驗計畫提供的身份驗證、保險和固定價格等措施,實際上卻造成了官僚主義的拖延,且覆蓋率不足20%。 20-30%的污染率需要額外的清洗工序,增加了處理成本。
細分市場分析
目前,塑膠在印度回收市場佔有36.86%的佔有率,但由於包裝材料成長放緩和單一材料設計的普及,處理能力受到限制。 Atero公司7,600萬美元的資金籌措表明,人們對電池金屬回收的信心日益增強;同時,來自化學回收商的高品質rPET正滿足可口可樂印度公司與印度公司簽訂的多年期收購協議。電子商務對瓦楞紙板的需求推動了紙張回收的發展,而輪胎熱解正在拓展「其他材料」這一細分市場。預計到2031年,在廢棄電池數量激增(預計將達到60萬噸)的推動下,金屬產業將以8.94%的複合年成長率成長。
隨著印度斯坦鋅業和格拉維塔印度等綜合生產商將廢料回收業務整合到初級冶煉環節,印度金屬回收市場預計將會擴張。塑膠產業保持著規模經濟效益,但面臨確保其在整個價值鏈中符合食品接觸要求的壓力。化學回收生產的高品質聚合物的利潤率是機械回收產品的兩倍,這推動了古吉拉突邦和泰米爾納德邦產能的擴張。由於物流成本高和玻璃屑需求量低,玻璃和複合材料的回收規模仍然小規模。
其他好處:
- Excel格式的市場預測(ME)表
- 3個月的分析師支持
目錄
第1章:引言
- 研究假設和市場定義
- 調查範圍
第2章:調查方法
第3章執行摘要
第4章 市場狀況
- 市場概覽
- 市場促進因素
- 擴大塑膠和電子產業的生產者責任延伸義務
- 都市區廢棄物(MSW)數量增加,而掩埋空間短缺
- 日常消費品(FMCG) 和包裝產業的大型公司對再生材料的需求激增。
- 回收工廠的稅收優惠(消費稅減免、生產關聯激勵措施)
- 電動車的普及導致鋰離子電池廢棄量激增
- 市場限制因素
- 分散且非正式的收藏生態系統
- 國內低等級再生聚合物的終端市場有限。
- 受全球大宗商品週期變動的影響,廢料價格出現波動。
- 價值鏈分析
- 波特五力模型
第5章 市場規模與成長預測
- 材料類型
- 塑膠
- 金屬
- 紙張和紙板
- 玻璃
- 其他
- 來源
- 市政(住宅/商業)
- 產業
- 醫療廢棄物
- 建築廢棄物
- 其他來源
- 透過技術
- 機械回收
- 科學回收
- 生物循環利用
- 其他技術
第6章 競爭情勢
- 市場集中度
- 策略趨勢
- 市佔率和排名分析
- 公司簡介
- A2Z Group
- Antony Waste Handling Cell Limited
- Attero
- Cerebra Integrated Technologies Ltd.
- Dalmia Polypro Industries Pvt. Ltd.
- Eco Recycling
- Gravita India
- Greenko Group
- Hindustan Zinc
- NEST
- Ramky Enviro Engineers
- Rapidue Technologies Pvt. Ltd.
- Saahas Zero Waste
- Sampurn(e)arth Environment Solutions Pvt. Ltd.
- The Shakti Plastic Industries
- UltraTech Cement Ltd.
第7章 市場機會與未來展望
According to Mordor Intelligence, the india recycling market size was valued at USD 0.89 billion in 2025 and is estimated to grow from USD 0.97 billion in 2026 to reach USD 1.45 billion by 2031, at a CAGR of 8.44% during the forecast period (2026-2031).
This report is Segmented by Material Type (Plastics, Metals, Paper and Cardboard, Glass, and Others), Source (Municipal, Industrial, Medical Waste, Construction Waste, and Other Sources), Technology (Mechanical Recycling, Chemical Recycling, Biological Recycling, and Other Technologies), and Geography (India). The Market Forecasts are Provided in Terms of Value (USD).
India Recycling Market Trends and Insights
Extended EPR Mandates Across Plastics and Electronics
Plastic Waste Management Rules 2022 and E-Waste Management Rules 2022 impose 60% e-waste collection for 2025-2026, rising to 80% by 2027-2028, and 70% lithium-ion battery recovery by 2027-2028. Environmental compensation levies range from Rs 5,000 to Rs 20,000 per ton, turning non-compliance into a costly option. Credit prices fluctuate between Rs 8 and Rs 25 per kilogram, depending on the polymer grade and regional supply and demand. Maharashtra and Tamil Nadu conduct quarterly audits that encourage organized recyclers to transition toward ISO 14001-certified recovery facilities. Battery rules compel electric-vehicle OEMs to establish closed-loop networks, accelerating reverse-logistics partnerships with Attero and Gravita.
Rising Urban MSW Volumes and Landfill Shortages
India produces 160,000-170,000 tons of municipal solid waste (MSW) daily, yet only 474 of the 2,421 legacy landfills have been remediated under the Swachh Bharat Mission 2.0. Tipping fees in land-scarce metros exceed Rs 800-Rs 1,200 per ton, making recycling more economical than dumping. Central allocations of Rs 1,41,600 crore (USD 17 billion) through 2026 fund material recovery and waste-to-energy plants. However, source segregation remains below 30% in tier-2 cities, resulting in polymer recovery yields of 40-50% compared to 70-80% for segregated streams. Decentralized processors such as Saahas Zero Waste deploy micro-composters that bypass municipal bottlenecks.
Fragmented, Informal Collection Ecosystem
Informal picker networks handle 60-70% of first-mile collection in smaller cities, operating outside tax and labor frameworks. This curtails traceability, undermining ISO 14021 self-declarations sought by brand owners. Formal recyclers pay 15-25% more for feedstock because informal agents circumvent compliance costs. Municipal pilot programs offering IDs, insurance, and fixed prices cover under 20% of workers due to bureaucratic delays. Contamination rates of 20-30% force extra washing and raise processing costs.
Other drivers and restraints analyzed in the detailed report include:
- Surge in Recycled-Content Demand from FMCG and Packaging Majors
- Fiscal Incentives and Lithium-Ion Battery End-of-Life Wave
- Limited Domestic End-Markets for Lower-Grade Recyclate & Scrap Price Volatility
For complete list of drivers and restraints, kindly check the Table Of Contents.
Segment Analysis
Plastics currently account for 36.86% of India's recycling market share, yet slower packaging growth and mono-material design are limiting volumes. Attero's USD 76 million raise underscores confidence in battery-metal loops, while premium rPET from chemical recyclers satisfies Coca-Cola India's multi-year off-takes. Paper recycling leverages e-commerce corrugate demand, and tire pyrolysis expands the niche for "other materials." Metals are expected to grow at a 8.94% CAGR to 2031, driven by soaring end-of-life battery flows that are projected to reach 600,000 tons.
The Indian recycling market size for metals is poised to grow as integrated producers such as Hindustan Zinc and Gravita India integrate scrap operations into primary smelting. Plastics retain scale advantages but face pressure from the value chain to deliver food-contact compliance. Premium chemical-route polymers command a double margin over mechanically recycled grades, incentivizing capacity additions in Gujarat and Tamil Nadu. Glass and composites remain small due to high logistics costs and low cullet demand.
List of Companies Covered in this Report:
- A2Z Group
- Antony Waste Handling Cell Limited
- Attero
- Cerebra Integrated Technologies Ltd.
- Dalmia Polypro Industries Pvt. Ltd.
- Eco Recycling
- Gravita India
- Greenko Group
- Hindustan Zinc
- NEST
- Ramky Enviro Engineers
- Rapidue Technologies Pvt. Ltd.
- Saahas Zero Waste
- Sampurn(e)arth Environment Solutions Pvt. Ltd.
- The Shakti Plastic Industries
- UltraTech Cement Ltd.
Additional Benefits:
- The market estimate (ME) sheet in Excel format
- 3 months of analyst support
TABLE OF CONTENTS
1 Introduction
- 1.1 Study Assumptions & Market Definition
- 1.2 Scope of the Study
2 Research Methodology
3 Executive Summary
4 Market Landscape
- 4.1 Market Overview
- 4.2 Market Drivers
- 4.2.1 Extended EPR mandates across plastics and electronics
- 4.2.2 Rising urban MSW volumes and landfill shortages
- 4.2.3 Surge in recycled-content demand from FMCG and packaging majors
- 4.2.4 Fiscal incentives (GST concessions, PLI) for recycling plants
- 4.2.5 Lithium-ion battery end-of-life wave from Electric Vehicle adoption
- 4.3 Market Restraints
- 4.3.1 Fragmented, informal collection ecosystem
- 4.3.2 Limited domestic end-markets for lower-grade recycled polymers
- 4.3.3 Volatility in scrap prices linked to global commodity cycles
- 4.4 Value Chain Analysis
- 4.5 Porter's Five Forces
- 4.5.1 Bargaining Power of Suppliers
- 4.5.2 Bargaining Power of Consumers
- 4.5.3 Threat of New Entrants
- 4.5.4 Threat of Substitute Products
- 4.5.5 Intensity of Competitive Rivalry
5 Market Size & Growth Forecasts (Value)
- 5.1 By Material Type
- 5.1.1 Plastics
- 5.1.2 Metals
- 5.1.3 Paper and Cardboard
- 5.1.4 Glass
- 5.1.5 Others
- 5.2 By Source
- 5.2.1 Municipal (Residential and Commercial)
- 5.2.2 Industrial
- 5.2.3 Medical Waste
- 5.2.4 Construction Waste
- 5.2.5 Other Sources
- 5.3 By Technology
- 5.3.1 Mechanical Recycling
- 5.3.2 Chemical Recycling
- 5.3.3 Biological Recycling
- 5.3.4 Other Technologies
6 Competitive Landscape
- 6.1 Market Concentration
- 6.2 Strategic Moves
- 6.3 Market Share (%)/Ranking Analysis
- 6.4 Company Profiles (includes Global level Overview, Market level overview, Core Segments, Financials as available, Strategic Information, Market Rank/Share for key companies, Products & Services, and Recent Developments)
- 6.4.1 A2Z Group
- 6.4.2 Antony Waste Handling Cell Limited
- 6.4.3 Attero
- 6.4.4 Cerebra Integrated Technologies Ltd.
- 6.4.5 Dalmia Polypro Industries Pvt. Ltd.
- 6.4.6 Eco Recycling
- 6.4.7 Gravita India
- 6.4.8 Greenko Group
- 6.4.9 Hindustan Zinc
- 6.4.10 NEST
- 6.4.11 Ramky Enviro Engineers
- 6.4.12 Rapidue Technologies Pvt. Ltd.
- 6.4.13 Saahas Zero Waste
- 6.4.14 Sampurn(e)arth Environment Solutions Pvt. Ltd.
- 6.4.15 The Shakti Plastic Industries
- 6.4.16 UltraTech Cement Ltd.
7 Market Opportunities and Future Outlook
- 7.1 White-space and Unmet-need Assessment

 全球鞋類回收市場
 多材料回收市場報告:趨勢、預測和競爭分析(至2035年)
 全球電子產品回收市場:市場規模、佔有率、趨勢和成長分析(2026-2034)
 2026 年至 2035 年商業回收箱市場的商業機會、成長要素、產業趨勢與預測。2026-2034年全球商用回收容器市場規模、佔有率、趨勢和成長分析報告
 全球多層薄膜回收市場:市場規模、佔有率和趨勢分析(按層壓類型、最終用途和地區分類),細分市場預測(2025-2033 年)
 全球商用回收箱市場全球多材料回收市場
 耐火材料回收市場-全球產業規模、佔有率、趨勢、機會和預測(按產品、最終用戶、地區和競爭細分,2020-2030 年)耐火材料回收全球市場-按產品類型、應用、地區和預測分類的市場規模