


 |
市場調查報告書
商品編碼
2045873
2026 年至 2035 年商業回收箱市場的商業機會、成長要素、產業趨勢與預測。Commercial Recycling Bins Market Opportunity, Growth Drivers, Industry Trend Analysis, and Forecast 2026 - 2035 |
||||||
2025年全球商業回收箱市場價值15億美元,預計2035年將以5.9%的複合年成長率成長至27億美元。
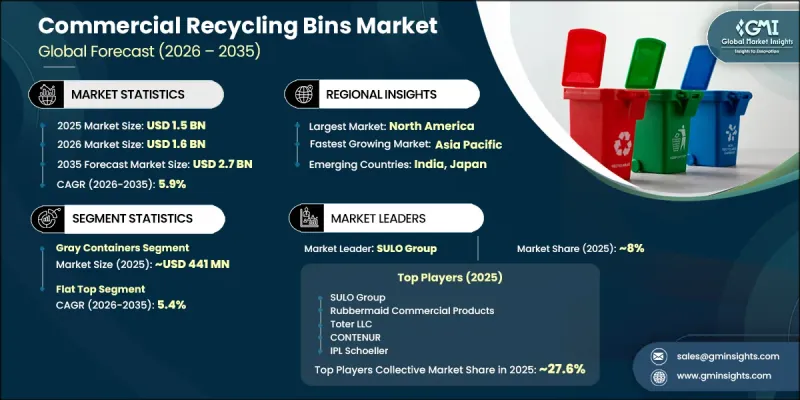
全球商業領域正在實施嚴格的環境法規和政策,這推動了市場成長。北美、歐洲和亞太地區多個經濟體的政府已推出積極的廢棄物減量和永續性目標,強制要求企業、教育機構、醫療機構和零售商店建造專用回收基礎設施。這些監管措施在多個終端產業中創造了對商用回收箱的穩定需求。循環經濟實踐和生產者延伸責任制(EPR)框架的日益普及,也推動了現有和新建設施對系統化廢棄物管理系統的廣泛投資。此外,商業房地產和公共基礎設施的快速擴張也顯著促進了市場成長。新建辦公大樓、零售設施、醫療中心和教育園區擴大將商用回收箱作為永續設施規劃的標準組成部分。房地產開發商和設施營運商優先考慮耐用且美觀的回收系統,以支援綠色建築認證和長期環境合規目標。新興市場建設活動的活性化進一步擴大了全球商用回收箱市場的成長機會。
| 市場範圍 | |
|---|---|
| 開始年份 | 2025 |
| 預測期 | 2026-2035 |
| 上市時的市場規模 | 15億美元 |
| 預計金額 | 27億美元 |
| 複合年成長率 | 5.9% |
預計到2025年,灰色垃圾桶市場規模將達到4.41億美元,並在2026年至2035年間以4.1%的複合年成長率成長。灰色回收垃圾桶因其在各類商業設施中廣泛用於收集一般廢棄物和混合可回收物,而繼續保持市場領先地位。這些垃圾桶廣泛應用於零售商店、醫療機構、辦公大樓、教育機構以及其他需要多功能廢棄物收集系統以支援標準化廢棄物分類的商業場所。與成熟商業市場中現有的廢棄物管理系統和顏色編碼廢棄物框架的兼容性,正在推動全球部署和安裝量的持續成長。
預計到2025年,平頂式回收容器市場規模將達到6.757億美元,並在2035年之前以5.4%的複合年成長率成長。平頂式回收容器以其實用的設計優勢和在商業環境中操作的便利性,持續主導商業回收容器市場。這些容器擁有高效的儲存容量,並且在設施需要靈活的廢棄物管理系統時,可以輕鬆堆疊和重新排列。其設計還支援清晰的標籤檢視、使用說明和顏色編碼識別系統,有助於提高使用者的廢棄物分類效率。商業設施對節省空間且視覺上井然有序的回收解決方案的需求不斷成長,進一步推動了對平頂式回收容器的需求。
美國商用回收箱市場預計到2025年將達到5.868億美元,並在2026年至2035年間以5.6%的複合年成長率成長。北美地區憑藉著完善的環境法規、活躍的商業建設活動以及高度發展的機構廢棄物管理基礎設施,仍然是商用回收箱最大的區域市場。美國憑藉其大規模的商業房地產市場以及眾多零售商店、公司辦公室、教育機構和公共設施(這些場所都需要標準化的回收系統),保持在該地區的領先地位。人們對永續發展措施和有組織的廢棄物收集計畫的日益重視,將繼續推動全美市場的長期成長。
目錄
第1章:調查方法和範圍
第2章執行摘要
第3章 行業洞察
- 產業生態系分析
- 供應商情況
- 利潤率
- 每個階段增加的價值
- 影響價值鏈的因素
- 影響產業的因素
- 促進因素
- 整個商業領域實行嚴格的環境法規和強制性回收政策。
- 商業地產快速成長和公共設施擴建
- 企業對永續發展和ESG報告要求的日益重視
- 潛在風險和挑戰
- 商用垃圾箱所需的耐用材料和耐候處理流程的初始成本較高。
- 各轄區之間缺乏統一的顏色編碼或廢物流標籤。
- 機會
- 配備感測器、能夠監測裝滿程度的回收再生用箱正變得越來越普遍。
- 進入正在發展廢棄物管理基礎設施的高成長新興市場。
- 促進因素
- 成長潛力分析
- 未來市場趨勢
- 技術與創新展望
- 最新科技趨勢
- 新興技術
- 監理情勢
- 標準和合規要求
- 區域監理框架
- 認證標準
- 波特的分析
- PESTLE分析
- 價格分析
- 對過去價格趨勢的分析
- 依球員類型分類的定價策略(高級球員、超值球員、成本加成球員)
- 區域價格波動
- 貿易數據分析
- 進出口量及進口額趨勢
- 主要貿易路線及關稅的影響
- 區域間貿易依存關係
- 人工智慧和生成式人工智慧對市場的影響
- 利用人工智慧改造現有經營模式
- 按細分市場分類的生成式人工智慧用例和部署藍圖
- 風險、限制和監管考量
- 生產能力和生產情況
- 設備產能:按地區和主要生產商分類
- 運轉率和擴張計劃
第4章 競爭情勢
- 介紹
- 企業市佔率分析
- 按地區
- 北美洲
- 歐洲
- 亞太地區
- 拉丁美洲
- 中東和非洲
- 按地區
- 企業矩陣分析
- 主要市場公司的競爭分析
- 競爭定位矩陣
- 主要進展
- 併購
- 夥伴關係和聯盟
- 新產品發布
- 業務拓展計劃
第5章 市場估計與預測:依類型分類,2022-2035年
- Green Containers
- Blue Containers
- Gray Containers
- 其他(棕色、黃色等)
第6章 市場估價與預測:依車型分類,2022-2035年
- Dome Top
- 平頂
- 美食榜
- 其他
第7章 市場估計與預測:依材料分類,2022-2035年
- 金屬
- 鐵和不銹鋼
- 鋁
- 塑膠
- 聚乙烯
- 聚丙烯(PP)
- 聚對苯二甲酸乙二醇酯(PET)
- 丙烯腈丁二烯苯乙烯(ABS)
- 玻璃纖維
- 其他材料(聚碳酸酯(PC)、鍍鋅鋼)
第8章 市場估算與預測:依最終用途分類,2022-2035年
- 超級市場
- 百貨公司
- 咖啡館和咖啡店
- 教育機構
- 辦公室
- 零售店
- 醫院
- 其他(便利商店、專賣店、公園等)
第9章 市場估價與預測:依通路分類,2022-2035年
- 直銷
- 間接銷售
第10章 市場估價與預測:依地區分類,2022-2035年
- 北美洲
- 美國
- 加拿大
- 歐洲
- 德國
- 英國
- 法國
- 義大利
- 西班牙
- 亞太地區
- 中國
- 日本
- 印度
- 韓國
- 澳洲
- 拉丁美洲
- 巴西
- 墨西哥
- 阿根廷
- 中東和非洲
- 沙烏地阿拉伯
- UAE
- 南非
第11章:公司簡介
- 世界頂尖公司
- Rubbermaid Commercial Products
- Bigbelly, Inc.
- Busch Systems International Inc.
- Toter LLC
- Orbis Corporation
- SULO Group
- SSI Schaefer Waste
- 該地區的領先企業
- Glasdon International Limited
- Otto Environmental Systems, Inc.
- Rehrig Pacific Company
- ESE World BV
- Molok Ltd
- CONTENUR
- Craemer Group
- 新興企業和專業公司
- Commercial Zone Products
- Carlisle FoodService Products
- Witt Industries
- Rossignol
- Cascade Engineering
- Continental Commercial Products
- IPL Schoeller
The Global Commercial Recycling Bins Market was valued at USD 1.5 billion in 2025 and is estimated to grow at a CAGR of 5.9% to reach USD 2.7 billion by 2035.
Market growth is supported by strict environmental regulations and mandatory waste segregation policies implemented across commercial sectors worldwide. Governments across North America, Europe, and several Asia Pacific economies are introducing aggressive waste diversion and sustainability targets that require businesses, educational facilities, healthcare institutions, and retail establishments to adopt dedicated recycling infrastructure. These regulatory initiatives are creating steady procurement demand for commercial recycling bins across multiple end-use industries. Expanding adoption of circular economy practices and extended producer responsibility frameworks is also encouraging broader investment in organized waste management systems across both existing and newly developed facilities. In addition, rapid expansion of commercial real estate and institutional infrastructure is contributing significantly to market growth. New office buildings, retail developments, healthcare centers, and educational campuses increasingly integrate commercial recycling bins as a standard component of sustainable facility planning. Property developers and facility operators are prioritizing durable, visually coordinated recycling systems to support green building certifications and long-term environmental compliance objectives. Rising construction activity across emerging economies is further expanding growth opportunities for the commercial recycling bins market worldwide.
| Market Scope | |
|---|---|
| Start Year | 2025 |
| Forecast Year | 2026-2035 |
| Start Value | $1.5 Billion |
| Forecast Value | $2.7 Billion |
| CAGR | 5.9% |
The gray containers segment generated USD 441 million in 2025 and is projected to grow at a CAGR of 4.1% from 2026 to 2035. Gray recycling containers continue to maintain a leading market position due to their extensive use for collecting general waste and mixed recyclable materials across a wide range of commercial facilities. These bins are widely utilized in retail stores, healthcare environments, office buildings, educational institutions, and commercial establishments where versatile waste collection systems are required to support standardized waste segregation practices. Their compatibility with established waste management systems and color-coded disposal frameworks across mature commercial markets continues to strengthen adoption and deployment volumes globally.
The flat top segment accounted for USD 675.7 million in 2025 and is expected to grow at a CAGR of 5.4% through 2035. Flat top recycling bins continue to dominate the commercial recycling bins market because of their practical design advantages and operational convenience within commercial environments. These bins offer efficient storage capabilities and can be easily stacked or repositioned when facilities require flexible waste management arrangements. Their design also supports clear labeling, instructional displays, and color-coded identification systems that help improve waste segregation efficiency among users. Growing preference for space-saving and visually organized recycling solutions across commercial properties is further supporting demand for flat top recycling bins.
U.S. Commercial Recycling Bins Market was valued at USD 586.8 million in 2025 and is anticipated to register a CAGR of 5.6% between 2026 and 2035. North America continues to represent the largest regional market for commercial recycling bins due to comprehensive environmental regulations, strong commercial construction activity, and highly developed institutional waste management infrastructure. The United States maintains a dominant position within the region because of its large commercial real estate sector and extensive presence of retail establishments, corporate offices, educational institutions, and public facilities requiring standardized recycling systems. Increasing emphasis on sustainability initiatives and organized waste collection programs continues to support long-term market growth across the country.
Major companies operating in the Global Commercial Recycling Bins Market include Rubbermaid Commercial Products, Bigbelly, Inc., Busch Systems International Inc., Toter LLC, Orbis Corporation, SULO Group, and SSI Schaefer Waste among leading global participants. Key regional companies include Glasdon International Limited, Otto Environmental Systems North America, Inc., Rehrig Pacific Company, ESE World B.V., Molok Ltd, CONTENUR, and Craemer Group. Emerging and specialized market participants include Commercial Zone Products, Carlisle FoodService Products, Witt Industries, Rossignol, Cascade Engineering, Continental Commercial Products, and IPL Schoeller. Companies operating in the Commercial Recycling Bins Market are focusing on multiple strategic initiatives to strengthen competitive positioning and expand market presence. Leading manufacturers are investing in product innovation to develop durable, aesthetically appealing, and sustainable recycling bin solutions that align with evolving environmental regulations and commercial facility requirements. Many companies are integrating smart waste management technologies, including sensor-based monitoring systems and automated collection tracking features, to improve operational efficiency and waste handling performance. Strategic partnerships with commercial property developers, municipalities, and waste management service providers are also helping businesses secure long-term contracts and expand distribution networks.
Table of Contents
Chapter 1 Methodology & Scope
- 1.1 Market scope and definition
- 1.2 Research design
- 1.2.1 Research approach
- 1.2.2 Data collection methods
- 1.3 Data mining sources
- 1.3.1 Global
- 1.3.2 Regional/Country
- 1.4 Base estimates and calculations
- 1.4.1 Base year calculation
- 1.4.2 Key trends for market estimation
- 1.5 Primary research and validation
- 1.5.1 Primary sources
- 1.6 Forecast model
- 1.7 Research assumptions and limitations
Chapter 2 Executive Summary
- 2.1 Industry 360° synopsis
- 2.2 Key market trends
- 2.2.1 Regional
- 2.2.2 Type
- 2.2.3 Model
- 2.2.4 Material
- 2.2.5 End Use
- 2.2.6 Distribution Channel
Chapter 3 Industry Insights
- 3.1 Industry ecosystem analysis
- 3.1.1 Supplier landscape
- 3.1.2 Profit margin
- 3.1.3 Value addition at each stage
- 3.1.4 Factor affecting the value chain
- 3.2 Industry impact forces
- 3.2.1 Growth drivers
- 3.2.1.1 Stringent environmental regulations and mandatory recycling policies across commercial sectors
- 3.2.1.2 Rapid growth of commercial real estate and expansion of institutional facilities
- 3.2.1.3 Rising corporate sustainability commitments and ESG reporting requirements
- 3.2.2 Pitfalls & Challenges
- 3.2.2.1 High upfront cost of durable materials and weatherproofing for commercial-grade bins
- 3.2.2.2 Lack of standardized color-coding and waste stream labeling across jurisdictions
- 3.2.3 Opportunities
- 3.2.3.1 Growing adoption of smart and sensor-enabled recycling bins with fill-level monitoring
- 3.2.3.2 Expansion into high-growth emerging markets with developing waste management infrastructure
- 3.2.1 Growth drivers
- 3.3 Growth potential analysis
- 3.4 Future market trends
- 3.5 Technology and innovation landscape
- 3.5.1 Current technological trends
- 3.5.2 Emerging technologies
- 3.6 Regulatory landscape
- 3.6.1 Standards and compliance requirements
- 3.6.2 Regional regulatory frameworks
- 3.6.3 Certification standards
- 3.7 Porter's analysis
- 3.8 PESTEL analysis
- 3.9 Pricing analysis (driven by primary research)
- 3.9.1 Historical price trend analysis (driven by primary research)
- 3.9.2 Pricing strategy by player type (premium / value / cost-plus) (driven by primary research)
- 3.9.3 Regional price variations
- 3.10 Trade data analysis (HS code for metal bins- 7323.99) (driven by paid database)
- 3.10.1 Import/export volume and value trends (driven by paid database)
- 3.10.2 Key trade corridors and tariff impact (driven by paid database)
- 3.10.3 Regional trade dependencies
- 3.11 Impact of AI and generative AI on the market
- 3.11.1 AI-driven disruption of existing business models
- 3.11.2 GenAI use cases and adoption roadmap by segment
- 3.11.3 Risks, limitations and regulatory considerations
- 3.12 Capacity and production landscape (driven by primary research)
- 3.12.1 Installed capacity by region and key producer (driven by primary research)
- 3.12.2 Capacity utilization rates and expansion pipelines (driven by primary research)
Chapter 4 Competitive Landscape, 2025
- 4.1 Introduction
- 4.2 Company market share analysis
- 4.2.1 By Region
- 4.2.1.1 North America
- 4.2.1.2 Europe
- 4.2.1.3 Asia Pacific
- 4.2.1.4 Latin America
- 4.2.1.5 Middle East & Africa
- 4.2.1 By Region
- 4.3 Company matrix analysis
- 4.4 Competitive analysis of major market players
- 4.5 Competitive positioning matrix
- 4.6 Key developments
- 4.6.1 Mergers & acquisitions
- 4.6.2 Partnerships & collaborations
- 4.6.3 New product launches
- 4.6.4 Expansion plans
Chapter 5 Market Estimates & Forecast, By Type, 2022 - 2035, (USD Billion) (Thousand Units)
- 5.1 Key trends
- 5.2 Green Containers
- 5.3 Blue Containers
- 5.4 Gray Containers
- 5.5 Others (Brown, Yellow, etc.)
Chapter 6 Market Estimates & Forecast, By Model, 2022 - 2035, (USD Billion) (Thousand Units)
- 6.1 Key trends
- 6.2 Dome Top
- 6.3 Flat Top
- 6.4 Hood Top
- 6.5 Others
Chapter 7 Market Estimates & Forecast, By Material, 2022 - 2035, (USD Billion) (Thousand Units)
- 7.1 Key trends
- 7.2 Metals
- 7.2.1 Steel & Stainless Steel
- 7.2.2 Aluminum
- 7.3 Plastics
- 7.3.1 Polyethylene
- 7.3.2 Polypropylene (PP)
- 7.3.3 Polyethylene Terephthalate (PET)
- 7.3.4 Acrylonitrile Butadiene Styrene (ABS)
- 7.3.5 Fiberglass
- 7.3.6 Others (Polycarbonate (PC), Galvanized Steel)
Chapter 8 Market Estimates & Forecast, By End Use, 2022 - 2035, (USD Billion) (Thousand Units)
- 8.1 Key trends
- 8.2 Supermarkets
- 8.3 Department Stores
- 8.4 Cafes and Coffee Shops
- 8.5 Educational Institutes
- 8.6 Offices
- 8.7 Retail Stores
- 8.8 Hospitals
- 8.9 Others (Convenience Stores, Specialty Stores, Parks, etc.)
Chapter 9 Market Estimates & Forecast, By Distribution Channel, 2022 - 2035, (USD Billion) (Thousand Units)
- 9.1 Key trends
- 9.2 Direct Sales
- 9.3 Indirect Sales
Chapter 10 Market Estimates & Forecast, By Region, 2022 - 2035, (USD Billion) (Thousand Units)
- 10.1 Key trends
- 10.2 North America
- 10.2.1 U.S.
- 10.2.2 Canada
- 10.3 Europe
- 10.3.1 Germany
- 10.3.2 UK
- 10.3.3 France
- 10.3.4 Italy
- 10.3.5 Spain
- 10.4 Asia Pacific
- 10.4.1 China
- 10.4.2 Japan
- 10.4.3 India
- 10.4.4 South Korea
- 10.4.5 Australia
- 10.5 Latin America
- 10.5.1 Brazil
- 10.5.2 Mexico
- 10.5.3 Argentina
- 10.6 MEA
- 10.6.1 Saudi Arabia
- 10.6.2 UAE
- 10.6.3 South Africa
Chapter 11 Company Profiles
- 11.1 Top Global Players
- 11.1.1 Rubbermaid Commercial Products
- 11.1.2 Bigbelly, Inc.
- 11.1.3 Busch Systems International Inc.
- 11.1.4 Toter LLC
- 11.1.5 Orbis Corporation
- 11.1.6 SULO Group
- 11.1.7 SSI Schaefer Waste
- 11.2 Regional Champions
- 11.2.1 Glasdon International Limited
- 11.2.2 Otto Environmental Systems, Inc.
- 11.2.3 Rehrig Pacific Company
- 11.2.4 ESE World B.V.
- 11.2.5 Molok Ltd
- 11.2.6 CONTENUR
- 11.2.7 Craemer Group
- 11.3 Emerging & Specialized Players
- 11.3.1 Commercial Zone Products
- 11.3.2 Carlisle FoodService Products
- 11.3.3 Witt Industries
- 11.3.4 Rossignol
- 11.3.5 Cascade Engineering
- 11.3.6 Continental Commercial Products
- 11.3.7 IPL Schoeller
 全球電子產品回收市場:市場規模、佔有率、趨勢和成長分析(2026-2034)2026-2034年全球商用回收容器市場規模、佔有率、趨勢和成長分析報告
 全球多層薄膜回收市場:市場規模、佔有率和趨勢分析(按層壓類型、最終用途和地區分類),細分市場預測(2025-2033 年)
 全球商用回收箱市場全球多材料回收市場
 耐火材料回收市場-全球產業規模、佔有率、趨勢、機會和預測(按產品、最終用戶、地區和競爭細分,2020-2030 年)耐火材料回收全球市場-按產品類型、應用、地區和預測分類的市場規模再生塑膠樹脂市場-2025年至2030年的預測