


 |
市場調查報告書
商品編碼
2065576
軟體材料清單(SBOM)管理軟體:市場佔有率分析、產業趨勢與統計、成長預測(2026-2031)Software Bill Of Materials (SBOM) Management Software - Market Share Analysis, Industry Trends & Statistics, Growth Forecasts (2026 - 2031) |
||||||

※ 本網頁內容可能與最新版本有所差異。詳細情況請與我們聯繫。
據 Mordor Intelligence 稱,軟體物料清單 (BOM) 市場在 2025 年的價值為 38 億美元,預計到 2031 年將達到 121.6 億美元,而 2026 年為 46.1 億美元,預測期(2026-2031 年)的複合年成長率為 21.4%。
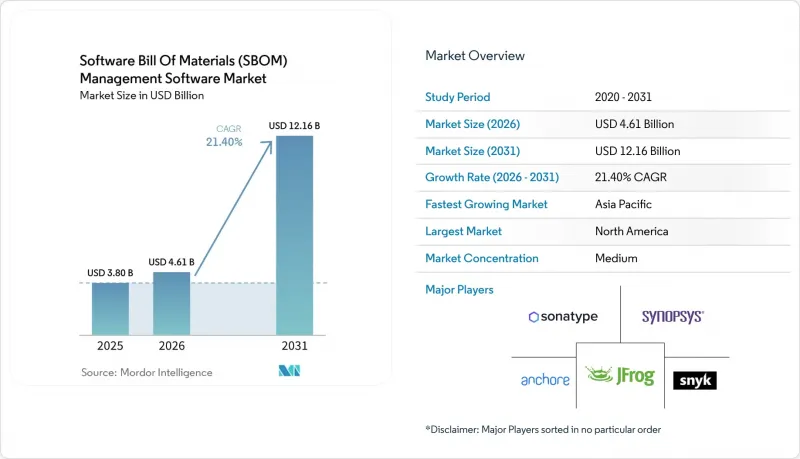
本報告按部署類型(本地部署、雲端部署、混合部署)、應用領域(醫療、汽車、國防、家用電子電器、工業及其他應用)、組織規模(大型企業、中小企業)、組件(軟體平台、服務)和地區進行細分。市場預測以美元計價。
全球軟體材料清單(SBOM) 管理軟體市場趨勢與洞察
加強對軟體供應鏈透明度的監管要求
世界各國政府已將系統工程物料清單 (SBOM) 的揭露合法化,並將其作為採購的先決條件,從而將自願性最佳實踐轉化為具有法律約束力的義務。 2025 年 1 月,美國網路安全與基礎設施安全局 (CISA) 擴大了第 14028 號行政命令的適用範圍,指示所有聯邦機構在 2026 年 9 月之前檢驗關鍵系統 SBOM 的準確性。歐盟的《網路彈性法案》將於 2024 年 12 月生效,該法案要求包含數位元素的產品製造商從 2026 年 9 月起創建機器可讀的 SBOM,並且這項義務已擴展到帶有嵌入式韌體的硬體。同時,美國食品藥物管理局(FDA) 的法規將醫療設備核准與 SBOM 提交截止日期掛鉤,進一步強化了透明度。因此,跨國供應商正在投資開發能夠匯出為多種格式並自動將策略對應到特定區域模式的平台,而監管的複雜性也推動了對相關工具的投資。
針對開放原始碼元件的網路安全威脅日益加劇。
隨著攻擊者將惡意庫注入公共程式碼庫並利用隱藏在遺留依賴項中的未修補漏洞,供應鏈攻擊激增。根據 Sonatype 的記錄,2024 年上傳的惡意軟體包超過 24.5 萬個,年增 156%,凸顯了機會型入侵的規模之大。到 2026 年初,美國「已知利用漏洞」目錄將超過 1200 個漏洞,其中越來越多的漏洞與商業產品中未修補的開放原始碼模組相關。 2026 年 3 月,針對開放原始碼SBOM 生成器 Trivy 的攻擊試驗表明,就連安全工具本身也成為了攻擊目標。企業越來越依賴 SBOM,將其視為快速識別風險、縮短平均修復時間以及在零日漏洞出現時限制攻擊橫向傳播的唯一有效手段。
SBOM格式和交換協定缺乏標準化
由於 SPDX 和 CycloneDX 並存且各自沿著不同的藍圖發展,企業被迫要麼使用並行的工具鏈,要麼依賴不可逆的轉換工具。美國國家通訊與資訊管理局 (NTIA) 批准了這兩種方案,但未能製定單一標準,無意中加劇了這種碎片化局面。工業和消費領域的小規模供應商難以獲得適配器開發資金,這減緩了整個生態系統的互通性,並使預期成長率下降了 3.4 個百分點。
細分市場分析
隨著嚴格監管的產業尋求在雲端的敏捷性與嚴格的資料主權法規之間取得平衡,混合環境預計到2031年將以17.2%的複合年成長率成長。儘管雲端服務在2025年佔總收入的57.7%,但處理敏感資訊、病患資訊或財務資料的組織正擴大轉向工作負載分離,將原始SBOM檔案保留在本地,僅將分析處理傳送到雲端。美國食品藥物管理局(FDA)2025年的指導意見加速了醫療設備製造商採用這種雙架構,以在滿足資訊揭露義務的同時保護專有韌體細節。
採用混合模式的公司報告稱,與純本地部署環境的用戶相比,ISO 27001 和 SOC 2 審計的證據收集週期縮短了 30%,這充分證明了混合模式的顯著優勢。隨著雲端平台將 SBOM 整合功能整合到容器註冊表和漏洞掃描器中,本地元件的角色正日益從單純的分析引擎轉變為安全隔離區。預計這種結構性轉變將使混合設計在 2020 年代後期成為軟體材料清單(SBOM) 市場的標準,從而推動對跨私有資料中心和超大規模雲端的整合式儀表板生態系統的需求成長。
預計國防領域的軟體負載將以18.6%的複合年成長率(CAGR)成為所有應用領域中成長最快的。這項成長主要源自於美國國防部強制要求將軟體材料清單(SBOM)檢驗納入網路安全成熟度模型認證(CMMC)2.0的評估體系。此要求規定承包商必須持續提交證明文件,以確保符合嚴格的網路安全標準。這項轉變也推動了自動化技術在傳統瀑布式開發流程的應用,而傳統瀑布式開發流程在採用此類技術方面一直較為緩慢。對即時檢驗和報告的需求預計將推動SBOM工具的創新,使國防承包商能夠在滿足監管要求的同時簡化工作流程。
預計醫療產業將繼續保持其在銷售額方面的領先地位,到2025年將佔據24.2%的市場佔有率,但由於監管主要針對新型醫療設備的申請,其成長預計將較為溫和。隨著組件透明度在聯合國WP.29法規和工業安全標準中變得日益重要,汽車和工業設備製造商正在加速採用軟體物料清單(SBOM)。這些跨產業的壓力進一步強化了SBOM在實體安全風險管理中的重要性,並擴大了軟體材料清單市場的潛在總需求。
區域分析
預計到2025年,北美將佔全球銷售額的37.2%,這主要得益於聯邦採購指示以及醫療技術和SaaS供應商的高度集中。 2025年1月發布的CISA指令和美國食品藥物管理局(FDA)第524B條指南提高了資訊揭露的預期,使SBOM的創建從「最佳實踐」轉變為「市場准入的強制性要求」。加拿大供應商在跨境供應鏈中尋求生存的努力與美國供應商展現出類似的勢頭,而墨西哥的SBOM應用則集中在汽車和航太產業的出口中心。
在歐洲,隨著《網路韌性法案》將合規期限提前至2026年9月,市場呈現強勁成長動能。德國的技術指南TR-03183-2為關鍵基礎設施營運商提供了藍圖,其影響力波及整個歐盟。脫歐後的英國正與歐盟保持密切合作,以維持其進入單一市場的權利,凸顯了該地區的統一方向。整合韌體的硬體製造商與純軟體發行商一樣,都必須遵守相同的透明度規則,從而擴大了歐洲軟體材料清單(SBOM)市場的潛在基本客群。
亞太地區預計將以16.4%的複合年成長率成長,成為全球成長最快的地區,這主要得益於中國的「多層保護機制2.0」、日本資訊科技振興院(IPA)的指導方針以及印度CERT-In的建議。國內主權政策正在推動中國對本地託管工具和資料居住保障的需求。日本主要汽車製造商正在遵守WP.29出口義務,將SBOM工作流程整合到供應鏈合約中,並將這些要求擴展到零件供應商。同時,儘管中東、非洲和南美洲的正式法規實施緩慢,但跨國公司正在推出自己的標準,為能源、電信和銀行業軟體材料清單(SBOM)市場奠定了初步基礎。
其他好處:
- Excel格式的市場預測(ME)表
- 3個月的分析師支持
目錄
第1章:引言
- 研究假設和市場定義
- 調查範圍
第2章:調查方法
第3章執行摘要
第4章 市場狀況
- 市場概覽
- 市場促進因素
- 加強對軟體供應鏈透明度的監管要求
- 針對開放原始碼元件的網路安全威脅日益加劇。
- 在整個企業範圍內推廣DevSecOps實踐
- SBOM平台與CI/CD管道整合方面的進展。
- SBOM 工具中人工智慧驅動的漏洞優先排序功能的出現。
- 將軟體配置分析擴展到物聯網韌體SBOM
- 市場限制因素
- SBOM格式與交換協定之間缺乏標準化
- 中小企業意識水準低
- 對 SBOM 資訊揭露可能導致知識產權洩露的擔憂。
- 與傳統應用安全工具整合不足。
- 產業價值與價值鏈分析
- 監理情勢
- 技術展望
- 宏觀經濟因素對市場的影響
- 波特五力分析
第5章 市場規模與成長預測
- 部署模式
- 現場
- 基於雲端的
- 混合
- 透過使用
- 衛生保健
- 車
- 防禦
- 家用電子產品
- 產業
- 其他用途
- 按組織規模
- 大公司
- 小型企業
- 按組件
- 軟體平台
- 服務
- 按地區
- 北美洲
- 美國
- 加拿大
- 墨西哥
- 其他北美國家
- 南美洲
- 巴西
- 阿根廷
- 智利
- 其他南美國家
- 歐洲
- 德國
- 英國
- 法國
- 義大利
- 西班牙
- 俄羅斯
- 其他歐洲國家
- 亞太地區
- 中國
- 日本
- 印度
- 韓國
- 其他亞太國家
- 中東
- 沙烏地阿拉伯
- 阿拉伯聯合大公國
- 其他中東國家
- 非洲
- 南非
- 其他非洲國家
- 北美洲
第6章 競爭情勢
- 市場集中度
- 策略趨勢
- 市佔率分析
- 公司簡介
- Anchore Inc.
- Sonatype Inc.
- Synopsys Inc.
- Flexera Software LLC
- Snyk Limited
- Mend.io Ltd.
- FOSSA Inc.
- JFrog Ltd.
- Veracode Inc.
- Checkmarx Ltd.
- Rezilion Inc.
- Phylum LLC
- GrammaTech Inc.
- Cybeats Technologies Corp.
- Deepfence Inc.
- Oxeye Security Ltd.
- Legit Security Ltd.
- Aqua Security Software Ltd.
- Chainguard Inc.
- Stacklok Inc.
第7章 市場機會與未來展望
According to Mordor Intelligence, the software bill of Materials market size was valued at USD 3.8 billion in 2025 and estimated to grow from USD 4.61 billion in 2026 to reach USD 12.16 billion by 2031, at a CAGR of 21.4% during the forecast period (2026-2031).
This report is Segmented by Deployment Mode (On-Premise, Cloud-Based, Hybrid), Application (Healthcare, Automotive, Defense, Consumer Electronics, Industrial, Other Applications), Organization Size (Large Enterprises, Small and Medium Enterprises), Component (Software Platform, Services), and Geography. The Market Forecasts are Provided in Terms of Value (USD).
Global Software Bill Of Materials (SBOM) Management Software Market Trends and Insights
Growing Regulatory Mandates for Software Supply Chain Transparency
Governments worldwide codified SBOM disclosure as a purchasing prerequisite, transforming a voluntary best practice into an enforceable obligation. In January 2025, the United States Cybersecurity and Infrastructure Security Agency directed all federal bodies to verify SBOM accuracy for critical systems by September 2026, extending Executive Order 14028's reach.The European Union's Cyber Resilience Act, effective December 2024, compels manufacturers of products with digital elements to produce machine-readable SBOMs starting September 2026, widening the obligation to hardware with embedded firmware. Parallel rules from the United States Food and Drug Administration now bind medical-device approval to SBOM submission timelines, further institutionalizing transparency. Multinational vendors are therefore investing in platforms that export multiple formats and map policies automatically to divergent regional schemas, converting regulatory complexity into a catalyst for tooling spend.
Escalating Cybersecurity Threats Targeting Open-Source Components
Supply-chain attacks rose sharply as adversaries seeded malicious libraries into public repositories and exploited dormant flaws in legacy dependencies. Sonatype logged more than 245,000 rogue packages uploaded in 2024, up 156% year on year, underscoring the scale of opportunistic infiltration. The United States Known Exploited Vulnerabilities catalog topped 1,200 entries by early 2026, with a growing share linked to unpatched open-source modules inside commercial products. A March 2026 breach attempt on Trivy, an open-source SBOM generator, demonstrated that even security tooling itself is now a target.Organizations increasingly view SBOMs as the only practical way to pinpoint exposure quickly when zero-days emerge, compressing mean time to remediation and limiting lateral attack movement.
Lack of Standardization Across SBOM Formats and Exchange Protocols
The coexistence of SPDX and CycloneDX, each advancing on separate roadmaps, forces enterprises to juggle parallel toolchains or resort to lossy conversion utilities. The United States National Telecommunications and Information Administration recognized both schemas but stopped short of naming a single canonical standard, inadvertently entrenching fragmentation. Small vendors in industrial and consumer sectors struggle to fund adapters, delaying ecosystem-wide interoperability and shaving 3.4 percentage points from forecast growth.
Other drivers and restraints analyzed in the detailed report include:
- Rising Adoption of DevSecOps Practices Across Enterprises
- Increasing Integration of SBOM Platforms with CI/CD Pipelines
- Limited Awareness Among Small and Medium Enterprises
For complete list of drivers and restraints, kindly check the Table Of Contents.
Segment Analysis
Hybrid setups are on track to expand at a 17.2% CAGR through 2031 as highly regulated verticals reconcile cloud agility with strict data-sovereignty rules. While cloud services commanded 57.7% revenue in 2025, organizations handling classified, patient, or financial data increasingly split workloads, keeping raw SBOM files on-premise and sending analytics to the cloud. The Food and Drug Administration's 2025 guidance spurred medical-device makers to adopt such dual architectures, safeguarding proprietary firmware details while satisfying disclosure mandates.
Enterprises adopting hybrid models reported 30% shorter evidence-collection cycles for ISO 27001 and SOC 2 audits compared with pure on-premise users, underscoring a practical payoff. As cloud platforms embed SBOM hooks into container registries and vulnerability scanners, on-premise components increasingly act as secure enclaves rather than analytic engines. This structural shift positions hybrid designs as the default for the Software Bill of Materials market by late decade, fostering ecosystem demand for unified dashboards that span private data centers and hyperscale clouds.
Defense workloads are projected to register an 18.6% CAGR, the highest among all applications. This growth is primarily driven by the Department of Defense's mandate to incorporate Software Bill of Materials (SBOM) verification into Cybersecurity Maturity Model Certification (CMMC) 2.0 assessments. The requirement compels contractors to provide continuous attestations, ensuring compliance with stringent cybersecurity standards. This shift is pushing automation into traditionally waterfall development processes, which have historically been slower to adopt such technologies. The demand for real-time verification and reporting is expected to drive innovation in SBOM tools, enabling defense contractors to streamline their workflows while meeting regulatory requirements.
Healthcare remains the revenue leader thanks to a 24.2% share in 2025, yet its growth moderates because mandates apply chiefly to new device submissions. Automotive and industrial manufacturers are moving up the adoption curve as United Nations WP.29 rules and industrial safety norms increasingly reference component transparency. These cross-sector pressures reinforce the centrality of SBOMs to physical-safety risk management, broadening total addressable demand for the Software Bill of Materials market.
Geography Analysis
North America accounted for 37.2% of 2025 revenue, anchored by federal procurement mandates and a dense concentration of medical-technology and SaaS vendors. The January 2025 CISA directive and the Food and Drug Administration's Section 524B guidance jointly heighten disclosure expectations, turning SBOM creation into a go-to-market necessity rather than a best practice. Canadian suppliers mirror the United States momentum to remain viable in cross-border supply chains, while Mexico's adoption clusters around automotive and aerospace export hubs.
Europe follows with robust growth as the Cyber Resilience Act pushes compliance deadlines toward September 2026. Germany's technical guideline TR-03183-2 serves as a blueprint for critical-infrastructure operators and ripples outward to the wider European Union. Post-Brexit, the United Kingdom keeps tight alignment to preserve single-market access, underlining the region's unified trajectory. Hardware makers embedding firmware now fall under the same transparency rules as pure software publishers, broadening the European Software Bill of Materials market addressable base.
Asia-Pacific is forecast to rise at a 16.4% CAGR, the fastest globally, thanks to China's Multi-Level Protection Scheme 2.0, Japan's Information-technology Promotion Agency guidelines, and India's CERT-In advisories. Domestic sovereignty policies drive Chinese demand for locally hosted tools and data-residency guarantees. Japan's automotive giants, responding to WP.29 export obligations, embed SBOM workflows into supply-chain contracts, radiating requirements to component suppliers. While Middle East and Africa plus South America lag in formal mandates, multinational operators import their own standards, seeding initial footprints for the Software Bill of Materials market across energy, telecom, and banking sectors.
- Anchore Inc.
- Sonatype Inc.
- Synopsys Inc.
- Flexera Software LLC
- Snyk Limited
- Mend.io Ltd.
- FOSSA Inc.
- JFrog Ltd.
- Veracode Inc.
- Checkmarx Ltd.
- Rezilion Inc.
- Phylum LLC
- GrammaTech Inc.
- Cybeats Technologies Corp.
- Deepfence Inc.
- Oxeye Security Ltd.
- Legit Security Ltd.
- Aqua Security Software Ltd.
- Chainguard Inc.
- Stacklok Inc.
Additional Benefits:
- The market estimate (ME) sheet in Excel format
- 3 months of analyst support
TABLE OF CONTENTS
1 INTRODUCTION
- 1.1 Study Assumptions and Market Definition
- 1.2 Scope of the Study
2 RESEARCH METHODOLOGY
3 EXECUTIVE SUMMARY
4 MARKET LANDSCAPE
- 4.1 Market Overview
- 4.2 Market Drivers
- 4.2.1 Growing Regulatory Mandates for Software Supply Chain Transparency
- 4.2.2 Escalating Cybersecurity Threats Targeting Open-Source Components
- 4.2.3 Rising Adoption of DevSecOps Practices Across Enterprises
- 4.2.4 Increasing Integration of SBOM Platforms with CI/CD Pipelines
- 4.2.5 Emergence of AI-Powered Vulnerability Prioritization in SBOM Tools
- 4.2.6 Expansion of Software Composition Analysis into IoT Firmware SBOM
- 4.3 Market Restraints
- 4.3.1 Lack of Standardization Across SBOM Formats and Exchange Protocols
- 4.3.2 Limited Awareness Among Small and Medium Enterprises
- 4.3.3 Concerns Over Intellectual Property Exposure in SBOM Disclosure
- 4.3.4 Inadequate Integration with Legacy Application Security Tools
- 4.4 Industry Value and Supply-Chain Analysis
- 4.5 Regulatory Landscape
- 4.6 Technological Outlook
- 4.7 Impact of Macroeconomic Factors on the Market
- 4.8 Porter's Five Forces Analysis
- 4.8.1 Threat of New Entrants
- 4.8.2 Bargaining Power of Suppliers
- 4.8.3 Bargaining Power of Buyers
- 4.8.4 Threat of Substitute Products
- 4.8.5 Intensity of Competitive Rivalry
5 MARKET SIZE AND GROWTH FORECASTS (VALUE)
- 5.1 By Deployment Mode
- 5.1.1 On-Premise
- 5.1.2 Cloud-Based
- 5.1.3 Hybrid
- 5.2 By Application
- 5.2.1 Healthcare
- 5.2.2 Automotive
- 5.2.3 Defense
- 5.2.4 Consumer Electronics
- 5.2.5 Industrial
- 5.2.6 Other Applications
- 5.3 By Organization Size
- 5.3.1 Large Enterprises
- 5.3.2 Small and Medium Enterprises
- 5.4 By Component
- 5.4.1 Software Platform
- 5.4.2 Services
- 5.5 By Geography
- 5.5.1 North America
- 5.5.1.1 United States
- 5.5.1.2 Canada
- 5.5.1.3 Mexico
- 5.5.1.4 Rest of North America
- 5.5.2 South America
- 5.5.2.1 Brazil
- 5.5.2.2 Argentina
- 5.5.2.3 Chile
- 5.5.2.4 Rest of South America
- 5.5.3 Europe
- 5.5.3.1 Germany
- 5.5.3.2 United Kingdom
- 5.5.3.3 France
- 5.5.3.4 Italy
- 5.5.3.5 Spain
- 5.5.3.6 Russia
- 5.5.3.7 Rest of Europe
- 5.5.4 Asia-Pacific
- 5.5.4.1 China
- 5.5.4.2 Japan
- 5.5.4.3 India
- 5.5.4.4 South Korea
- 5.5.4.5 Rest of Asia-Pacific
- 5.5.5 Middle East
- 5.5.5.1 Saudi Arabia
- 5.5.5.2 United Arab Emirates
- 5.5.5.3 Rest of Middle East
- 5.5.6 Africa
- 5.5.6.1 South Africa
- 5.5.6.2 Rest of Africa
- 5.5.1 North America
6 COMPETITIVE LANDSCAPE
- 6.1 Market Concentration
- 6.2 Strategic Moves
- 6.3 Market Share Analysis
- 6.4 Company Profiles (includes Global Level Overview, Market Level Overview, Core Segments, Financials as available, Strategic Information, Market Rank/Share, Products and Services, Recent Developments)
- 6.4.1 Anchore Inc.
- 6.4.2 Sonatype Inc.
- 6.4.3 Synopsys Inc.
- 6.4.4 Flexera Software LLC
- 6.4.5 Snyk Limited
- 6.4.6 Mend.io Ltd.
- 6.4.7 FOSSA Inc.
- 6.4.8 JFrog Ltd.
- 6.4.9 Veracode Inc.
- 6.4.10 Checkmarx Ltd.
- 6.4.11 Rezilion Inc.
- 6.4.12 Phylum LLC
- 6.4.13 GrammaTech Inc.
- 6.4.14 Cybeats Technologies Corp.
- 6.4.15 Deepfence Inc.
- 6.4.16 Oxeye Security Ltd.
- 6.4.17 Legit Security Ltd.
- 6.4.18 Aqua Security Software Ltd.
- 6.4.19 Chainguard Inc.
- 6.4.20 Stacklok Inc.
7 MARKET OPPORTUNITIES AND FUTURE OUTLOOK
- 7.1 White-space and Unmet-Need Assessment

 DevSecOps全球市場規模、佔有率、趨勢和成長分析報告(2026-2034年)
 DevSecOps:市場佔有率分析、產業趨勢與統計、成長預測(2026-2031)
 DevSecOps 市場:按產品/服務、類型、部署模式、組織規模和產業分類-2026-2032 年全球市場預測
 DevSecOps 市場預測 2034 – 按組件、部署模式、組織規模、安全類型、開發階段、工具類型、最終用戶和地區分類的全球分析
 DevSecOps 市場:按組件、部署、最終用途和區域分類
 2026年全球DevSecOps市場報告
 全球DevSecOps市場:按組件、組織規模、服務、部署方法、最終用途、國家和地區分類-產業分析、市場規模、佔有率和未來預測(2025-2032)全球DevSecOps市場:市場規模、佔有率、成長率、產業分析、依類型、應用和地區劃分的分析以及未來預測(2026-2034)
 DevSecOps市場規模、佔有率和成長分析(按組件、服務、部署類型、組織規模、垂直產業和地區分類)-2026-2033年產業預測全球 DevSecOps 市場規模(按組件、部署、組織、最終用戶產業、區域範圍和預測)