

 |
市場調查報告書
商品編碼
2065482
美國中程配送:市場佔有率分析、產業趨勢與統計及成長預測(2026-2031 年)United States Middle Mile Delivery - Market Share Analysis, Industry Trends & Statistics, Growth Forecasts (2026 - 2031) |
||||||
※ 本網頁內容可能與最新版本有所差異。詳細情況請與我們聯繫。
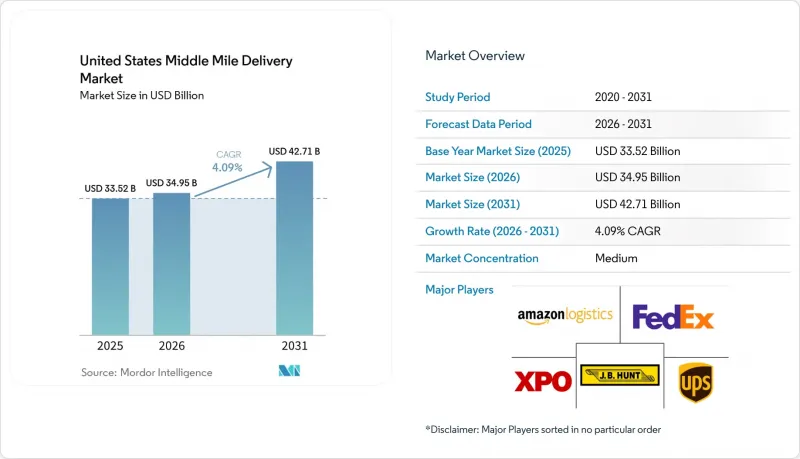
美國中檔配送市場預計到 2025 年將達到 335.2 億美元,到 2026 年將達到 349.5 億美元,到 2031 年將達到 427.1 億美元,2026 年至 2031 年的複合年成長率為 4.09%。
本報告按運輸方式(公路、鐵路等)、經營模式(B2B、B2C、C2C)、溫度區域(常溫、溫控)、目的地(國內、國際)、最終用戶(電子商務、時尚等)和地區(東北、東南等)進行細分。市場規模和預測均以美元計價。
美國中程配送市場的趨勢與洞察
美國二線都會大都會圈電子商務訂單總表
預計2025年,美國電子商務銷售額將達到1.2337兆美元,佔零售總額的16.4%。這凸顯了線上需求在龐大的基數基礎上持續成長。二線大都會圈線上訂單的成長,使得哥倫布、印地安那波里斯和聖安東尼奧等城市的訂單密度越來越接近樞紐間專用穿梭車道所需的水平。一旦超過此閾值,長途運輸的貨物將不再需要等待提貨,從而提高拖車周轉率,並使中程運輸的班次安排更加可預測。這種轉變將為承運商帶來新的收入來源,並使他們能夠在零擔運輸(LTL)和整車穿梭運輸之間靈活切換,而無需過度增加固定運輸能力。這些路線位於大規模履約中心和區域配送網路之間,重點在於規律的運輸頻率,而非盡可能長的長途運輸距離,這使其對美國中程配送市場具有顯著優勢。
人工智慧驅動的動態長途運輸路線規劃平台正在擴展到零擔運輸網路
在美國中程運輸市場,人工智慧主導的幹線運輸規劃正從試點階段邁向常規網路運作。 2026年1月,CH Robinson宣布其人工智慧代理商已自動完成95%的零擔貨運漏收檢查,每天節省超過350小時的人工時間,減少42%的不必要往返,並幫助部分貨物提前一天送達。這些工具可幫助承運商更有效率地裝載拖車,減少空駛里程,並加強高流量路線的取貨管理。對於缺乏強巨量資料資產和先進軟體的中小型企業而言,競爭格局也在發生變化,因為在動態路線規劃逐漸成為標準配置的路線上,其獲利能力正在下降。隨著這項技術的普及,價值的衡量標準正從單純的實體規模轉向承運商可以即時利用的路線數據品質、運輸歷史記錄和執行回饋。
A級駕駛員短缺問題日益嚴重,導致招募成本上升。
對於美國中程運輸市場而言,司機招聘仍然是短期阻礙因素。對於仍依賴A級駕駛員的夜間和長途區域線路而言,這一趨勢尤其明顯,而A級駕駛員的招募仍然十分困難。不斷上漲的招聘成本和長期離職率使得承運商難以擴大運力以滿足需求,即便貨運量足以支持開闢新線路。此外,培訓和合規要求延長了新司機全面運作所需的時間,限制了承運商在旺季快速回應的能力。在此背景下,能夠在較短時間內提供更可預測班次的承運商在中程線路上更具優勢,因為中程線路的司機留存率高於長途線路。因此,如今的勞動力市場服務穩定性高度依賴司機的可用性以及實際的運輸網路覆蓋範圍。
細分市場分析
到2025年,道路運輸將占美國中程配送市場佔有率的65.81%,憑藉其能夠以同一種基本資產覆蓋人口密集和稀疏的路線,繼續保持其在樞紐間運輸中的中心地位。這種主導地位也反映了電子商務網路依賴靈活的調度、頻繁的轉運以及履約中心、交叉轉運站和區域分類中心之間的直接通道。聯邦政府資助的高速公路改善工程進一步提升了道路運輸在某些走廊的經濟效益,這些走廊先前因交通堵塞、交通堵塞和立交橋延誤而降低了拖車的利用率。對於大多數營運商而言,當運輸時間快速變化或需要在同一天內在多個區域樞紐之間重新安排貨物運輸路線時,公路貨運仍然是首選。
預計2026年至2031年間,航空運輸的複合年成長率將達到6.91%,在所有運輸方式中成長最快。這反映了醫藥和高價值電子產品物流對速度的需求。鐵路運輸在整體運輸市場中所佔佔有率仍然較小,但在服務品質至關重要的線路上,鐵路運輸正日益受到關注,其可靠性的提升能夠縮小與公路運輸服務的差距。 2025年11月,Schneider電機推出了「快速通道」(Fast Track)服務,這是一項高階多式聯運服務。據該公司稱,該服務在美墨主要線路上的準時交付率超過95%,與傳統的公路運輸相比,運輸時間最多可縮短兩天。雖然海運在港口門戶和沿海地區的短途運輸中仍然發揮著重要作用,但與公路和航空運輸相比,其在美國中程運輸市場中的作用有限,尤其是在平衡日常運輸網路方面。
預計到2025年,B2C將占美國中程配送市場的71.5%,凸顯了線上零售對履約中心與區域配送樞紐之間貨運的持續顯著影響。該領域受益於其廣泛的產品線,涵蓋服裝、電子產品、家居用品和消費品補貨,從而在全年產生穩定的區域運輸。其規模也支援高密度短途運輸,並可在節日和促銷高峰期快速調整運力。 B2C需求分佈在眾多始發地和目的地之間,為承運商提供了廣泛的貨源,也為規劃專用路線提供了依據。
預計從2026年到2031年,C2C業務的複合年成長率將達到6.08%,在經營模式中成長最高。這是因為轉售平台和個人對個人(C2C)交易正在產生更多輕型叢集,這些小包裹仍需在中程運輸環節進行整合。雖然單次貨運量小規模,但當平台貨運量整合為穩定的區域運輸時,其吸引力便會顯現。 B2B業務仍是美國中程運輸市場的重要穩定因素。這是因為來自製造商和供應商的貨運節奏可預測,即使面向消費者的貨運量波動,也能為資產規劃提供支撐。 B2C業務的規模、C2C業務的成長以及B2B業務的穩定性共同迫使營運商設計出既能處理穩定的合約路線,又能應對平台主導的波動貨運的網路,同時避免增加空駛里程。
其他好處:
- Excel格式的市場預測(ME)表
- 3個月的分析師支持
目錄
第1章:引言
- 研究假設和市場定義
- 調查範圍
第2章:調查方法
第3章執行摘要
第4章 市場狀況
- 市場概覽
- 市場促進因素
- 美國二線都會大都會圈電子商務訂單總表
- 擴展人工智慧驅動的動態幹線路由設定平台在零擔網路中的應用
- 根據《基礎設施投資和就業法》為貨運走廊提供資金
- 分散式微型倉配中心縮短了區域補貨週期。
- 在 I-10 和 I-35 上部署由 OEM主導的自動駕駛中程卡車示範計畫。
- 鐵路公司推出高級特快聯運服務(適用於600英里以下的路線)
- 市場限制因素
- A級駕駛嚴重短缺,導致招募成本上升。
- 州際公路休息站卡車停車位長期短缺
- 2021年壅塞後港口及鐵路貨場停留時間的變化
- 溫控交叉轉運網的資本密集度
- 法律規範
- 價值鍊和通路分析
- 技術創新前景
- 波特五力模型
- 深入了解倉庫和物流中心
- 關於冷藏中程配送的注意事項。
- 地緣政治事件對供應鏈轉型的影響
第5章 市場規模及成長預測(價值,2026-2031 年)
- 透過運輸方式
- 路
- 鐵路
- 航空
- 海上運輸
- 按經營模式
- 企業對企業 (B2B) 交易
- Business-to-Consumer(B2C)
- 個人對個人(C2C)交易
- 按類型進行溫度控制
- 無溫度控制
- 溫控型
- 按地區
- 家庭使用
- 國際的
- 按最終用戶行業分類
- 電子商務零售
- 時尚與生活風格
- 美容、健康和個人護理
- 住宅和家具
- 家用電子電器和家用電器
- 醫療保健和醫療用品
- 其他
- 按地區
- 東北
- 東南
- 中西部
- 西南
- 西方
第6章 競爭情勢
- 市場集中度
- 關鍵策略趨勢
- 市佔率分析
- 公司簡介
- United Parcel Service(UPS)
- FedEx
- Amazon Logistics
- XPO
- JB Hunt Transport Services
- Schneider National
- Knight-Swift Transportation
- Old Dominion Freight Line
- CH Robinson Worldwide
- ArcBest Corporation
- Hub Group
- Ryder System
- Lineage Logistics
- DSV
- Penske Logistics
- Werner Enterprises
- Estes Express Lines
- Saia
- GXO Logistics
- GEODIS
- Kuehne+Nagel
- TFI International
第7章 市場機會與未來展望
According to Mordor Intelligence, the united states middle mile delivery market size is projected to be USD 33.52 billion in 2025, USD 34.95 billion in 2026, and reach USD 42.71 billion by 2031, growing at a CAGR of 4.09% from 2026 to 2031.
This report is Segmented by Transportation Mode (Roadways, Railways, and More), by Business Model (B2B, B2C, and C2C), by Temperature, (Non-Temperature and Temperature Controlled), by Destination, (domestic and International), by End User (E-Commerce, Fashion, and More), and by Region (Northeast, Southeast, and More). The Market Size and Forecasts are Provided in Terms of Value (USD).
United States Middle Mile Delivery Market Trends and Insights
E-Commerce Order Densification Across Tier-2 US Metros
United States e-commerce sales reached USD 1,233.7 billion in 2025, accounting for 16.4% of total retail sales, confirming that online demand is still expanding from a very large base. Rising online volumes in tier-2 metros are pushing cities such as Columbus, Indianapolis, and San Antonio toward the order density needed to support dedicated shuttle lanes between hub nodes. Once that threshold is crossed, freight no longer needs to wait for longer-haul consolidation, improving trailer turns and supporting more predictable middle-mile schedules. That change opens new revenue streams for carriers, allowing them to flex between LTL and full-shuttle loads without overbuilding fixed capacity. The United States middle-mile delivery market benefits because these lanes sit between large fulfillment assets and local delivery networks, where recurring frequency matters more than maximum line-haul distance.
AI-Driven Dynamic Line-Haul Routing Platforms Scaling in LTL Networks
AI-led line-haul planning is moving from testing into daily network operations across the United States middle-mile delivery market. In January 2026, C.H. Robinson said its AI agents automated 95% of LTL missed-pickup checks, saved more than 350 manual hours each day, reduced unnecessary return trips by 42%, and helped some freight move up to 1 day faster. These tools help carriers fill trailers more effectively, cut empty miles, and tighten pickup discipline across dense corridors. They also change the competitive landscape, as smaller operators without strong data assets or software depth face weaker margins on lanes where dynamic routing is becoming standard. As this capability spreads, value is shifting away from pure physical scale and toward the quality of lane data, shipment history, and execution feedback that carriers can apply in real time.
Acute Class-A Driver Shortages Escalating Recruitment Costs
Driver availability remains a near-term restraint for the United States middle-mile delivery market, especially on overnight and longer regional lanes that still rely on hard-to-fill Class-A roles. Rising recruitment expense and persistent turnover make it harder for carriers to scale capacity in step with demand, even when freight volumes support new routes. Training and compliance requirements also lengthen the time required to bring new drivers into regular service, limiting how quickly operators can respond during peak periods. This pressure favors carriers that can offer shorter, more predictable middle-mile schedules, as those routes better meet retention needs than long-haul operations. The result is a labor market in which service consistency depends as much on driver access as on physical network coverage.
Other drivers and restraints analyzed in the detailed report include:
- Infrastructure Investment and Jobs Act Funding for Freight Corridors
- OEM-Led Roll-Out of Autonomous Middle-Mile Truck Pilots on I-10 & I-35
- Chronic Truck-Parking Deficit at Interstate Rest Areas
For complete list of drivers and restraints, kindly check the Table Of Contents.
Segment Analysis
Roadways held 65.81% of the United States middle-mile delivery market share in 2025, keeping them at the center of inter-hub operations because they can serve both dense and thin routes with the same base asset class. Their lead also reflects how e-commerce networks depend on flexible dispatch, frequent reloads, and direct access between fulfillment centers, cross-docks, and local sort points. Highway upgrades supported by federal funding further strengthen road mode economics on corridors where dwell, congestion, and interchange delays had reduced trailer productivity. For most operators, road freight remains the default choice when shipment timing changes quickly or when freight needs to be redirected across multiple regional nodes on the same day.
Airways are projected to grow at a 6.91% CAGR through 2026-2031, the fastest pace among transportation modes, reflecting the need for speed in pharmaceutical and high-value electronics flows. Railways remain a smaller part of the mix, but they are gaining attention on service-sensitive lanes where improved reliability can narrow the gap with truckload service. In November 2025, Schneider launched Fast Track. This premium intermodal, the company said, delivered 95% or better on-time performance and transit times up to 2 days faster than truckload alternatives on key US-Mexico routes. Maritime links still matter around port gateways and for short coastal moves, but in the United States middle-mile delivery market, they play a more limited role than road and air in day-to-day network balancing.
B2C accounted for 71.5% of the United States middle-mile delivery market in 2025, underscoring how online retail continues to shape freight movements between fulfillment sites and local delivery nodes. This segment benefits from a broad product base across apparel, electronics, home goods, and household replenishment, which creates recurring regional volumes throughout the year. Its scale also supports dense shuttle operations that can be reset quickly during holiday peaks or promotional periods. Because B2C demand is spread across many origin-destination pairs, it provides carriers with a broad load base that helps justify dedicated corridor planning.
C2C is forecast to grow at a 6.08% CAGR through 2026-2031, the fastest among business models, as resale platforms and peer-to-peer commerce generate more lightweight parcel clusters that still need middle-mile consolidation. These flows are smaller at the shipment level, but they become attractive once platform volumes are grouped into consistent regional movements. B2B remains an important stabilizer for the US middle-mile delivery market because manufacturer and supplier freight provides a predictable cadence that supports asset planning even when consumer volumes fluctuate. The mix of B2C scale, C2C growth, and B2B stability is pushing operators to design networks that can handle both steady contract lanes and variable platform-driven loads without raising empty mileage.
List of Companies Covered in this Report:
- United Parcel Service (UPS)
- FedEx
- Amazon Logistics
- XPO
- J.B. Hunt Transport Services
- Schneider National
- Knight-Swift Transportation
- Old Dominion Freight Line
- C.H. Robinson Worldwide
- ArcBest Corporation
- Hub Group
- Ryder System
- Lineage Logistics
- DSV
- Penske Logistics
- Werner Enterprises
- Estes Express Lines
- Saia
- GXO Logistics
- GEODIS
- Kuehne + Nagel
- TFI International
Additional Benefits:
- The market estimate (ME) sheet in Excel format
- 3 months of analyst support
TABLE OF CONTENTS
1 Introduction
- 1.1 Study Assumptions & Market Definition
- 1.2 Scope of the Study
2 Research Methodology
3 Executive Summary
4 Market Landscape
- 4.1 Market Overview
- 4.2 Market Drivers
- 4.2.1 E-Commerce Order Densification Across Tier-2 US Metros
- 4.2.2 AI-Driven Dynamic Line-Haul Routing Platforms Scaling in LTL Networks
- 4.2.3 Infrastructure Investment and Jobs Act Funding for Freight Corridors
- 4.2.4 Decentralized Micro-Fulfillment Hubs Shortening Regional Replenishment Loops
- 4.2.5 OEM-Led Roll-Out of Autonomous Middle-Mile Truck Pilots on I-10 & I-35
- 4.2.6 Railroads Launching Premium Expedited Intermodal Services (Less than 600-Mile Lanes)
- 4.3 Market Restraints
- 4.3.1 Acute Class-A Driver Shortages Escalating Recruitment Costs
- 4.3.2 Chronic Truck-Parking Deficit at Interstate Rest Areas
- 4.3.3 Port and Rail Yard Dwell-Time Volatility Post-2021 Congestion
- 4.3.4 Capital Intensity of Temperature-Controlled Cross-Dock Networks
- 4.4 Regulatory Framework
- 4.5 Value Chain and Distribution Channel Analysis
- 4.6 Technology Innovations Outlook
- 4.7 Porter's Five Forces
- 4.7.1 Threat of New Entrants
- 4.7.2 Bargaining Power of Suppliers
- 4.7.3 Bargaining Power of Buyers
- 4.7.4 Threat of Substitutes
- 4.7.5 Rivalry Among Competitors
- 4.8 Insights on Warehousing & Distribution Centers
- 4.9 Insights on Refrigerated Middle-Mile Delivery
- 4.10 Impact of Geo-Political Events on Supply Chain Shifts
5 Market Size & Growth Forecasts (Value, 2026-2031)
- 5.1 By Transportation Mode
- 5.1.1 Roadways
- 5.1.2 Railways
- 5.1.3 Airways
- 5.1.4 Maritime
- 5.2 By Business Model
- 5.2.1 Business-to-Business (B2B)
- 5.2.2 Business-to-Consumer (B2C)
- 5.2.3 Customer-to-Consumer (C2C)
- 5.3 By Temperature Control
- 5.3.1 Non-Temperature Controlled
- 5.3.2 Temperature Controlled
- 5.4 By Destination
- 5.4.1 Domestics
- 5.4.2 International
- 5.5 By End User Industry
- 5.5.1 E-commerce Retail
- 5.5.2 Fashion and Lifestyle
- 5.5.3 Beauty, Wellness and Personal Care
- 5.5.4 Home and Furniture
- 5.5.5 Consumer Electronics and Appliances
- 5.5.6 Healthcare and Medical Supplies
- 5.5.7 Others
- 5.6 By Region
- 5.6.1 Northeast
- 5.6.2 Southeast
- 5.6.3 Midwest
- 5.6.4 Southwest
- 5.6.5 West
6 Competitive Landscape
- 6.1 Market Concentration
- 6.2 Key Strategic Moves
- 6.3 Market Share Analysis
- 6.4 Company Profiles (includes Global level Overview, Market level overview, Core Segments, Financials as available, Strategic Information, Market Rank/Share for key companies, Products & Services, and Recent Developments)
- 6.4.1 United Parcel Service (UPS)
- 6.4.2 FedEx
- 6.4.3 Amazon Logistics
- 6.4.4 XPO
- 6.4.5 J.B. Hunt Transport Services
- 6.4.6 Schneider National
- 6.4.7 Knight-Swift Transportation
- 6.4.8 Old Dominion Freight Line
- 6.4.9 C.H. Robinson Worldwide
- 6.4.10 ArcBest Corporation
- 6.4.11 Hub Group
- 6.4.12 Ryder System
- 6.4.13 Lineage Logistics
- 6.4.14 DSV
- 6.4.15 Penske Logistics
- 6.4.16 Werner Enterprises
- 6.4.17 Estes Express Lines
- 6.4.18 Saia
- 6.4.19 GXO Logistics
- 6.4.20 GEODIS
- 6.4.21 Kuehne + Nagel
- 6.4.22 TFI International
7 Market Opportunities & Future Outlook
- 7.1 White-space & Unmet-Need Assessment
 數位航運市場規模、佔有率和成長分析:按解決方案、部署基礎設施、供應鏈功能、最終用戶產業和地區分類-2026-2033年產業預測
 裝卸整平機市場規模、佔有率和成長分析:按操作方式、核心材料成分、最終用途產業、分銷管道和地區分類-2026-2033年產業預測
 全球物流市場:市場規模、佔有率、趨勢和成長分析(2026-2034)
 2026年全球智慧物流市場報告
 智慧物流自動化市場預測至2034年—全球解決方案、運輸方式、組件、技術、應用、最終用戶和區域分析
 資料中心物流市場規模、佔有率和趨勢分析報告:按設備類型、資料中心規模、服務、最終用途、地區和細分市場預測(2026-2033 年)
 航運和海事資訊通訊技術:市場佔有率分析、行業趨勢和統計數據、成長預測(2026-2031 年)
 2026-2030年全球物流市場亞太地區政府和教育物流:市場佔有率分析、行業趨勢和統計數據以及成長預測(2026-2031 年)按需物流:市場佔有率分析、產業趨勢與統計、成長預測(2026-2031)