


 |
市場調查報告書
商品編碼
2064437
無線顯示器:市場佔有率分析、產業趨勢與統計、成長預測(2026-2031)Wireless Display - Market Share Analysis, Industry Trends & Statistics, Growth Forecasts (2026 - 2031) |
||||||
※ 本網頁內容可能與最新版本有所差異。詳細情況請與我們聯繫。
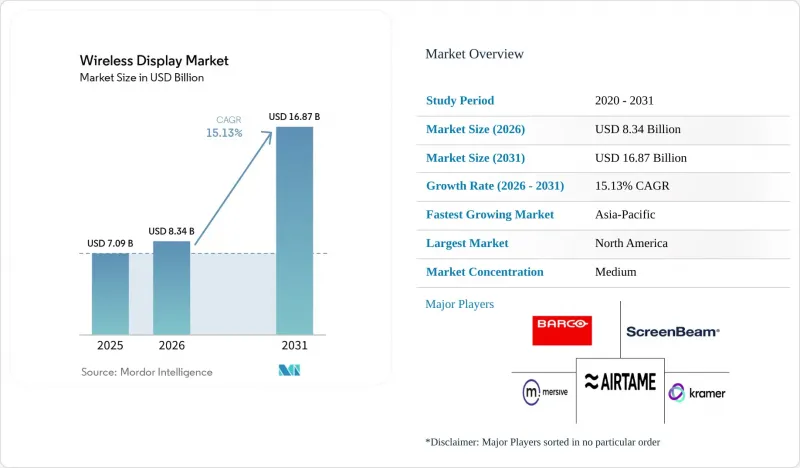
據 Mordor Intelligence 稱,2025 年無線顯示市場價值為 70.9 億美元,預計到 2031 年將達到 168.7 億美元,而 2026 年為 83.4 億美元,預測期(2026-2031 年)的複合年成長率為 15.13%。
本報告按交付類型(硬體、軟體和服務)、技術協議(AirPlay、Miracast、Google Cast、無線HDMI和無線高清等)、最終用戶(住宅、商業)、應用領域(消費者娛樂和串流媒體、企業演示和協作、教育和培訓等)以及地區進行細分。市場預測以美元(USD)為單位。
全球無線顯示市場趨勢與洞察
混合辦公和自備設備辦公(BYOD)的普及正在重塑企業無線基礎設施。
混合辦公模式的普及使得會議室需要支援眾多個人設備而非固定電腦,這進一步推動了無線顯示市場融入企業工作流程。思科於2025年11月在30個市場進行的一項調查發現,55%的無線網路領導者認為自備設備辦公室(BYOD)和用戶移動性是推動企業更依賴無線網路的關鍵因素。調查也顯示,80%的企業在調查前五年增加了無線基礎設施的支出,顯示這種需求與長期網路投資相關,而非短期會議室升級。因此,由於設備種類繁多,相容性問題日益嚴重,企業願意為支援AirPlay、Miracast和Google Cast等多種技術的會議室系統支付更高的價格。此外,隨著設備管理、分析和訂閱式支援服務逐漸成為企業採購的標配,這種轉變也推動了軟體和服務收入的成長。
透過 Wi-Fi 6E 和基礎設施升級消除延遲限制。
隨著 Wi-Fi 6E 在美國提供對 1200 MHz 免許可 6 GHz頻寬的接入,並且其支援範圍在主要國家和地區持續擴大,無線顯示市場正受益於網路基地台更新周期的延長。思科報告稱,到 2025 年下半年,其管理網路中 Wi-Fi 6E 和 Wi-Fi 7網路基地台的部署量將同比成長 23%,這表明企業轉型已在相當規模上展開。此外,思科還報告稱,到 2025 年,其 500 萬個管理網路中 6 GHz 用戶端的激活量將同比成長 60%,這表明終端設備對高級投影應用場景的準備程度有所提高。傳統的 5 GHz 部署在人口密集的教室和辦公環境中常常面臨挑戰,而 6 GHz 的容量則改善了跨多個來源進行高解析度共用的環境。每 3-4 年升級網路基地台的公司可能會在 2026 年至 2029 年期間,隨著網路遷移的進行,購買無線演示設備,這將支援預測期內的設備需求。
協議分割使企業採購決策變得複雜。
無線顯示市場仍面臨嚴重的互通性問題,因為AirPlay、Miracast、Google Cast和各種專有協定無法在混合裝置環境下提供一致的體驗。買家被迫在為相容多重通訊協定的硬體支付高價和接受相容性缺陷之間做出選擇,而相容性缺陷會給共用空間的用戶帶來不便。在嚴格監管的環境中,這個問題尤其突出,因為安全設計的重要性已經與簡單的螢幕共用不相上下。雲端安全聯盟 (Cloud Security Alliance) 於2026年3月發布的研究報告指出,WPA2和WPA3網路都存在一個Wi-Fi客戶端隔離漏洞。這個漏洞源自於IEEE 802.11標準本身,這意味著僅靠廠商的修補程式無法完全消除風險。協議複雜性和安全審查同時出現,導致採購核准週期延長,一些組織正在推遲更新決策,直到建立更好的兼容性為止。
細分市場分析
至2025年,硬體將佔無線顯示市場規模的54.32%。這得益於其大規模的部署基礎,包括適配器、整合演示系統以及廣泛應用於家庭和商業場所的嵌入式模組。這種主導地位仍反映出無線顯示產業對實體會議室硬體和顯示器終端的大量投資。由於許多買家仍然需要專用接收器、智慧會議室設備或整合顯示模組來支援多用戶之間的可靠投屏,因此該細分市場仍然佔據重要地位。同時,硬體需求組成正在發生變化,企業買家越來越傾向於選擇整合會議室控制、裝置連接和雲端管理功能的捆綁系統,而不是單一功能的適配器。
軟體和服務預計將在2026年至2031年間以15.53%的複合年成長率成長,成為無線顯示市場中成長最快的細分領域。這一成長與基於訂閱的螢幕共用、裝置管理和分析平台密切相關,這些平台可協助企業管理其裝置組合的使用策略和效能。 2025年12月,Airtame發表了搭載Wi-Fi 6E晶片組的Airtame 3。其授權模式為:核心功能每年每台設備120美元,完整混合會議功能每年每台設備300美元,顯示持續收入已融入產品組合中。託管服務也具有成長空間,因為負責部署多供應商環境和零信任整合的IT團隊可能更傾向於尋求外部支持,以進行韌體管理、安全措施和持續營運管理。
截至2025年,AirPlay佔據了無線顯示市場32.56%的佔有率。這主要歸功於蘋果設備成熟的原生生態系統,該生態系統已在iPhone、iPad和MacBook用戶中實現了螢幕鏡像功能。如此龐大的用戶群體使得AirPlay在蘋果終端普及的住宅和商業環境中佔據了主導地位。另一方面,Miracast在商業環境中保持了其地位,因為基於Windows的設備在企業、教育機構和公共部門仍然佔據重要地位。無線HDMI和WirelessHD繼續滿足那些優先考慮吞吐量而非廣泛協議柔軟性的特定需求,而隨著傳統設備的淘汰,Intel WiDi的重要性則持續下降。
預計從2026年到2031年,Google Cast的複合年成長率將達到16.33%,成為無線顯示市場成長最快的協議套件。這一成長勢頭主要得益於其與Android和Chrome OS的深度整合,以及在Google認證電視和會議室硬體中日益廣泛的應用。因此,買家正逐漸從將會議室與單一設備生態系統綁定,轉向支援從單一終端傳輸多種協定的軟體定義接收器。這一趨勢至關重要,因為買家越來越需要廣泛的兼容性、策略控制和更簡單的部署,而不是特定協議的會議室硬體。
區域分析
預計到2025年,北美將成為最大的區域市場,佔據無線顯示市場34.58%的佔有率。該地區受益於成熟的企業無線基礎設施、教育領域強勁的設備更新周期以及眾多平台供應商和解決方案整合商的存在。到了2025年,商用筆記型電腦中USB-C介面的廣泛應用消除會議室無線工作流程的實際障礙,使大規模無線演示更容易實現。教育領域的FERPA法規和醫療保健領域的HIPAA法規等合規性要求也促使企業更傾向於選擇企業級系統而非消費級產品,因為政策管理和安全是機構採購的關鍵考慮因素。 2026年1月,Crestron推出了Collab Compute,進一步強化了這個趨勢。 Collab Compute是一款協作硬體核心,配備整合NPU的英特爾酷睿Ultra處理器,可用於人工智慧輔助的會議室部署。
預計亞太地區2026年至2031年將以16.04%的複合年成長率成長,成為無線顯示市場成長最快的地區。推動市場需求成長的因素包括中國和印度智慧教室的普及、新建企業園區的建設以及亞太主要市場6GHz頻段授權的快速推進。這一區域趨勢與北美有所不同,因為在北美,新的教育和公共機構計畫將無線會議室連接作為預設標準,而不是取代傳統的有線系統。韓國、日本和澳洲也受惠於Wi-Fi 6E的廣泛監管過渡,這使得網路基地台升級與無線演示設備的採購更加便捷。
歐洲無線顯示市場已趨於成熟,但仍在不斷發展,其中英國和德國是企業需求的主要中心。歐盟頻段的協調統一縮小了與北美在Wi-Fi 6E部署方面的差距,並改善了下一代投屏基礎設施的開發環境。總部位於比利時的巴可公司報告稱,其2024年的銷售額將達到9.47億歐元(約合10.2465億美元),並於2025年6月在微軟設備生態系統平台上發布了ClickShare Hub,進一步鞏固了其在該地區的地位。中東和非洲的貢獻仍然最低,但正受益於阿拉伯聯合大公國和沙烏地阿拉伯的智慧建築專案。同時,南美洲仍處於起步階段,但隨著房地產投資的趨於穩定,巴西和阿根廷在商業應用方面處於領先地位。
其他好處
- Excel格式的市場預測(ME)表
- 3個月的分析師支持
目錄
第1章:引言
- 研究假設和市場定義
- 調查範圍
第2章:調查方法
第3章執行摘要
第4章 市場狀況
- 市場概覽
- 市場促進因素
- 建立混合辦公和自備設備辦公室(BYOD)協作模式
- 智慧電視、互動式平面電視和連網投影機的普及率不斷提高。
- 透過 Wi-Fi 6、Wi-Fi 6E 和 5G 升級,提高了低延遲傳輸效能。
- 教室和會議室數位化項目
- 筆記型電腦向 USB-C 介面的普及正在加速人們對無線室內工作流程的需求。
- 安全認證的原生投影螢幕和訪客網路分段正在成為採購中的差異化因素。
- 市場限制因素
- AirPlay、Miracast、Google Cast 和專有協定中的協定分段。
- 在高頻寬使用場景下,HDMI 和 USB-C 連接線的可靠性仍然優於無線連接。
- 智慧電視的原生投影機功能降低了一般家庭對額外獨立接收器的需求。
- 企業射頻 (RF) 擁塞和零信任網路計畫正在延長引進週期。
- 宏觀經濟因素對市場的影響
- 產業價值鏈分析
- 監理情勢
- 技術展望
- 波特五力分析
第5章 市場規模與成長預測
- 按規定表格
- 硬體
- 無線顯示適配器和加密狗
- 整合無線演示系統
- 智慧電視和互動式平板顯示器中的嵌入式無線顯示器
- 軟體和服務
- 螢幕鏡像和投影軟體
- 設備管理和分析軟體
- 硬體
- 根據技術規程
- 專業及管理服務
- AirPlay
- Miracast
- Google Cast
- 無線HDMI和無線高清
- Intel WiDi 傳統版安裝數量
- 其他技術協議
- 最終用戶
- 住宅
- 商業設施
- 透過使用
- 消費者娛樂與串流媒體
- 企業展示和協作
- 教育和培訓
- 醫療保健領域的可視化和協作
- 數位電子看板和公共訊息
- 政府/國防
- 工業和控制室應用的可視化
- 按地區
- 北美洲
- 美國
- 加拿大
- 墨西哥
- 南美洲
- 巴西
- 阿根廷
- 其他南美國家
- 歐洲
- 英國
- 德國
- 西班牙
- 法國
- 義大利
- 其他歐洲國家
- 亞太地區
- 中國
- 日本
- 印度
- 韓國
- 其他亞太國家
- 中東和非洲
- 中東
- 阿拉伯聯合大公國
- 沙烏地阿拉伯
- 其他中東國家
- 非洲
- 南非
- 埃及
- 其他非洲地區
- 中東
- 北美洲
第6章 競爭情勢
- 市場集中度
- 策略趨勢
- 市佔率分析
- 公司簡介
- Barco NV
- Airtame ApS
- ScreenBeam Inc.
- Mersive Technologies, Inc.
- Kramer Electronics Ltd.
- WolfVision GmbH
- Kindermann GmbH
- Crestron Electronics, Inc.
- RGB Systems, Inc. dba Extron Electronics
- TEKVOX, Inc.
- SMART Technologies ULC
- Promethean Limited
- Legamaster International BV
- Squirrels LLC
- Splashtop Inc.
- DisplayNote Technologies Limited
- Avocor Technologies
- Yealink Network Technology Co., Ltd.
- Vivitek Corporation
- Newline Interactive Inc.
第7章 市場機會與未來展望
According to Mordor Intelligence, the wireless display market size was valued at USD 7.09 billion in 2025 and estimated to grow from USD 8.34 billion in 2026 to reach USD 16.87 billion by 2031, at a CAGR of 15.13% during the forecast period (2026-2031).
This report is Segmented by Offering (Hardware, and Software and Services), Technology Protocol (AirPlay, Miracast, Google Cast, Wireless HDMI and Wireless HD, and More), End-User (Residential, and Commercial), Application (Consumer Entertainment and Streaming, Enterprise Presentation and Collaboration, Education and Training, and More), and Geography. The Market Forecasts are Provided in Terms of Value (USD).
Global Wireless Display Market Trends and Insights
Hybrid Work and BYOD Adoption Reshaping Enterprise Wireless Infrastructure
Permanent hybrid work arrangements have pushed the wireless display market deeper into enterprise workflows, as meeting rooms now need to support many personal devices rather than a fixed room computer. Cisco reported that 55% of wireless leaders cited BYOD and user mobility as the main drivers of rising dependence on wireless networks in its November 2025 survey across 30 markets. The same study found that 80% of organizations increased wireless infrastructure spending over the five years before the survey, indicating that this demand is tied to long-term network investment rather than short-term room upgrades. Enterprises are therefore accepting higher unit costs for systems that can support AirPlay, Miracast, and Google Cast in a single room because mixed device fleets create a real compatibility problem. This change is also shifting revenue toward software and services because device management, analytics, and subscription support are becoming part of the standard enterprise purchase.
Wi-Fi 6E And Infrastructure Upgrades Removing The Latency Ceiling
The wireless display market is benefiting from a broader access point refresh cycle, as Wi-Fi 6E provides access to 1,200 MHz of unlicensed 6 GHz spectrum in the United States and has since gained support across several major countries and regions. Cisco recorded a 23% year-over-year increase in Wi-Fi 6E and Wi-Fi 7 access point deployments across its managed networks in the second half of 2025, indicating that enterprise migration is already underway at a meaningful scale. It also reported a 60% year-over-year increase in 6 GHz clients activated across 5 million managed networks in 2025, indicating stronger endpoint readiness for advanced casting use cases. Earlier 5 GHz deployments often struggled in dense classrooms and office environments, but 6 GHz capacity improves conditions for multi-source, high-resolution sharing. Enterprises that refresh access points on three-to-four-year cycles are likely to align wireless presentation purchases with this network transition between 2026 and 2029, which supports unit demand during the forecast window.
Protocol Fragmentation Complicating Enterprise Procurement Decisions
The wireless display market still faces a real interoperability problem because AirPlay, Miracast, Google Cast, and proprietary stacks do not deliver a consistent experience across mixed device fleets. Buyers can either pay a higher price for multi-protocol hardware or accept compatibility gaps that frustrate users in shared rooms. This issue becomes harder in regulated environments because security design now matters as much as simple screen sharing. A March 2026 research note from the Cloud Security Alliance identified vulnerabilities in Wi-Fi client isolation that affect both WPA2 and WPA3 networks and stem from the IEEE 802.11 standard itself, meaning vendor patching alone does not fully eliminate the risk. When protocol complexity and security reviews occur simultaneously, procurement approval cycles lengthen, and some organizations delay refresh decisions until better alignment emerges.
Other drivers and restraints analyzed in the detailed report include:
- Smart TV and Interactive Flat Panel Expansion Creating Embedded Display Demand
- Classroom and Meeting Room Digitalization Programs Sustaining Structural Demand
- Wired Connectivity Retaining a Performance Advantage in Bandwidth-Intensive Applications
For complete list of drivers and restraints, kindly check the Table Of Contents.
Segment Analysis
Hardware retained 54.32% of the wireless display market size in 2025, supported by the large installed base of adapters, integrated presentation systems, and embedded modules across homes and commercial venues. That lead still reflects how much prior spending in the wireless display industry went into physical room hardware and display endpoints. The segment remains important because many buyers still need dedicated receivers, smart meeting room devices, or display-integrated modules to support reliable casting across multiple users. At the same time, the composition of hardware demand is changing as enterprise buyers prefer bundled systems that combine room control, device connectivity, and cloud administration instead of single-function dongles.
Software and services are projected to grow at a 15.53% CAGR from 2026 to 2031, making it the fastest-growing segment of the wireless display market. This growth is tied to subscription-based screen-sharing, device-management, and analytics platforms that help enterprises manage usage policies and fleet performance. Airtame introduced Airtame 3 in December 2025 with a Wi-Fi 6E chipset and a licensing model priced at USD 120 per device per year for core features and USD 300 per device per year for full hybrid conferencing, demonstrating how recurring revenue is built into the product stack. Managed services also have room to expand, as IT teams handling multi-vendor deployments and zero-trust integration may prefer external support for firmware management, security policy, and ongoing administration.
AirPlay held 32.56% share of the wireless display market in 2025 because Apple devices already route screen mirroring through a mature native ecosystem across iPhone, iPad, and MacBook users. That installed base gave AirPlay an advantage in both residential use and business settings where Apple endpoints are common. Miracast still keeps a place in commercial environments because Windows-based fleets remain important across enterprise, education, and public institutions. Wireless HDMI and WirelessHD continue to serve narrower needs where throughput matters more than broad protocol flexibility, while Intel WiDi keeps losing relevance as legacy endpoints cycle out of use.
Google Cast is forecast to grow at a 16.33% CAGR from 2026 to 2031, which makes it the fastest-growing protocol group in the wireless display market. Its momentum comes from deep integration across Android and Chrome OS, as well as wider availability on Google-certified TVs and meeting room hardware. These conditions are pushing buyers toward software-defined receivers that support multiple protocols from a single endpoint, rather than forcing a room to rely on a single device ecosystem. That direction matters because buyers increasingly want broad compatibility, policy control, and simpler deployment instead of protocol-specific room hardware.
Geography Analysis
North America held 34.58% of the wireless display market share in 2025, making it the largest regional market. The region benefited from mature enterprise wireless infrastructure, active device refresh cycles in education, and the presence of many platform vendors and solution integrators. USB-C adoption across commercial notebooks removed a practical barrier to cable-free room workflows by 2025, which made wireless presentation easier to support at scale. Compliance rules such as FERPA in education and HIPAA in healthcare also favored enterprise-grade systems over consumer-grade products, as policy control and security were key considerations in institutional buying. Crestron reinforced this direction in January 2026, when it introduced Collab Compute, a collaboration hardware core built on an Intel Core Ultra processor with an integrated NPU for AI-assisted meeting room deployments.
Asia-Pacific is projected to grow at a 16.04% CAGR from 2026 to 2031, making it the fastest-growing region in the wireless display market. Demand is being supported by smart classroom rollouts in China and India, new corporate campus construction, and the rapid pace of 6 GHz authorization across major APAC markets. This regional pattern differs from North America because greenfield education and institutional projects can adopt wireless room connectivity as the default standard instead of replacing legacy wired systems. South Korea, Japan, and Australia also benefit from the wider regulatory shift toward Wi-Fi 6E, which helps align access point upgrades with wireless presentation purchases.
Europe remains a mature yet continually refreshing wireless display market, with the United Kingdom and Germany as key centers of enterprise demand. The EU's spectrum harmonization reduced the timing gap with North America for Wi-Fi 6E deployment, which improved the conditions for next-generation casting infrastructure. Barco, headquartered in Belgium, reported EUR 947 million in sales in 2024, equivalent to USD 1,024.65 million, and strengthened its regional position in June 2025 with the launch of ClickShare Hub on Microsoft's Device Ecosystem Platform. The Middle East and Africa remain the smallest contributors but are benefiting from smart building programs in the UAE and Saudi Arabia, while South America is still at an early stage, with Brazil and Argentina leading commercial adoption as real estate investment stabilizes.
- Barco NV
- Airtame ApS
- ScreenBeam Inc.
- Mersive Technologies, Inc.
- Kramer Electronics Ltd.
- WolfVision GmbH
- Kindermann GmbH
- Crestron Electronics, Inc.
- RGB Systems, Inc. dba Extron Electronics
- TEKVOX, Inc.
- SMART Technologies ULC
- Promethean Limited
- Legamaster International B.V.
- Squirrels LLC
- Splashtop Inc.
- DisplayNote Technologies Limited
- Avocor Technologies
- Yealink Network Technology Co., Ltd.
- Vivitek Corporation
- Newline Interactive Inc.
Additional Benefits:
- The market estimate (ME) sheet in Excel format
- 3 months of analyst support
TABLE OF CONTENTS
1 INTRODUCTION
- 1.1 Study Assumptions and Market Definition
- 1.2 Scope of the Study
2 RESEARCH METHODOLOGY
3 EXECUTIVE SUMMARY
4 MARKET LANDSCAPE
- 4.1 Market Overview
- 4.2 Market Drivers
- 4.2.1 Hybrid Work and BYOD Collaboration Normalization
- 4.2.2 Rising Installed Base of Smart TVs, Interactive Flat Panels, and Connected Projectors
- 4.2.3 Wi-Fi 6, Wi-Fi 6E, and 5G Upgrades Improving Low-Latency Casting
- 4.2.4 Classroom and Meeting Room Digitalization Programs
- 4.2.5 USB-C Laptop Transition Accelerating Demand for Cable-Free Room Workflows
- 4.2.6 Security-Certified Native Casting and Guest Network Segmentation Becoming Procurement Differentiators
- 4.3 Market Restraints
- 4.3.1 Protocol Fragmentation Across AirPlay, Miracast, Google Cast, and Proprietary Stacks
- 4.3.2 HDMI and USB-C Cable Reliability Still Outperform Wireless in High-Bandwidth Use Cases
- 4.3.3 Smart TV Native Casting Reducing Incremental Demand for Standalone Receivers in Consumer Settings
- 4.3.4 Enterprise RF Congestion and Zero-Trust Network Policies Extending Deployment Cycles
- 4.4 Impact of Macroeconomic Factors on the Market
- 4.5 Industry Value Chain Analysis
- 4.6 Regulatory Landscape
- 4.7 Technological Outlook
- 4.8 Porter's Five Forces Analysis
- 4.8.1 Bargaining Power of Suppliers
- 4.8.2 Bargaining Power of Buyers
- 4.8.3 Threat of New Entrants
- 4.8.4 Threat of Substitutes
- 4.8.5 Intensity of Competitive Rivalry
5 MARKET SIZE AND GROWTH FORECASTS (VALUE)
- 5.1 By Offering
- 5.1.1 Hardware
- 5.1.1.1 Wireless Display Adapters and Dongles
- 5.1.1.2 Integrated Wireless Presentation Systems
- 5.1.1.3 Embedded Wireless Display in Smart TVs and Interactive Flat Panels
- 5.1.2 Software and Services
- 5.1.2.1 Screen Mirroring and Casting Software
- 5.1.2.2 Device Management and Analytics Software
- 5.1.1 Hardware
- 5.2 By Technology Protocol
- 5.2.1 Professional and Managed Services
- 5.2.2 AirPlay
- 5.2.3 Miracast
- 5.2.4 Google Cast
- 5.2.5 Wireless HDMI and WirelessHD
- 5.2.6 Intel WiDi Legacy Installed Base
- 5.2.7 Other Technology Protocols
- 5.3 By End-User
- 5.3.1 Residential
- 5.3.2 Commercial
- 5.4 By Application
- 5.4.1 Consumer Entertainment and Streaming
- 5.4.2 Enterprise Presentation and Collaboration
- 5.4.3 Education and Training
- 5.4.4 Healthcare Visualization and Collaboration
- 5.4.5 Digital Signage and Public Information
- 5.4.6 Government and Defense
- 5.4.7 Industrial and Control Room Visualization
- 5.5 By Geography
- 5.5.1 North America
- 5.5.1.1 United States
- 5.5.1.2 Canada
- 5.5.1.3 Mexico
- 5.5.2 South America
- 5.5.2.1 Brazil
- 5.5.2.2 Argentina
- 5.5.2.3 Rest of South America
- 5.5.3 Europe
- 5.5.3.1 United Kingdom
- 5.5.3.2 Germany
- 5.5.3.3 France
- 5.5.3.4 Italy
- 5.5.3.5 Rest of Europe
- 5.5.4 Asia-Pacific
- 5.5.4.1 China
- 5.5.4.2 Japan
- 5.5.4.3 India
- 5.5.4.4 Spain
- 5.5.4.5 South Korea
- 5.5.4.6 Rest of Asia-Pacific
- 5.5.5 Middle East and Africa
- 5.5.5.1 Middle East
- 5.5.5.1.1 United Arab Emirates
- 5.5.5.1.2 Saudi Arabia
- 5.5.5.1.3 Rest of Middle East
- 5.5.5.2 Africa
- 5.5.5.2.1 South Africa
- 5.5.5.2.2 Egypt
- 5.5.5.2.3 Rest of Africa
- 5.5.5.1 Middle East
- 5.5.1 North America
6 COMPETITIVE LANDSCAPE
- 6.1 Market Concentration
- 6.2 Strategic Moves
- 6.3 Market Share Analysis
- 6.4 Company Profiles (includes Global Level Overview, Market Level Overview, Core Segments, Financials as available, Strategic Information, Market Rank/Share, Products and Services, Recent Developments)
- 6.4.1 Barco NV
- 6.4.2 Airtame ApS
- 6.4.3 ScreenBeam Inc.
- 6.4.4 Mersive Technologies, Inc.
- 6.4.5 Kramer Electronics Ltd.
- 6.4.6 WolfVision GmbH
- 6.4.7 Kindermann GmbH
- 6.4.8 Crestron Electronics, Inc.
- 6.4.9 RGB Systems, Inc. dba Extron Electronics
- 6.4.10 TEKVOX, Inc.
- 6.4.11 SMART Technologies ULC
- 6.4.12 Promethean Limited
- 6.4.13 Legamaster International B.V.
- 6.4.14 Squirrels LLC
- 6.4.15 Splashtop Inc.
- 6.4.16 DisplayNote Technologies Limited
- 6.4.17 Avocor Technologies
- 6.4.18 Yealink Network Technology Co., Ltd.
- 6.4.19 Vivitek Corporation
- 6.4.20 Newline Interactive Inc.
7 MARKET OPPORTUNITIES AND FUTURE OUTLOOK
- 7.1 White-Space and Unmet-Need Assessment
 無線顯示市場:按組件、連接方式、應用、顯示技術和最終用戶分類-2026-2032年全球市場預測
 全球無線顯示市場規模、佔有率、趨勢和成長分析報告(2026-2034年)
 2026年全球無線顯示市場報告
 無線顯示市場規模、佔有率及成長分析(按組件、技術、最終用戶和地區分類)-2026-2033年產業預測
 無線顯示市場-全球產業規模、佔有率、趨勢、機會和預測,依技術類型、顯示類型、最終用戶、地區和競爭格局分類,2020-2030年預測
 無線顯示市場機會、成長動力、產業趨勢分析及 2025 - 2034 年預測
 全球無線顯示市場:市場規模、市場佔有率、趨勢分析(按內容、應用、技術和地區)、展望和未來預測(2024-2031 年)
 無線顯示市場規模、佔有率和趨勢分析報告:按產品、按技術、按最終用途、按地區、細分市場預測,2024-2030 年無線顯示器市場:各技術,各用途,各提供,各地區,2024年~2031年