

 |
市場調查報告書
商品編碼
1833444
無線顯示市場機會、成長動力、產業趨勢分析及 2025 - 2034 年預測Wireless Display Market Opportunity, Growth Drivers, Industry Trend Analysis, and Forecast 2025 - 2034 |
||||||
2024 年全球無線顯示市場價值為 60.3 億美元,預計到 2034 年將以 12.7% 的複合年成長率成長至 198.6 億美元。
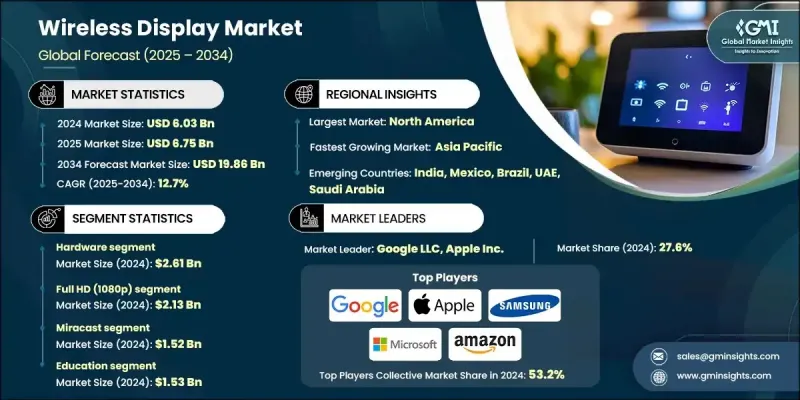
這一成長軌蹟的促進因素包括智慧型手機和智慧電視的日益普及、BYOD趨勢和混合工作環境的廣泛實施、線上教育模式的快速擴展以及無線顯示器在消費和專業領域的日益普及。 Wi-Fi 6/6E和5G技術的持續進步正在增強無線連接,使螢幕投影和裝置互通性更快、更可靠。智慧家庭和工作場所向無線通訊的轉變凸顯了對無縫高清內容共享日益成長的需求。無線顯示解決方案支援即時協作和內容分發,無需繁瑣的線纜。無論是在會議室、教室或家庭,其吸引力都在於輕鬆的連接、靈敏的性能和跨裝置的兼容性。這種跨產業的應用正在推動北美、亞太地區以及全球其他不斷發展的數位生態系統對無線顯示器的需求。
| 市場範圍 | |
|---|---|
| 起始年份 | 2024 |
| 預測年份 | 2025-2034 |
| 起始值 | 60.3億美元 |
| 預測值 | 198.6億美元 |
| 複合年成長率 | 12.7% |
2024年,硬體市場規模達26.1億美元。該領域持續吸引企業、教育工作者和消費者對直覺、無線顯示解決方案的需求。投射加密狗、適配器、顯示接收器和整合智慧螢幕等產品,可在各種裝置上輕鬆實現高品質的螢幕鏡像。這些硬體工具支援流行的無線協議和標準,可在工作場所、教育環境和娛樂系統中提供即插即用的兼容性。
2024年,全高清(1080p)解析度市場規模達21.3億美元。全高清憑藉其低延遲、低頻寬消耗的出色表現,依然是眾多設備中最受歡迎的解析度標準。隨著視訊通話、教育課程和娛樂應用中對流暢螢幕共享和串流媒體播放的需求日益成長,全高清憑藉高效的性能持續滿足用戶期望。其在筆記型電腦、投影機、行動裝置和電視領域的廣泛應用,進一步鞏固了其在無線顯示領域的地位。
美國無線顯示市場在2024年創造了16.2億美元的產值,預計到2034年將以13.2%的複合年成長率成長。無線顯示解決方案需求的成長與遠端和混合工作模式的激增以及智慧型裝置在家庭中的廣泛使用密切相關。美國強大的科技基礎設施加速了跨平台螢幕鏡像工具在企業和消費者環境中的普及。隨著學校、企業和娛樂供應商對無縫即時顯示技術的依賴日益增加,美國市場將繼續在塑造全球趨勢方面發揮關鍵作用。
無線顯示市場的知名公司包括LG電子公司、亞馬遜公司、巴可公司、蘋果公司、Netgear公司、ScreenBeam公司、夏普公司、明基電通公司、英特爾公司、谷歌公司、三星電子有限公司、戴爾科技公司、微軟公司和Airtame ApS。為了提升市場佔有率,無線顯示公司正在採取專注於跨平台相容性、整合和創新的策略。許多領先公司正在投資研發,以推出支援多種無線協定(如Miracast、AirPlay和Chromecast)的產品,確保廣泛的設備互通性。擴大與原始設備製造商(OEM)和設備製造商的合作夥伴關係,使參與者能夠將無線顯示技術直接嵌入到智慧電視、投影機、筆記型電腦和行動裝置中。
目錄
第1章:方法論與範圍
第2章:執行摘要
第3章:行業洞察
- 產業生態系統分析
- 供應商概況
- 利潤率
- 成本結構
- 每個階段的增值
- 影響價值鏈的因素
- 中斷
- 產業衝擊力
- 成長動力
- 智慧型電視和智慧型手機普及率激增
- 對 BYOD 和混合工作模式的需求不斷成長
- 線上學習與教育科技平台的擴展
- 串流媒體服務和遊戲平台的激增
- Wi-Fi 6/6e 和 5G 連線的進步
- 產業陷阱與挑戰
- 互通性和設備相容性問題
- 延遲、訊號干擾和頻寬限制
- 市場機會
- 與統一通訊平台整合
- 智慧教室和數位化學習的應用
- 汽車資訊娛樂系統的擴展
- 用於遠端工作的基於雲端的無線顯示
- 成長動力
- 成長潛力分析
- 監管格局
- 北美洲
- 歐洲
- 亞太地區
- 拉丁美洲
- 中東和非洲
- 波特的分析
- PESTEL分析
- 技術和創新格局
- 當前的技術趨勢
- 新興技術
- 價格趨勢
- 按地區
- 按產品
- 定價策略
- 新興商業模式
- 合規性要求
- 永續性措施
- 消費者情緒分析
- 專利和智慧財產權分析
- 地緣政治與貿易動態
第4章:競爭格局
- 公司簡介 市佔率分析
- 公司市佔率分析
- 按地區
- 北美洲
- 歐洲
- 亞太地區
- 市場集中度分析
- 關鍵參與者的競爭基準化分析
- 財務績效比較
- 收入
- 利潤率
- 研發
- 產品組合比較
- 產品範圍廣度
- 科技
- 創新
- 地理分佈比較
- 全球足跡分析
- 服務網路覆蓋
- 各地區市場滲透率
- 競爭定位矩陣
- 領導者
- 挑戰者
- 追蹤者
- 利基市場參與者
- 戰略展望矩陣
- 財務績效比較
- 2021-2024 年關鍵發展
- 併購
- 夥伴關係與合作
- 技術進步
- 擴張和投資策略
- 永續發展計劃
- 數位轉型計劃
- 新興/新創企業競爭對手格局
第5章:市場估計與預測:依組件分類,2021 - 2034 年
- 主要趨勢
- 硬體
- 顯示裝置
- 智慧電視
- 監視器
- 投影儀
- 無線適配器
- 傳輸和通訊模組
- 天線
- 接收器
- 中繼器
- 其他
- 顯示裝置
- 軟體
- 面向消費者的軟體
- 企業/協作軟體
- 內容管理與媒體平台
- 安全和設備管理軟體
- 其他
- 服務
- 設定和安裝
- 維護與支援
- 基於雲端的串流媒體
第6章:市場估計與預測:依決議,2021 - 2034 年
- 主要趨勢
- 高清(720p)
- 全高清(1080p)
- 4K 超高清
- 8K以上
第7章:市場估計與預測:按技術,2021 - 2034 年
- 主要趨勢
- WiDi(英特爾無線顯示)
- Miracast
- AirPlay
- Google Cast(Chromecast)
- 其他
第 8 章:市場估計與預測:按最終用途產業,2021 年至 2034 年
- 主要趨勢
- 消費性電子產品
- 家庭娛樂
- 遊戲機和電腦
- 智慧音箱
- 家庭自動化
- 其他
- 衛生保健
- 病人監護系統
- 醫療影像顯示器
- 外科手術室
- 培訓和電子學習
- 其他
- 教育
- 線上學習
- 智慧校園
- 互動式白板和投影儀
- 教育內容串流媒體
- 其他
- 政府和國防
- 指揮與控制中心
- 公共部門辦公室和行政部門
- 監控和監視顯示器
- 軍事訓練與模擬
- 其他
- 媒體和娛樂
- 廣播
- 後製和編輯套件
- 電影院和劇院數位投影
- 活動和音樂會視覺展示
- 其他
- 零售
- 數位看板和廣告
- 互動式資訊亭和店內展示
- 銷售點(POS)系統
- 其他
- 工業/企業
- 控制室
- 視訊會議
- 工廠車間監控
- 培訓和入職展示
- 其他
- 其他
第9章:市場估計與預測:按地區,2021 - 2034
- 主要趨勢
- 北美洲
- 美國
- 加拿大
- 歐洲
- 德國
- 英國
- 法國
- 義大利
- 西班牙
- 荷蘭
- 歐洲其他地區
- 亞太地區
- 中國
- 印度
- 日本
- 韓國
- 澳洲
- 亞太其他地區
- 拉丁美洲
- 巴西
- 墨西哥
- 阿根廷
- 拉丁美洲其他地區
- 中東和非洲
- 阿拉伯聯合大公國
- 沙烏地阿拉伯
- 南非
- MEA 其餘地區
第10章:公司簡介
- 全球參與者:
- Amazon.com, Inc.
- Apple Inc.
- Barco NV
- Dell Technologies Inc.
- Google LLC
- HP Inc.
- Intel Corporation
- Lenovo Group Limited
- LG Electronics Inc.
- Microsoft Corporation
- Panasonic Corporation
- Samsung Electronics Co., Ltd.
- Sharp Corporation
- 區域參與者:
- Belkin International, Inc.
- Epson America, Inc.
- Netgear Inc.
- Vanco International, LLC
- 新興參與者:
- Actiontec Electronics, Inc.
- Airtame ApS
- BenQ Corporation
- ScreenBeam Inc.
The Global Wireless Display Market was valued at USD 6.03 billion in 2024 and is estimated to grow at a CAGR of 12.7% to reach USD 19.86 billion by 2034.
This growth trajectory is driven by increasing adoption of smartphones and smart TVs, the widespread implementation of BYOD trends and hybrid work environments, the rapid scaling of online education models, and the rising use of wireless displays in both consumer and professional spaces. Continued progress in Wi-Fi 6/6E and 5G technologies is enhancing wireless connectivity, making screen casting and device interoperability faster and more reliable. The shift toward wireless communication within smart homes and workplaces underscores the growing demand for seamless, high-definition content sharing. Wireless display solutions support real-time collaboration and content distribution without the clutter of cables. Whether in boardrooms, classrooms, or households, the appeal lies in effortless connectivity, responsive performance, and compatibility across devices. This cross-sector adoption is fueling demand for wireless displays across North America, Asia-Pacific, and other growing digital ecosystems worldwide.
| Market Scope | |
|---|---|
| Start Year | 2024 |
| Forecast Year | 2025-2034 |
| Start Value | $6.03 billion |
| Forecast Value | $19.86 billion |
| CAGR | 12.7% |
In 2024, the hardware segment generated USD 2.61 billion. It continues to attract demand from businesses, educators, and consumers seeking intuitive, cable-free display solutions. Products such as casting dongles, adapters, display receivers, and integrated smart screens enable easy, high-quality screen mirroring across a variety of devices. These hardware tools support popular wireless protocols and standards, offering plug-and-play compatibility in workspaces, education settings, and entertainment systems.
The Full HD (1080p) resolution segment generated USD 2.13 billion in 2024. Full HD remains the most preferred resolution standard across a broad range of devices due to its ability to deliver crisp visuals with low latency while maintaining moderate bandwidth consumption. As demand increases for fluid screen-sharing and streaming in video calls, educational sessions, and entertainment applications, Full HD continues to meet user expectations with efficient performance. Its broad adoption in laptops, projectors, mobile devices, and TVs further strengthens its position in the wireless display landscape.
United States Wireless Display Market generated USD 1.62 billion in 2024 and is expected to grow at a CAGR of 13.2% through 2034. The rise in demand for wireless display solutions is closely tied to the surge in remote and hybrid work models and the widespread use of smart devices across households. The country's robust tech infrastructure has accelerated the adoption of cross-platform screen mirroring tools in both enterprise and consumer settings. As schools, corporations, and entertainment providers increase reliance on seamless, real-time display technologies, the U.S. market continues to play a pivotal role in shaping global trends.
Prominent companies operating in the wireless display market include LG Electronics Inc., Amazon.com, Inc., Barco NV, Apple Inc., Netgear Inc., ScreenBeam Inc., Sharp Corporation, BenQ Corporation, Intel Corporation, Google LLC, Samsung Electronics Co., Ltd., Dell Technologies Inc., Microsoft Corporation, and Airtame ApS. To enhance their market presence, wireless display companies are adopting strategies focused on cross-platform compatibility, integration, and innovation. Many leading firms are investing in R&D to launch products that support multiple wireless protocols like Miracast, AirPlay, and Chromecast, ensuring wide device interoperability. Expanding partnerships with OEMs and device manufacturers allows players to embed wireless display technologies directly into smart TVs, projectors, laptops, and mobile devices.
Table of Contents
Chapter 1 Methodology and Scope
- 1.1 Market scope and definition
- 1.2 Research design
- 1.2.1 Research approach
- 1.2.2 Data collection methods
- 1.3 Data mining sources
- 1.3.1 Global
- 1.3.2 Regional/Country
- 1.4 Base estimates and calculations
- 1.4.1 Base year calculation
- 1.4.2 Key trends for market estimation
- 1.5 Primary research and validation
- 1.5.1 Primary sources
- 1.6 Forecast model
- 1.7 Research assumptions and limitations
Chapter 2 Executive Summary
- 2.1 Industry 3600 synopsis
- 2.2 Key market trends
- 2.2.1. Component
- 2.2.2 Resolution
- 2.2.3 Technology
- 2.2.4 End Use Industry
- 2.2.5 North America
- 2.2.6 Europe
- 2.2.7 Asia Pacific
- 2.2.8 Latin America
- 2.2.9 Middle East & Africa
- 2.3 TAM Analysis, 2025-2034 (USD Million)
- 2.4 CXO perspective: Strategic imperatives
- 2.5 Executive decision points
- 2.6 Critical Success Factors
- 2.7 Future Outlook and Strategic Recommendations
Chapter 3 Industry Insights
- 3.1 Industry ecosystem analysis
- 3.1.1 Supplier Landscape
- 3.1.2 Profit Margin
- 3.1.3 Cost structure
- 3.1.4 Value addition at each stage
- 3.1.5 Factor affecting the value chain
- 3.1.6 Disruptions
- 3.2 Industry impact forces
- 3.2.1 Growth drivers
- 3.2.1.1 Surge in smart TV and smartphone adoption
- 3.2.1.2 Rising demand for BYOD and hybrid work models
- 3.2.1.3 Expansion of online learning and edtech platforms
- 3.2.1.4 Proliferation of streaming services and gaming platforms
- 3.2.1.5 Advancements in Wi-Fi 6/6e and 5G connectivity
- 3.2.2 Industry pitfalls and challenges
- 3.2.2.1 Interoperability and device compatibility issues
- 3.2.2.2 Latency, signal interference, and bandwidth limitations
- 3.2.3 Market Opportunities
- 3.2.3.1 Integration with unified communication platforms
- 3.2.3.2 Adoption in smart classrooms and digital learning
- 3.2.3.3 Expansion in automotive infotainment systems
- 3.2.3.4 Cloud-based wireless display for remote work
- 3.2.1 Growth drivers
- 3.3 Growth potential analysis
- 3.4 Regulatory landscape
- 3.4.1 North America
- 3.4.2 Europe
- 3.4.3 Asia Pacific
- 3.4.4 Latin America
- 3.4.5 Middle East & Africa
- 3.5 Porter’s analysis
- 3.6 PESTEL analysis
- 3.7 Technological and Innovation landscape
- 3.7.1 Current technological trends
- 3.7.2 Emerging technologies
- 3.8 Price Trends
- 3.8.1 By region
- 3.8.2 By product
- 3.9 Pricing strategies
- 3.10 Emerging business models
- 3.11 Compliance requirements
- 3.12 Sustainability measures
- 3.13 Consumer sentiment analysis
- 3.14 Patent and IP analysis
- 3.15 Geopolitical and trade dynamics
Chapter 4 Competitive Landscape, 2024
- 4.1 Introduction Company market share analysis
- 4.2 Company market share analysis
- 4.2.1 By region
- 4.2.1. North America
- 4.2.2. Europe
- 4.2.3. Asia Pacific
- 4.2.2 Market concentration analysis
- 4.3 Competitive Benchmarking of key Players
- 4.3.1 Financial Performance Comparison
- 4.3.1.1. Revenue
- 4.3.1.2. Profit Margin
- 4.3.1.3. R&D
- 4.3.2 Product Portfolio Comparison
- 4.3.2.1. Product Range Breadth
- 4.3.2.2. Technology
- 4.3.2.3. Innovation
- 4.3.3 Geographic Presence Comparison
- 4.3.3.1. Global Footprint Analysis
- 4.3.3.2. Service Network Coverage
- 4.3.3.3. Market Penetration by Region
- 4.3.4 Competitive Positioning Matrix
- 4.3.4.1. Leaders
- 4.3.4.2. Challengers
- 4.3.4.3. Followers
- 4.3.4.4. Niche Players
- 4.3.5 Strategic outlook matrix
- 4.3.1 Financial Performance Comparison
- 4.4 Key developments, 2021-2024
- 4.4.1 Mergers and Acquisitions
- 4.4.2 Partnerships and Collaborations
- 4.4.3 Technological Advancements
- 4.4.4 Expansion and Investment Strategies
- 4.4.5 Sustainability Initiatives
- 4.4.6 Digital Transformation Initiatives
- 4.5 Emerging/ Startup Competitors Landscape
Chapter 5 Market Estimates & Forecast, By Component, 2021 - 2034 (USD Billion & Units)
- 5.1 Key trends
- 5.2 Hardware
- 5.2.1 Display devices
- 5.2.1.1 Smart TVs
- 5.2.1.2 Monitors
- 5.2.1.3 Projectors
- 5.2.2 Wireless adapters
- 5.2.3 Transmission & communication modules
- 5.2.4 Antennas
- 5.2.5 Receivers
- 5.2.6 Repeaters
- 5.2.7 Others
- 5.2.1 Display devices
- 5.3 Software
- 5.3.1 Consumer-oriented software
- 5.3.2 Enterprise / collaboration software
- 5.3.3 Content management & media platforms
- 5.3.4 Security & device management software
- 5.3.5 Others
- 5.4 Services
- 5.4.1 Setup & installation
- 5.4.2 Maintenance & support
- 5.4.3 Cloud-based streaming
Chapter 6 Market estimates & forecast, By Resolution, 2021 - 2034 (USD Billion & Units)
- 6.1 Key trends
- 6.2 HD (720p)
- 6.3 Full HD (1080p)
- 6.4 4K Ultra HD
- 6.5 8K and Above
Chapter 7 Market estimates & forecast, By Technology, 2021 - 2034 (USD Billion & Units)
- 7.1 Key trends
- 7.2 WiDi (Intel Wireless Display)
- 7.3 Miracast
- 7.4 AirPlay
- 7.5 Google Cast (Chromecast)
- 7.6 Others
Chapter 8 Market Estimates and Forecast, By End Use Industry, 2021 - 2034 ( USD Billion & Units)
- 8.1 Key trends
- 8.2 Consumer electronics
- 8.2.1 Home entertainment
- 8.2.2 Gaming consoles & PCs
- 8.2.3 Smart speakers
- 8.2.4 Home automation
- 8.2.5 Others
- 8.3 Healthcare
- 8.3.1 Patient monitoring systems
- 8.3.2 Medical imaging display
- 8.3.3 Surgery & operation theaters
- 8.3.4 Training & e-learning
- 8.3.5 Others
- 8.4 Education
- 8.4.1 Online learning
- 8.4.2 Smart campuses
- 8.4.3 Interactive whiteboards & projectors
- 8.4.4 Educational content streaming
- 8.4.5 Others
- 8.5 Government & defense
- 8.5.1 Command & control centers
- 8.5.2 Public sector offices & administration
- 8.5.3 Surveillance & monitoring displays
- 8.5.4 Military training & simulation
- 8.5.5 Others
- 8.6 Media & entertainment
- 8.6.1 Broadcasting
- 8.6.2 Post-production & editing suites
- 8.6.3 Cinema & theater digital projection
- 8.6.4 Event & concert visual displays
- 8.6.5 Others
- 8.7 Retail
- 8.7.1 Digital signage & advertising
- 8.7.2 Interactive kiosks & in-store displays
- 8.7.3 Point of Sale (POS) systems
- 8.7.4 Others
- 8.8 Industrial / enterprise
- 8.8.1 Control rooms
- 8.8.2 Video conferencing
- 8.8.3 Factory floor monitoring
- 8.8.4 Training & onboarding displays
- 8.8.5 Others
- 8.9 Others
Chapter 9 Market Estimates and Forecast, By Region, 2021 - 2034 (USD Billion & Units)
- 9.1 Key trends
- 9.2 North America
- 9.2.1 U.S.
- 9.2.2 Canada
- 9.3 Europe
- 9.3.1 Germany
- 9.3.2 U.K.
- 9.3.3 France
- 9.3.4 Italy
- 9.3.5 Spain
- 9.3.6 Netherlands
- 9.3.7 Rest of Europe
- 9.4 Asia Pacific
- 9.4.1 China
- 9.4.2 India
- 9.4.3 Japan
- 9.4.4 South Korea
- 9.4.5 Australia
- 9.4.6 Rest of Asia Pacific
- 9.5 Latin America
- 9.5.1 Brazil
- 9.5.2 Mexico
- 9.5.3 Argentina
- 9.5.4 Rest of Latin America
- 9.6 Middle East & Africa
- 9.6.1 UAE
- 9.6.2 Saudi Arabia
- 9.6.3 South Africa
- 9.6.4 Rest of MEA
Chapter 10 Company Profile
- 10.1 Global Players:
- 10.1.1 Amazon.com, Inc.
- 10.1.2 Apple Inc.
- 10.1.3 Barco NV
- 10.1.4 Dell Technologies Inc.
- 10.1.5 Google LLC
- 10.1.6 HP Inc.
- 10.1.7 Intel Corporation
- 10.1.8 Lenovo Group Limited
- 10.1.9 LG Electronics Inc.
- 10.1.10 Microsoft Corporation
- 10.1.11 Panasonic Corporation
- 10.1.12 Samsung Electronics Co., Ltd.
- 10.1.13 Sharp Corporation
- 10.2 Regional Players:
- 10.2.1 Belkin International, Inc.
- 10.2.2 Epson America, Inc.
- 10.2.3 Netgear Inc.
- 10.2.4 Vanco International, LLC
- 10.3 Emerging Players:
- 10.3.1 Actiontec Electronics, Inc.
- 10.3.2 Airtame ApS
- 10.3.3 BenQ Corporation
- 10.3.4 ScreenBeam Inc.
 無線顯示器:市場佔有率分析、產業趨勢與統計、成長預測(2026-2031)
 無線顯示市場:按組件、連接方式、應用、顯示技術和最終用戶分類-2026-2032年全球市場預測
 全球無線顯示市場規模、佔有率、趨勢和成長分析報告(2026-2034年)
 2026年全球無線顯示市場報告
 無線顯示市場規模、佔有率及成長分析(按組件、技術、最終用戶和地區分類)-2026-2033年產業預測
 無線顯示市場-全球產業規模、佔有率、趨勢、機會和預測,依技術類型、顯示類型、最終用戶、地區和競爭格局分類,2020-2030年預測
 全球無線顯示市場:市場規模、市場佔有率、趨勢分析(按內容、應用、技術和地區)、展望和未來預測(2024-2031 年)
 無線顯示市場規模、佔有率和趨勢分析報告:按產品、按技術、按最終用途、按地區、細分市場預測,2024-2030 年無線顯示器市場:各技術,各用途,各提供,各地區,2024年~2031年